

Abstract
Cell state is often assayed through measurement of biochemical and biophysical markers. Although biochemical markers have been widely used, intrinsic biophysical markers, such as the ability to mechanically deform under a load, are advantageous in that they do not require costly labeling or sample preparation. However, current techniques that assay cell mechanical properties have had limited adoption in clinical and cell biology research applications. Here, we demonstrate an automated microfluidic technology capable of probing single-cell deformability at approximately 2,000 cells/s. The method uses inertial focusing to uniformly deliver cells to a stretching extensional flow where cells are deformed at high strain rates, imaged with a high-speed camera, and computationally analyzed to extract quantitative parameters. This approach allows us to analyze cells at throughputs orders of magnitude faster than previously reported biophysical flow cytometers and single-cell mechanics tools, while creating easily observable larger strains and limiting user time commitment and bias through automation. Using this approach we rapidly assay the deformability of native populations of leukocytes and malignant cells in pleural effusions and accurately predict disease state in patients with cancer and immune activation with a sensitivity of 91% and a specificity of 86%. As a tool for biological research, we show the deformability we measure is an early biomarker for pluripotent stem cell differentiation and is likely linked to nuclear structural changes. Microfluidic deformability cytometry brings the statistical accuracy of traditional flow cytometric techniques to label-free biophysical biomarkers, enabling applications in clinical diagnostics, stem cell characterization, and single-cell biophysics.
Keywords: flow cytometry, high-throughput, cytology, mechanophenotype
There is growing evidence that cell deformability (i.e., the ability to change shape under load) is a useful indicator of changes in the cytoskeleton and nuclear organization and may provide a label-free biomarker for determining cell states or properties such as metastatic potential (1–3), cell cycle stage (4), degree of differentiation (5, 6), and leukocyte activation (7). Clinically, a measure of malignancy and metastatic potential in tissues or biological fluids could guide treatment decisions, or a measure of degree of differentiation could prevent transplantation of undifferentiated, tumorigenic stem cells in regenerative therapies. For drug discovery and personalized medicine, a simple measure of cytoskeletal integrity could allow screening for cytoskeletal-acting drugs or evaluation of cytoskeletal drug resistance in biopsied samples. Additionally, measures of leukocyte activation are strong predictors of disease prognosis and response to treatment in persons with HIV-1 infection (8) or rejection of allografts (9). Currently, major barriers to clinical use of flow cytometry-based assays for these applications are requirements for costly fluorescent-labeled antibodies and skilled technicians to prepare samples and interpret results. A simple label-free deformability measurement in which cells are minimally handled thus has the potential to greatly reduce costs and allow routine cell screening and classification in clinical and research applications (10).
A wide variety of platforms have been engineered to perform mechanical measurements on cells (11). Generally, these techniques can be divided into two categories based on the samples they act on: bulk and single cell (12). Bulk platforms, such as microfiltration, tend to have high-throughput, but they yield one endpoint measurement and do not take into account heterogeneity or size differences within the sample population of cells. Disease may develop from abnormalities in a single cell (12) or small subset, such that accurately detecting rare events or small populations is important, and bulk measurement may result in misleading averages (13). Single-cell platforms that can assay this heterogeneity include micropipette aspiration (5), atomic force microscopy (AFM) (3), magnetic bead-based rheology, microfluidic optical stretching (2, 14), and microfluidic cell transit analyzers (12, 15–17). In particular, microfluidic single-cell mechanics assays have been promising, yielding more automated measurements through microscopically observed cell transit through microchannels or pores (12, 15–17). In these approaches the transit time at a constant pressure is indicative of mechanical properties; however, cell size and adhesiveness also can contribute to the measurement, which is especially relevant when dealing with heterogeneous cell solutions. In general, current approaches, usually optimized for biophysics research, operate at rates from 1 cell per min (AFM and optical stretching) to approximately 1–5 cells per s (microfluidic cell transit analyzers, electroporative flow cytometry; ref. 18).
A unique combination of inertial focusing, hydrodynamic stretching, and automated image analysis enables us to carry out tunable single-cell mechanical measurements of cells with a throughput several orders of magnitude greater than current systems (approximately 2,000 cells per s). Cells are carried and measured surrounded by fluid, and never contact, adhere to, or foul channel surfaces, which can lead to clogging. Moreover, the method results in high strains, which are easy to visualize, and high strain rates, which deliver unique insights into cell mechanics. The large observed strains are due to stresses approximately an order of magnitude greater than current methods (SI Text) (19).
Briefly, we employ inertial focusing, a sheathless method of ordering cells in flow (20–22), to deliver suspended cells uniformly to an extensional flow (23) region where they are deformed (Fig. 1 A–D). Uniform delivery leads to increased uniformity in the hydrodynamic stresses and resulting deformation of individual cells (Movie S1). A microfluidic approach also allows tuning of the magnitude of hydrodynamic stresses, which is important to be able to obtain sensitive measurements for cells with a range of deformabilities (Fig. S1 and Movies S1–S3). After entering the extensional flow region, an inverted microscope-mounted high-speed camera records several thousand deformations per second. Then, an automated image analysis algorithm finds and tracks cells to quantify initial diameter and deformability (the length of the long axis of a deformed cell divided by a perpendicular shorter axis), which are plotted in flow cytometry-like 2D scatter plots (Fig. 1 E–F and Fig. S2). This automation limits user bias and strengthens repeatability, which are notable issues with manual mechanical measurements. Further, the ability to measure whole-cell deformation of spherical cells in suspension limits variability due to the contact point of AFM tips or micropipettes on mechanically heterogeneous attached cells (e.g., significant differences in stiffness in the vicinity or far from actin stress fibers) (24). However, in cases where this heterogeneity during adhesion is of interest, we cannot directly probe cells (a task that can be performed by AFM and micropipettes).
Fig. 1.

Principles of deformability cytometry. (A) A photograph of the microscope-mounted and fluid-coupled microfluidic deformability cytometry device. Only a single inlet is required. (Scale bar: 25 mm.) (B) A schematic of the microfluidic device (channel height = 28 μm) that focuses cells to the channel centerline before delivering them to the stretching extensional flow is shown. Cells can enter the extensional flow from both directions. (C) A schematic of the deformation of a cell delivered to the center of an extensional flow by being previously aligned at an inertial focusing position, Xeq is shown. (D) High-speed microscopic images showing a focused cell entering the extensional flow region. Delivery and stretching occurs in less than 30 μs. (Scale bar: 40 μm.) (E) Definitions of the shape parameters extracted from images are shown. (F) Density scatter plot of 9,740 size and deformability measurements of single human embryonic stem cells.
In this work, we thoroughly characterize the method and provide demonstrations of its robustness and utility with more than 100,000 single-cell mechanical measurements: in clinical screening of pleural fluids for malignant cells and characterization of stem cell differentiation state. Mechanistic and experimental details are provided in the SI Materials and Methods. Specifically, we discuss modes of deformation, standard operating protocols (cell densities, flow rates), and methods of controlling for mechanical drift (Fig. S3) that occurs when adherent cells are brought into suspension.
Results and Discussion
Validation and Calibration of Measurements.
Clearly, cells are complex viscoelastic objects; however, we investigated the deformation of several simple model systems to validate and calibrate our measurements. Surfactant-stabilized oil droplets of low surface tension and known viscosity were measured to confirm that deformability cytometry could distinguish between objects of different viscoelastic properties. Droplets from 500 to 10,000 cSt, deformed an amount trending with their internal viscosity (external viscosity was held constant; see SI Materials and Methods, Fig. S4, and Movies S4–S6), allowing for evaluation of an effective viscosity of a deformed cell. We describe the viscosities of these emulsions as ratios of their internal dynamic viscosity, μi, to that of water, μo(λ = μi/μo) (25, 26). Cell mechanical behavior is predominantly determined by viscous properties at high strain rates (27, 28). Generally, cells deformed like emulsions with λ < 9,650. As further validation, we also see a large decrease in deformability upon chemically cross-linking proteins in HeLa cells (cervical carcinoma cells fixed with 4% formaldehyde; see Fig. S4).
Next, we characterized the intrinsic noise level of deformability cytometry by measuring physical properties of rigid polystyrene microspheres (Fig. S4 and Movie S7). The semiinterquartile range of the deformability measurement was an order of magnitude lower than that of a cancer cell line, suggesting that variability in cellular deformation measures is not because of measurement error. A correctable systematic error in the deformability of these rigid particles was also observed, which can be attributed to 1 μs exposure time blur in the direction of particle motion.
Certainly, a barrier to translation of biophysical measurements is repeatability and variability between labs. We measured the deformability of the breast cancer epithelial MCF7 cell line on different days in different replicas of the device and found no statistical difference (nonparametric Wilcoxon ranked sum; P = 0.22; Fig. S3). It will still be important to confirm this minimal variability when the technique is applied in other labs.
Identification of Inflammation and Malignancy in Pleural Fluids.
Confident in the accuracy of our deformability measurements, we initiated studies to examine the mechanical properties of cells suspended within blood and pleural fluids, analysis of which provides insight into various diseases such as inflammation, bacterial infections, and tumor progression (3). It has been hypothesized that the invasiveness of metastatic cells, which may accumulate in these fluids, is conferred by increased deformability (1), and there is a precedent for using mechanical measurements of small sample sizes of biopsied cells for clinical diagnostics (29) in which mechanical measurements correlated with current immunohistochemical methods (3). Work by Cross et al. (3) showed that metastatic cancer cells disseminated in pleural fluid were 70% softer than benign cells from the same sample (N = 40 cells), and Remmerbach et al. (29) found that oral squamous cell carcinoma cells obtained by mucosal biopsy were 3.5 times more compliant than cells from healthy patients using a sample of 71 cells. However, in these previous studies, time-consuming protocols are first needed to select cells to measure. By using deformability cytometry, sampling thousands instead of tens of cells is possible such that all cells in a complex population can be measured without preselection. Improved statistical accuracy is conferred, and identification of outlier populations is possible.
Pleural fluid—the fluid that accumulates in the space between the lungs and the chest cavity—is of diagnostic importance for metastatic disease. Cytological examination of pleural fluids for detection of malignancy is not always reliable, with an overall sensitivity rate ranging from 40–90%, with higher false-negative rates for mesotheliomas and lymphomas (30, 31). Furthermore, the preparation of cell smears and blocks (Fig. 2 D–G, Right) requires technician-intensive fixation, labeling, and sample preparation, followed by manual microscopic scanning of slides by the cytopathologist to visually identify cells with suspicious features. Immunofluorescence flow cytometry is not routinely performed in the clinic. The reason is that the reagents and instruments for these systems must be routinely calibrated—(i) the fluorophore-conjugated antibody must have extensive quality control to make sure there are minimal batch-to-batch variations in fluorescence; (ii) the flow cytometer laser power and detector sensitivity must also be routinely calibrated with uniform intensity standard fluorescent beads. Notably, a deformability measurement is an intrinsic property of a cell and therefore does not depend on the quality of a label or power of a detector.
Fig. 2.
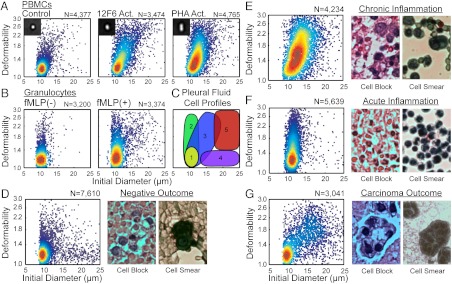
Mechanical measurements help distinguish populations of cells within blood and pleural fluids. (A) Density scatter plots of the size and deformability of untreated PBMCs and PBMCs stimulated with 12F6 or PHA. (B) Density scatter plots of the size and deformability of untreated granulocytes and granulocytes stimulated with N-formyl-methionine-leucine-phenylalanine. (C) Locations of cell populations found in pleural fluids on a size-deformability map: (i) nonactivated leukocytes, (ii) nonactivated leukocytes, (iii) activated mononuclear cells, (iv) mesothelial cells, (v) suspicious cells. Density scatter plot of the size and deformability (Left) and typical cell blocks and smears (Right) of cells within pleural fluid of a patient diagnosed: (D) negative for carcinoma, (E) negative for carcinoma but with chronic inflammation, (F) negative for carcinoma but with acute inflammation, and (G) positive for carcinoma.
Pleural fluid contains a high density of blood cells that may obscure cells of interest. To gain insight into how this leukocyte population would appear in the pleural fluid, we first measured the deformability of resting peripheral blood mononuclear cells (PBMCs) and PBMCs activated with an anti-CD3 antibody (12F6) or phytohaemagglutinin (PHA) for 2 d. On average, stimulated PBMCs were much more deformable and slightly larger (12F6 activated PBMCs: median deformability = 1.47, N = 3,474; PHA activated PBMCs: median deformability = 1.45, N = 4,765) than unstimulated PBMCs (median deformability = 1.18, N = 4,377; Fig. 2A). Activated PBMCs deformed similarly to oil-in-water emulsions with λ ≤ 760, whereas untreated control PBMCs deformed similar to emulsions with λ = 970. Microfilaments, microtubules, and the intermediate filament, vimentin, reorganize during activation. It is hypothesized that this reorganization—a loss of rigidity—enables transendothelial migration (32, 33). On the other hand, granulocytes were expected to become less deformable upon stimulation. Here, in vitro activation of granulocytes with N-formyl-methionine-leucine-phenylalanine treatment shifted the median deformability value from 1.19 to 1.33 (P < 0.001, Nresting = 3,200, Nactivated = 3,374) and increased the number of highly deformable cells above deformability = 1.4 (Fig. 2B). Although this observation does not agree with previous studies, previous measurement methods are prone to misinterpret changes in cell size and adhesiveness as increases in cell stiffness (34). Most importantly, we have reproducibly measured these differences and expected to be able to detect these changes for stimulated leukocytes in vivo.
Through characterization of cells from the pleural fluids of 47 patients (Movie S8), we constructed deformability cytometry profiles of the primary cell populations associated with the common disease states detectable by cytological analysis and developed a 2D gating strategy to classify unknown samples (Fig. 2C). These profiles are based on our initial scatter plots for PBMCs and stimulated PBMCs as well as correlation with the cytology diagnosis. We performed deformability cytometry on pleural effusions collected within the same day in parallel with traditional cytological methods; possible cytological diagnoses included: negative for malignancy, positive for malignancy, acute inflammation associated with an increased neutrophil population, and chronic inflammation—associated with a larger fraction of lymphocytes and histiocytes. In the diagnosed carcinoma cases, the tissue of origin was often known from patient history. Prior to deformability cytometry, any red blood cells in the pleural fluids were hypotonically lysed leaving behind white blood cells, benign mesothelial cells, and cancer cells, if present. Leukocytes make up a majority of the cellular population in pleural fluids, but metastasized tumor cells from ovarian cancer, breast cancer, lung cancer, gastrointestinal track cancer, mesothelioma, and lymphoma can accumulate in the pleural fluid. Benign mesothelial cells, which are contaminants of the thoracentesis—the process of draining pleural fluids—are also present in the samples that we analyzed.
As expected, patients diagnosed as negative for malignancy and lacking diagnoses of acute or chronic inflammation were measured to have small rigid cells, features corresponding to unactivated leukocytes (Fig. 2D). As indicated in cell blocks and cell smears, benign mesothelial cells are also present. These likely appear as large rigid cells in our assay (Fig. 2D, Center). Patient samples with a larger fraction of lymphocytes and histiocytes (tissue macrophages and dendritic cells) due to prolonged immune activation are diagnosed as chronic inflammation. Deformability scatter plots obtained from a majority of these samples show a strong similarity to those for in vitro activation of PBMCs, in which we observe a slight increase in median initial diameter and a large increase in median deformability (Fig. 2E). Pleural fluids from patients with a larger fraction of neutrophils are diagnosed as acute inflammation. In agreement with our in vitro measurements of stimulated neutrophils, we observed many small cells and a greater quantity of highly deformable small cells than for measurements of resting leukocytes (Fig. 2F).
The deformability cytometry profiles of patients diagnosed with malignancy are markedly different from all other outcomes (Fig. 2G). In these cases, we observe many large cells (> 17 μm) which are also highly deformable (> 1.4). Gating in this region for all carcinoma and mesothelioma cases (N = 11), yields a high percentage of cells in this region: 15.7 ± 8.7% (μ ± σ), whereas similar gating of negative outcome cases (N = 9) yields 0.8 ± 0.3% (μ ± σ) in this upper-right quadrant. Thus, if we use less than 1% of cells measuring within the gate as a selection criterion for a true negative outcome, the deformability assays achieve an overall sensitivity of 91% and specificity of 65% in detecting malignancy when screening against all patient outcomes (N = 47). Specificity can be improved to 86% without affecting sensitivity by algorithmically identifying chronic inflammation cases in which there are also large deformable cells that lie on the border of the gate (SI Text, Fig. S5). In some patients with a diagnosed negative outcome, large, rigid putative mesothelial cells are also present, which can confound diagnoses of malignancy based on cell size alone (Fig. 2D, Center). Table S1 contains patient diagnoses based on traditional cytological methods and deformability cytometry.
Given the predictive power of our label-free cytological method, we envision that deformability cytometry could complement histological analysis of pleural fluids following a thoracentesis, or even disaggregated biopsies, with high-throughput ensuring thorough sampling of the tumor mass that is often not possible with manual inspection of pathology slides. As a negative cytology result is not conclusive, the higher sensitivity conferred by deformability cytometry has the potential to eliminate costly patient follow-up procedures and invasive biopsies.
Identification of Stem Cell State.
Leukocyte activation and cancer malignancy often are associated with changes in cell differentiation state. The unique mechanical signatures for these cells directed us to examine the mechanical properties of embryonic stem cells (ESCs). It is currently difficult to confidently discriminate pluripotent stem cells (35), which are being explored for use in cell-based regenerative medicine, from their differentiated progeny using solely biochemical markers. These markers, including SSEA4, OCT4, and NANOG (36), exhibit significant overlap and variable expression over orders of magnitude when measured with flow cytometry (see SI Text for further discussion). We were able to classify stem cells and their differentiated progeny using our high-throughput deformability measurement. Previously, small sample sizes of mouse ESCs (mESCs) and human ESCs (hESCs) and their nuclei were found to be more deformable than their differentiated progeny using atomic force microscopy and micropipette aspiration, suggesting deformability may be a viable biomarker for pluripotency (5, 6). Here, with orders of magnitude higher throughput and statistical significance, we show that differentiated cells generated from mESCs by two alternate methods of differentiation including adherent (median deformability = 1.28; N = 3,427) and embryoid body (EB) differentiation protocols (1.54; N = 1,046) are less deformable than undifferentiated mESC (1.68; N = 3,535) (Fig. 3 A and C). Furthermore, we confirmed this trend with hESCs (median deformability = 1.82; N = 2,523) and hESCs differentiated using an adherent differentiation protocol for 9 d (1.48; N = 1,718) and 14 d (1.59; N = 2,283; Fig. 3 D and H). Interestingly, mESC and hESC were both more deformable than the lowest viscosity emulsions that we were able to measure (λ < 480). Differentiation of hESCs was confirmed by an absence of alkaline phosphatase (AP), reduced expression of SSEA4 and TRA-1-60 observed by flow cytometry, and a reduction of OCT4 protein on days 9 and 14 of the protocol (Fig. 3 E–G). Differentiation of mESCs was confirmed by a reduction of OCT4 protein after EB and adherent differentiation protocols (Fig. 3B). Our data suggest that the deformability biomarker is an earlier indicator of differentiation that precedes loss of OCT4 expression in hESCs given that a statistically significant decrease in deformability for day 9 differentiated cells (P < 0.001) was observed prior to a reduction in OCT4 protein levels. The ability for a biophysical marker to change prior to molecular markers has been observed in neural (37) and mesenchymal stem cells (38) as well.
Fig. 3.
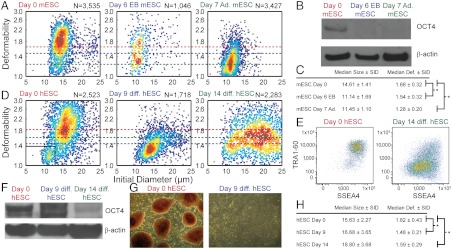
Increased deformability is correlated with increased pluripotency. (A) Density scatter plots of the size and deformability of undifferentiated mESCs, and mESCs differentiated by EB and adherent methods. (B) Cell extracts from undifferentiated day 0 and differentiated day 6 (EB) and day 7 (adherent) mESCs were analyzed for OCT4 protein expression. Decreased OCT4 protein in differentiated mESCs was confirmed by Western blot analysis with antiactin antibodies as a loading control. (C) Median and semi-interquartile deviation (SID) statistics of mESC measurements in part a; * Wilcoxon ranked sum, P < 0.001. (D) Density scatter plots of the size and deformability of undifferentiated hESCs, and hESCs differentiated adherently for 9 d and 14 d. (E) Differentiation of hESCs is accompanied by reduced expression of SSEA4 and TRA-1-60, although significant overlap is observed between populations. (F) Decreased OCT4 protein in differentiated hESCs was confirmed by Western blot analysis with anti-actin antibodies as a loading control. (G) Differentiation of hESCs was also confirmed by an absence of staining by AP. (H) Median and SID statistics of hESC measurements in part a; * Wilcoxon ranked sum, P < 0.001.
Two-dimensional representation of stem cell data as a density scatter plot—similar to traditional flow cytometry plots—reveals large population centered at a deformability of 1.8 and size of 16 μm (88.9%), and a smaller population at 1.15, 11 μm (10.1%) that corresponds with the smaller fibroblast feeder cells used in culture (Fig. 3D, and Fig. S6 for a scatter plot for pure fibroblast feeders). After 14 d of differentiation, we also notice a broad distribution of sizes and deformability (although generally less deformable) that corresponds to the multiple terminally differentiated lineages. Using this type of multiparametric data, we also demonstrated high statistical accuracy of classification for the combination of biophysical biomarkers (i.e., size and deformability). We constructed a classification tree (Fig. S7) to identify undifferentiated hESC and nine-day adherent differentiated hESC with the cost of misclassifying an undifferentiated hESC being four times greater than misclassifying differentiated cells (i.e., the tree was designed to avoid misclassifying undifferentiated cells because they will be especially dangerous if delivered in vivo). The tree achieved an area under the curve (AUC) of 0.91 with a sensitivity of 0.93 and specificity of 0.88, which is comparable to the classification accuracy of a decision tree derived from flow cytometry data (surface markers for pluripotency): an AUC of 0.84, a sensitivity of 0.82, and a specificity of 0.86.
Cytoskeletal and Nuclear Origins of Deformability.
It remains to be seen what molecular changes are responsible for differences in whole-cell deformability upon differentiation; however, the nuclear architecture has been implicated and is easily probed with our large deformation amplitudes. Pajerowski et al. (5) found that nuclear lamins A and C (intermediate filaments absent from pluripotent cells) contributed to measured increases in nuclear stiffness that occurred as cells matured while the stiffer rheological character of the nucleus was dependent on tighter chromatin packing (5). In the process of differentiation, cells gain regions of condensed heterochromatin with which nucleoproteins are more closely associated, whereas these proteins are dynamically associated with a loose chromatin structure in undifferentiated cells (39).
Besides changes in chromatin density and nuclear architecture, cytosolic cytoskeletal components are expected to contribute to cell deformability measurements and response to mechanical stimuli (1). Using our high-throughput measurement system, we studied the effect of cytoskeletal perturbations on whole-cell deformability. We treated HeLa and NIH 3T3 fibroblasts with pharmacological inhibitors of two cytoskeletal components with roles in regulation of cell shape and motility, a compound shown to reorganize keratin intermediate filament networks, as well as an inhibitor of myosin contractility (blebbistatin) and characterized their resistance to deformation (40, 41). As shown in Fig. 4 and Figs. S8 and S9, treatment with these compounds did not have the profound effects on cell deformability observed in the processes of disease (Fig. 2) and differentiation (Fig. 3). Depolymerization of actin with latrunculin A, disruption of the microtubule network with nocodazole, and reorganization of keratin networks with sphingosylphosphorylcholine (42) resulted in small deviations in deformability from that of untreated cells (Fig. 4). Treatment with blebbistatin, which prevents myosin II from generating contractile stresses in the actin network, resulted in more apparent changes, including an increase in the distribution of deformabilities as well as the presence of a larger more deformable population (size > 20 μm and deformability > 2.2) for both HeLa and 3T3 cells.
Fig. 4.

Effects of individual cytoskeletal components on whole-cell deformability. (A) Density scatter plots of the initial diameter and deformability of untreated NIH 3T3 cells (control), 3T3 cells treated with latrunculin A, nocodazole, sphingosylphosphorylcholine, and blebbistatin for 2 h. (B) Median and semi-interquartile deviation (SID) statistics of untreated 3T3 cells and 3T3 cells treated with different concentrations of one of four compounds for 2 h (error bars are SID). “Drug-induced substrate release” indicates that cells detached from the substrate into suspension before the 2-h treatment period elapsed.
Notably, the overall changes in median deformability for all of the cytoskeletal disrupters was small compared to deformability changes observed upon differentiation of stem cells or activation of leukocytes, suggesting that the relative nucleus size, nuclear cytoskeletal components, and chromatin structure may be the dominant molecular changes that our large amplitude and strain rate deformations report on. Cell deformation is likely dominated by the viscous properties of cytoplasmic material and chromatin in the cell, which may be expected given that rigid actin networks are known to fluidize at high strains (43). Beyond the large strains resulting from our method, the large strain rate (approximately 105/s) likely affects the observed mechanical properties (27). Like for magnetic bead twisting cytometry and laser tracking microrheology (28) operating at high frequencies, the observed cell response may be similarly predominantly viscous, and therefore largely independent of cytoskeletal structure. As such, deformability cytometry may complement a low strain, low strain rate method like AFM, which is useful in probing this different regime.
Conclusions
Combined, our results highlight interesting correlations whereby lymphocyte activation and stem cell pluripotency are each associated with increased deformability. Both cell states have been characterized by the presence of loose, open chromatin structures. For a multitude of biophysical questions, the dramatic (> 3 orders of magnitude) increase in throughput provided by deformability cytometry will provide statistically robust answers, enabling discoveries across fields. Further, for pleural fluid diagnostics an automated assay would (i) augment traditional cytology and diagnostic routines without requiring additional sample preparation, (ii) limit operator bias, and (iii) provide a standardized and compact measurement (the deformability scatter plot) useful for quantitative communication of disease states between clinicians. The developed microfluidic instrument integrates label-free physical measurements of cells with the massive throughput and statistical significance of flow cytometry, providing a practical realization of a mechanical biomarker in clinical assays.
Materials and Methods
Device Fabrication and Operation.
Microfluidic devices (Fig. 1) were fabricated using standard photolithographic methods and polydimethylsiloxane replica molding techniques.
Cell suspensions, limited in concentration to 200,000 to 500,00 cells per mL to prohibit coincident cells, were pumped through tubing and the microchannel by a syringe pump (volumetric flow rate ranging from 700 to 1,075 μL/ min. High-speed (142,857 frames per s) microscopic video was recorded, and an automated image analysis algorithm extracted cell size and shape metrics.
Sample Preparation and Measurement.
The cellular content of pleural fluids was concentrated by centrifuge; then red blood cells were lysed with a hypotonic lysis buffer. Remaining nucleated cells were resuspended in phosphate buffered saline and measured with the device.
All hESC experiments were conducted with prior approval from the University of California, Los Angeles Embryonic Stem Cell Research Oversight Committee. Human ESCs and mESCs were maintained in a pluripotent state or differentiated according to established techniques and harvested with trypsin at time points of several days. Harvested cells were resuspended in phosphate buffered saline and measured with the device at controlled times after harvest. See SI Materials and Methods for more detailed methods concerning fabrication, device operation, and sample preparation.
Supplementary Material
Acknowledgments.
We thank Hwee Ng, Mary Levin, Jin Yu-Sheng, Sean O’Byren, Christopher Johnson, Michael Cutidioc, and Amanda Zopfi-Conklin for preparing samples and technical assistance. We thank the University of California, Los Angeles (UCLA) Statistics Consulting Center and Sophia Gkountela for helpful discussions. We also thank the UCLA Academic Technology Services High Performance Computing group for providing computing services and the technical assistance of Prakashan Korambath. This project received funds from the Eli and Edythe Broad Center of Regenerative Medicine and Stem Cell Research (A.T.C.), the David and Lucile Packard Foundation Fellowship (D.D.C.), and a Defense Advanced Research Projects Agency Young Faculty Award (D.D.C.).
Footnotes
Conflict of interest statement: The authors have submitted patent applications related to the presented work.
This article is a PNAS Direct Submission.
This article contains supporting information online at www.pnas.org/lookup/suppl/doi:10.1073/pnas.1200107109/-/DCSupplemental.
References
- 1.Suresh S, et al. Connections between single-cell biomechanics and human disease states: Gastrointestinal cancer and malaria. Acta Biomater. 2005;1:15–30. doi: 10.1016/j.actbio.2004.09.001. [DOI] [PubMed] [Google Scholar]
- 2.Guck J, et al. Optical deformability as an inherent cell marker for testing malignant transformation and metastatic competence. Biophys J. 2005;88:3689–3698. doi: 10.1529/biophysj.104.045476. [DOI] [PMC free article] [PubMed] [Google Scholar]
- 3.Cross SE, Jin Y-S, Rao J, Gimzewski JK. Nanomechanical analysis of cells from cancer patients. Nat Nanotechnol. 2007;2:780–783. doi: 10.1038/nnano.2007.388. [DOI] [PubMed] [Google Scholar]
- 4.Thery M, Bornens M. Get round and stiff for mitosis. HFSP J. 2008;2:65–71. doi: 10.2976/1.2895661. [DOI] [PMC free article] [PubMed] [Google Scholar]
- 5.Pajerowski JD, Dahl KN, Zhong FL, Sammak PJ, Discher DE. Physical plasticity of the nucleus in stem cell differentiation. Proc Natl Acad Sci USA. 2007;104:15619–15624. doi: 10.1073/pnas.0702576104. [DOI] [PMC free article] [PubMed] [Google Scholar]
- 6.Chowdhury F, et al. Material properties of the cell dictate stress-induced spreading and differentiation in embryonic stem cells. Nat Mater. 2010;9(1):82–88. doi: 10.1038/nmat2563. [DOI] [PMC free article] [PubMed] [Google Scholar]
- 7.Khismatullin DB. Current Topics in Membranes. Vol. 64. Burlington, MA: Elsevier, Academic; 2009. The cytoskeleton and deformability of white blood cells; pp. 47–111. [Google Scholar]
- 8.Liu Z, et al. CD8+ T-lymphocyte activation in HIV-1 disease reflects an aspect of pathogenesis distinct from viral burden and immunodeficiency. J Acquired Immune Defic Syndr Hum Retrovirol. 1998;18:332–340. doi: 10.1097/00042560-199808010-00004. [DOI] [PubMed] [Google Scholar]
- 9.Gregson AL, et al. Bronchoalveolar immunologic profile of acute human lung transplant allograft rejection. Transplantation. 2008;85:1056–1059. doi: 10.1097/TP.0b013e318169bd85. [DOI] [PMC free article] [PubMed] [Google Scholar]
- 10.Di Carlo D. A Mechanical biomarker of cell state in medicine. J Lab Autom. 2012;17:32–42. doi: 10.1177/2211068211431630. [DOI] [PubMed] [Google Scholar]
- 11.Kim D-H, Wong PK, Park J, Levchenko A, Sun Y. Microengineered platforms for cell mechanobiology. Annu Rev Biomed Eng. 2009;11:203–233. doi: 10.1146/annurev-bioeng-061008-124915. [DOI] [PubMed] [Google Scholar]
- 12.Rosenbluth MJ, Lam WA, Fletcher DA. Analyzing cell mechanics in hematologic diseases with microfluidic biophysical flow cytometry. Lab Chip. 2008;8:1062–1070. doi: 10.1039/b802931h. [DOI] [PMC free article] [PubMed] [Google Scholar]
- 13.Di Carlo D, Lee LP. Dynamic single-cell analysis for quantitative biology. Anal Chem. 2006;78:7918–7925. doi: 10.1021/ac069490p. [DOI] [PubMed] [Google Scholar]
- 14.Sraj I, et al. Cell deformation cytometry using diode-bar optical stretchers. J Biomed Opt. 2010;15:047010. doi: 10.1117/1.3470124. [DOI] [PMC free article] [PubMed] [Google Scholar]
- 15.Chen J, et al. Classification of cell types using a microfluidic device for mechanical and electrical measurement on single cells. Lab Chip. 2011;11:3174–3181. doi: 10.1039/c1lc20473d. [DOI] [PubMed] [Google Scholar]
- 16.Bow H, et al. A microfabricated deformability-based flow cytometer with application to malaria. Lab Chip. 2011;11:1065–1073. doi: 10.1039/c0lc00472c. [DOI] [PMC free article] [PubMed] [Google Scholar]
- 17.Abkarian M, Faivre M, Stone HA. High-speed microfluidic differential manometer for cellular-scale hydrodynamics. Proc Natl Acad Sci USA. 2006;103:538–542. doi: 10.1073/pnas.0507171102. [DOI] [PMC free article] [PubMed] [Google Scholar]
- 18.Bao N, Zhan Y, Lu C. Microfluidic electroporative flow cytometry for studying single-cell biomechanics. Anal Chem. 2008;80:7714–7719. doi: 10.1021/ac801060t. [DOI] [PubMed] [Google Scholar]
- 19.Rowat AC, Lammerding J, Herrmann H, Aebi U. Towards an integrated understanding of the structure and mechanics of the cell nucleus. Bioessays. 2008;30:226–236. doi: 10.1002/bies.20720. [DOI] [PubMed] [Google Scholar]
- 20.Gossett DR, Di Carlo D. Particle focusing mechanisms in curving confined flows. Anal Chem. 2009;81:8459–8465. doi: 10.1021/ac901306y. [DOI] [PubMed] [Google Scholar]
- 21.Di Carlo D, Irimia D, Tompkins RG, Toner M. Continuous inertial focusing, ordering, and separation of particles in microchannels. Proc Natl Acad Sci USA. 2007;104:18892–18897. doi: 10.1073/pnas.0704958104. [DOI] [PMC free article] [PubMed] [Google Scholar]
- 22.Di Carlo D. Inertial microfluidics. Lab Chip. 2009;9:3038–3046. doi: 10.1039/b912547g. [DOI] [PubMed] [Google Scholar]
- 23.Perkins TT, Smith DE, Chu S. Single polymer dynamics in an elongational flow. Science. 1997;276:2016–2021. doi: 10.1126/science.276.5321.2016. [DOI] [PubMed] [Google Scholar]
- 24.Wottawah F, et al. Optical rheology of biological cells. Phys Rev Lett. 2005;94:098103. doi: 10.1103/PhysRevLett.94.098103. [DOI] [PubMed] [Google Scholar]
- 25.Stone HA, Leal LG. A note concerning drop deformation and breakup in biaxial extensional flows at low Reynolds numbers. J Colloid Interface Sci. 1989;133:340–347. [Google Scholar]
- 26.Mortazavi S, Tryggvason G. A numerical study of the motion of drops in Poiseuille flow Part 1. Lateral migration of one drop. J Fluid Mech. 2000;411:325–350. [Google Scholar]
- 27.Hoffman BD, Crocker JC. Cell mechanics: Dissecting the physical responses of cells to force. Annu Rev Biomed Eng. 2009;11:259–288. doi: 10.1146/annurev.bioeng.10.061807.160511. [DOI] [PubMed] [Google Scholar]
- 28.Massiera G, Citters KMV, Biancaniello PL, Crocker JC. Mechanics of single cells: Rheology, time dependence, and fluctuations. Biophys J. 2007;93:3703–3713. doi: 10.1529/biophysj.107.111641. [DOI] [PMC free article] [PubMed] [Google Scholar]
- 29.Remmerbach TW, et al. Oral cancer diagnosis by mechanical phenotyping. Cancer Res. 2009;69:1728–1732. doi: 10.1158/0008-5472.CAN-08-4073. [DOI] [PubMed] [Google Scholar]
- 30.Sahn SA. The value of pleural fluid analysis. Am J Med Sci. 2008;335:7–15. doi: 10.1097/MAJ.0b013e31815d25e6. [DOI] [PubMed] [Google Scholar]
- 31.Porcel JM. Pearls and myths in pleural fluid analysis. Respirology. 2011;16:44–52. doi: 10.1111/j.1440-1843.2010.01794.x. [DOI] [PubMed] [Google Scholar]
- 32.Brown MJ, Hallam JA, Colucci-Guyon E, Shaw S. Rigidity of circulating lymphocytes is primarily conferred by vimentin intermediate filaments. J Immunol. 2001;166:6640–6646. doi: 10.4049/jimmunol.166.11.6640. [DOI] [PubMed] [Google Scholar]
- 33.Vicente-Manzanares M, Sanchez-Madrid F. Role of the cytoskeleton during leukocyte responses. Nat Rev Immunol. 2004;4:110–122. doi: 10.1038/nri1268. [DOI] [PubMed] [Google Scholar]
- 34.Worthen G, Schwab B, Elson E, Downey G. Mechanics of stimulated neutrophils: Cell stiffening induces retention in capillaries. Science. 1989;245:183–186. doi: 10.1126/science.2749255. [DOI] [PubMed] [Google Scholar]
- 35.Thomson JA, et al. Embryonic stem cell lines derived from human blastocysts. Science. 1998;282:1145–1147. doi: 10.1126/science.282.5391.1145. [DOI] [PubMed] [Google Scholar]
- 36.Adewumi O, et al. Characterization of human embryonic stem cell lines by the International Stem Cell Initiative. Nat Biotechnol. 2007;25:803–816. doi: 10.1038/nbt1318. [DOI] [PubMed] [Google Scholar]
- 37.Keung AJ, de Juan-Pardo EM, Schaffer DV, Kumar S. Rho GTPases mediate the mechanosensitive lineage commitment of neural stem cells. Stem Cells. 2011;29:1886–1897. doi: 10.1002/stem.746. [DOI] [PMC free article] [PubMed] [Google Scholar]
- 38.Fu J, et al. Mechanical regulation of cell function with geometrically modulated elastomeric substrates. Nat Methods. 2010;7:733–736. doi: 10.1038/nmeth.1487. [DOI] [PMC free article] [PubMed] [Google Scholar]
- 39.Meshorer E, Misteli T. Chromatin in pluripotent embryonic stem cells and differentiation. Nat Rev Mol Cell Biol. 2006;7:540–546. doi: 10.1038/nrm1938. [DOI] [PubMed] [Google Scholar]
- 40.Sen S, Kumar S. Cell-matrix de-adhesion dynamics reflect contractile mechanics. Cell Mol Bioeng. 2009;2:218–230. doi: 10.1007/s12195-009-0057-7. [DOI] [PMC free article] [PubMed] [Google Scholar]
- 41.Thery M, et al. The extracellular matrix guides the orientation of the cell division axis. Nat Cell Biol. 2005;7:947–953. doi: 10.1038/ncb1307. [DOI] [PubMed] [Google Scholar]
- 42.Beil M, et al. Sphingosylphosphorylcholine regulates keratin network architecture and visco-elastic properties of human cancer cells. Nat Cell Biol. 2003;5:803–811. doi: 10.1038/ncb1037. [DOI] [PubMed] [Google Scholar]
- 43.Janmey PA, Ursula E, Traub P, Schliwa M. Viscoelastic properties of vimentin compared with other filamentous biopolymer networks. J Cell Biol. 1991;113:155–160. doi: 10.1083/jcb.113.1.155. [DOI] [PMC free article] [PubMed] [Google Scholar]
Associated Data
This section collects any data citations, data availability statements, or supplementary materials included in this article.