

Abstract
In making sense of the visual world, the brain's processing is driven by two factors: the physical information provided by the eyes (“bottom-up” data) and the expectancies driven by past experience (“top-down” influences). We use degraded stimuli to tease apart the effects of bottom-up and top-down processes because they are easier to recognize with prior knowledge of undegraded images. Using machine learning algorithms, we quantify the amount of information that brain regions contain about stimuli as the subject learns the coherent images. Our results show that several distinct regions, including high-level visual areas and the retinotopic cortex, contain more information about degraded stimuli with prior knowledge. Critically, these regions are separate from those that exhibit classical priming, indicating that top-down influences are more than feature-based attention. Together, our results show how the neural processing of complex imagery is rapidly influenced by fleeting experiences.
Keywords: neural decoding, functional MRI, top-down processing, priming, vision
At what stage of visual processing does bottom-up information combine with top-down expectations to yield the eventual percept? This question lies at the heart of a mechanistic understanding of feed-forward/feed-back interactions, as they are implemented in the brain and as they might be instantiated by computational visual systems. Furthermore, this question is of central significance not only for vision, but also for all sensory modalities because the combination of current and prior data is ubiquitous as a processing principle.
A compelling demonstration of the role of prior experience is obtained with images so degraded that they are initially perceived as devoid of meaning. However, after being shown their coherent versions, observers are readily able to parse the previously uninterpretable image. The well-known Dalmatian dog picture (1)—a black-and-white thresholded photograph—and the Mooney images (2) are classic examples of this phenomenon. Other examples of top-down knowledge facilitating sensory processing include phonemic restoration (3) and the interaction between depth perception and object recognition (4).
The approach of comparing neural responses to degraded images before and after exposure to the fully coherent image has been used by several research groups to identify the correlates of top-down processing. For example, PET scans of brain activity elicited by Mooney images before and after disambiguation show that regions of the inferior temporal cortex, as well as the medial and lateral parietal regions, exhibit greater activity in response to recognized images (5). Progressive revealing paradigms, where an image gradually increases in coherence, elicit increased and accelerated functional magnetic resonance imaging (fMRI) activation in several regions, including the fusiform gyrus and the peristriate cortex, when subjects have prior experience with the images (6). In addition, EEG correlates show that distorted or schematic line drawings elicit face-specific N170 event-related potential components, which are believed to reflect activity in the fusiform face area, only after a subject learns to interpret them as a face (7, 8). All of these results indicate that prior experience rapidly modifies brain activity and the final response to a given stimulus. Not surprisingly, much of this modification has been localized in the higher areas of the visual pathway, which are more driven by the object percept that an image induces rather than by its low-level characteristics.
Although these results demonstrate the existence of top-down influences, a critical issue previously left unaddressed is the distinction between traditional priming and an actual increase of image-specific information encoded in a given brain region. Arguably, the true criterion for declaring the presence of learning in a region is that it alters or amplifies stimulus-specific information as encoded in the pattern of activity across the region, rather than merely changing the level of activation as a whole. The critical question is thus: Is a downstream neuron (or a machine learning algorithm) better able to decode which stimulus was seen after exposure to the coherent image, compared with before exposure? If there is no enhancement of such decodability, then that region's activity is likely driven by the physical characteristics of the stimulus, and no learning has occurred—regardless of whether the total activity level in that region has changed.
It is thus critical to explore top-down influences from an information-theoretical perspective. To this end, we adopted a multivariate analytical technique to measure the amount of decodable information in various cortical regions. This involves examining a fine-grained, but potentially weak, pattern of activity across all voxels in a region of the cortex, rather than using a univariate approach that detects which voxels, independently, are significantly more active in one condition versus another.
An algorithm such as a support vector machine (SVM) (9) is a linear classifier that detects the ensemble activation patterns that distinguish two or more categories of data; formally, it projects data onto a high-dimensional hyperplane (where each dimension corresponds to a single voxel's activity in a given region of interest) that maximally separates two or more data clusters in that space. The ability of the SVM to accurately predict to which cluster new data belong corresponds to the amount of information those voxels convey about the cluster labels. That is, SVMs are accurate when voxel activity in their underlying region of interest encodes something about the problem at hand.
Multivariate techniques have been used previously to show how different object categories are represented across the visual cortex (10, 11) and can be used to predict stimuli from a fixed set that a subject is viewing at any given time (12–14). Although the origins of cortical activation patterns are still subject to debate (13–18), it is generally agreed that the ability to decode these patterns reflects how much information the underlying neurons contain about a stimulus in question. In the present context, multivariate analysis gives us a useful tool to investigate whether the amount of information contained in various cortical regions is modulated by a subject's prior knowledge of the stimuli.
Results
The overall methodology that we followed is illustrated in Fig. 1. Black-and-white Mooney images were shown to participants while they were in a fMRI scanner. We examined whether priming the subjects with coherent versions of the Mooney images before each run led to better recognition, and then, using machine learning techniques, we investigated whether neural activity patterns in different regions of the brain showed corresponding increases in information content. This allowed us to identify the neural correlates of prior information processing in the cortex.
Fig. 1.
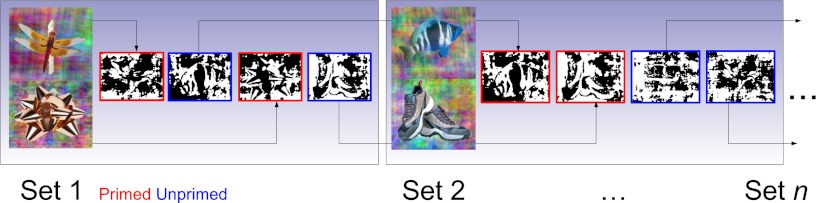
Overall methodology. Before each fMRI run, two images—one containing a natural object and the other an artificial object—were shown. During the run, subjects saw Mooney images of four different objects—the two primed images and two novel images—and were asked to identify the contents of each image as either natural or artificial. For the next set of images, undegraded versions of the two previously unprimed images were used to prime the subject, and two additional novel images were introduced. In this manner, every image (except the first primed and last unprimed images) was shown to the subject in both primed and unprimed conditions.
Our experiments yielded three key results. First, in surprising contrast to inferences from past studies, classically primed voxels were not “information rich.” In other words, decoding accuracy did not improve postpriming across these voxels. Second, a whole-brain analysis revealed that increased recognition accuracy, due to priming, was correlated with an increase in object-related information across many regions of the visual system. Finally, the facilitation of behavioral and neural information was dependent on complex image features (or objects) rather than on simple features like oriented lines.
During each scan, subjects were asked in a two-alternative forced choice (2-AFC) task whether each Mooney image that they saw was of a “natural” or an “artificial” object, as a way of measuring recognition in the scanner. All subjects consistently recognized the primed Mooney images with higher accuracy than the unprimed images in each run (Fig. 2; one-tailed McNemar test, P < 10−10).
Fig. 2.

Behavioral performance recognizing the primed and unprimed Mooney images during the fMRI scans. (A) Across all images, subjects performed significantly better for primed images in a 2-AFC task in which they were asked to indicate whether the image was natural or artificial. Shown is the expected value and 95% confidence intervals for the proportion that was correct over all images and subjects; P value was calculated from a one-tailed–paired McNemar test corrected for multiple comparisons over all subjects and image sets. (B) When images were selected to show a per-image priming effect (resulting in discarding 10 of 38 images), subjects were at chance at recognizing the unprimed images.
If any subject did not show a significant increase in recognition for one of the images (which would occur if the subject recognized the Mooney image in the unprimed condition, or if they did not recognize it in the primed condition), then that image was excluded from further analysis for that subject. From a total of 38 images shown collectively to subjects, 10 were excluded in this manner. For the remaining 28 images, subjects could not recognize the images at greater-than-chance accuracy in the unprimed condition. In addition, they did not learn to recognize the images even after multiple presentations before priming.
Classically Primed Voxels Do Not Necessarily Carry Stimulus-Specific Information.
Past studies (5, 6) have localized cortical areas where activity is elevated post priming using Mooney images. Can a simple increase in activation levels in the primed versus unprimed conditions explain an increase in recognition ability? To address this issue, we used a general linear model (GLM) to find voxels that showed overall priming. Fig. 3 shows the group average primed response over all subjects; the location of these voxels is consistent with past reports (5). Individual subject maps were used to define the region of interest (ROI) on a per-subject basis. A liberal statistical threshold (P < 0.01 and a clustering method to correct for multiple comparisons to P < 0.05) was chosen to ensure that the GLM-selected ROI was not so small as to negatively bias classification. The resulting average size across subjects was just over 2,000 voxels across both hemispheres (for comparison, functionally defined V1 ranged from 100 to 200 voxels per hemisphere, and the fusiform gyrus was about 600 voxels per hemisphere). No significant activation was found for the control contrast, which involved comparing images of natural objects with those of man-made ones (natural > artificial).
Fig. 3.
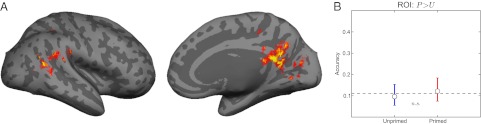
Difference between SVM and GLM results. (A) Group average response showing primed voxels, which show greater activation for primed versus unprimed images in a GLM analysis, here illustrated in red and yellow. (B) When these voxels are used as a region of interest for the SVM analysis, no increase in information decoding is seen, and SVM performance drops to chance. Note that, although we show the group average response here in A, each ROI was determined from a subject's individual data.
To examine whether priming affected the amount of information encoded in this brain region, the scan data were subjected to a multivariate analysis where SVMs attempted to decode which Mooney image (from all sets) a subject was viewing during any given trial.
Remarkably, restricting our multivariate classification analysis to the primed ROI resulted in a chance performance of the SVMs (Fig. 3). Knocking out the GLM-selected voxels (and using the remainder of the cortex as an ROI), however, resulted in a significant increase in decoding accuracy for both primed and unprimed conditions (McNemar test, P < 0.01 for both conditions). Therefore, the voxels that were classically primed could not be the same set of voxels that carry information about the stimuli. These results indicate that areas revealed as being involved in priming via GLM analysis may not necessarily encode information about the stimuli. They may, instead, reflect nonspecific activations, for example, those related to arousal. This is demonstrably the case for the ROI localized by our GLM analysis. Although this does not imply a lack of information encoding in other previously reported priming-related ROIs, it does suggest that multivoxel pattern analysis in these regions, rather than merely an overall heightening of their activation, would strengthen the case for their involvement in stimulus-specific priming.
Priming Increases Decoding Accuracy Throughout the Visual System.
Our results show overall higher SVM classification accuracy for primed versus unprimed images in multiple regions across the visual system, mirroring our behavioral findings. Fig. 4A shows a map of the regions that exhibit changes in the information of their neural activity patterns, and Fig. 4B shows examples of the actual decoding accuracy of several notable regions. All regions exhibiting significant differences in decoding are reported in Table 1. Consistent with their involvement in object processing, higher-level areas such as the fusiform gyrus and lateral occipital cortex exhibit an experience-dependent increase in information decidability. We find it especially interesting to note that such experience-dependent information increase is also evident in early visual areas such as the anatomically defined pericalcarine cortex and functionally defined areas V2 and V3. The increased decodability fails to reach significance in area V1. No regions exhibited lower decoding accuracy for the primed images.
Fig. 4.
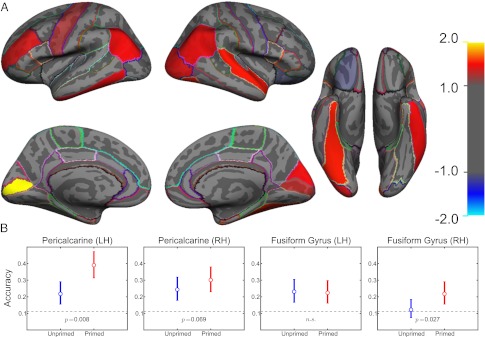
Object priming increases the information found in many regions of the cortex. (A) Using atlas-based anatomical regions of interest for the SVM analysis, several notable regions, including the pericalcarine cortex, inferior parietal cortex, lateral occipital cortex, and fusiform gyrus, show significantly increased decoding accuracy for primed versus unprimed images. No areas showed higher decoding accuracy for unprimed images. The magnitude of the color scale indicates the level of significance in log power (e.g., both +2 and −2 indicate P < 10−2), whereas the sign of the scale indicates whether primed images yielded higher accuracy (positive scale) or vice versa. Colored lines indicate the borders of anatomically based ROIs. (B) Example of the results of the decoding accuracy in a few notable cortical regions. Pericalcarine regions showed relatively high decoding accuracy and were significantly higher in the primed condition. Classification accuracy was lower overall in the fusiform gyrus, but significantly elevated in the primed condition in the right hemisphere only. Dashed lines indicate chance performance levels over the entire group of subjects.
Table 1.
Significance of increased SVM decodability in various cortical regions
| Cortical region | Left hemisphere | Right hemisphere |
| Anatomically defined | ||
| Cuneus | NS | P = 0.046 |
| Fusiform gyrus | NS | P = 0.027 |
| Inferior parietal | P = 0.034 | P = 0.047 |
| Inferior temporal | P = 0.043 | NS |
| Lateral occipital | NS | P = 0.051 |
| Pericalcarine | P = 0.008 | P = 0.069 |
| Precentral gyrus | P = 0.074 | NS |
| Rostral middle frontal | P = 0.054 | NS |
| Superior temporal gyrus | NS | P = 0.029 |
| Functionally defined | ||
| V1 | NS | NS |
| V2 | NS | P = 0.062 |
| V3 | P = 0.068 | P = 0.066 |
| V4v | NS | NS |
Results from a one-tailed McNemar test are presented as P values for both left and right hemispheres for every cortical region exhibiting a significant, or borderline significant, increase in information. NS, not significant.
Simple Stimuli Do Not Elicit the Same Results as Complex Ones.
Because each region of the brain encodes stimuli with different levels of complexity, we investigated whether the complexity of the stimuli carrying prior information would affect the regions of the brain that show an increase in information. To this end, we conducted a similar experiment where subjects were shown degraded simple stimuli containing a field of oriented line segments (Fig. S1) instead of complex Mooney images.
We found no evidence of an increase in recognition for these simple stimuli (Fig. S1). Correspondingly, no increase in SVM decoding ability in any ROI tested was seen in this experiment. In addition, no GLM-based effects were found, indicating increased activation in the primed condition.
Discussion
The increased decoding accuracy of primed versus unprimed images suggests that there is an increase in image-specific information in regions of the brain exhibiting this form of priming. In general, the regions in which we find an increased decoding ability occur across multiple levels of the ventral visual stream. This includes higher-level areas such as the fusiform gyrus and lateral occipital cortex and lower levels including the anatomically defined pericalcarine cortex and, in particular, the functionally defined V2 and V3. A recent study (19) has also reported an increase in information in the foveal confluence and object-selective cortex [area lateral occipital complex (LOC)]. As the pericalcarine cortex generally corresponds well to the primary visual cortex, it is somewhat surprising that significant effects were found using the anatomical ROI but not in functionally defined V1. This is most likely due to the imperfect mapping of the atlas-induced boundaries to those of the true primary visual cortex, and it is entirely possible that the effects in the pericalcarine cortex, as defined in these subjects, were driven by patterns of activity that had their true origins in V2.
More critically, we show that these effects are distinct from traditional priming, as we were unable to find any evidence of information encoding in the GLM-selected regions. In addition, we show that prior information is carried over complex, and not simple, image features.
It is important to note the differences between the results reported here and those obtained in the GLM analysis. Prior studies have shown how the overall activity in regions of the cortex in response to Mooney images is modulated before and after exposure to the unambiguous versions (5, 6), and our localization in the GLM analysis generally agrees with their results. However, this overall modulation of activity must be interpreted separately from the SVM analysis results. For example, consider the answer to the question, “Which regions of the brain are involved in priming?” To answer this, a GLM analysis is appropriate because it contrasts the overall activity in the brain in response to the Mooney images before and after priming with the coherent images. The result is a subtraction of the average activity, over all images, in one condition versus the other. In contrast, our experiment asks the question, “Which regions of the brain encode more image-specific information for primed and unprimed images?” The SVM analysis thus looks at the differential pattern of activity between all images under a single condition. The overall level of activation in no way changes the pattern of differences between any two images. The SVM analysis thus reports on how much information is contained in a region pertaining to the stimuli, and not on the overall activity level.
Therefore, it is best to consider the GLM and SVM methods as answering two distinct questions. The fact that decoding ability falls to chance using only the GLM-selected voxels highlights this distinction. In simple terms, the GLM analysis selects voxels that are highly activated in response to all images as an average; the SVM analysis performs well when voxels respond more to one stimulus than to another. As a result, prior studies showing priming effects via this GLM-type of analysis, in reality, show parts of the brain that do not necessarily encode the stimuli. Rather, they show increased activity in regions more likely involved in attention and arousal rather than increased information encoding of a specific stimulus. Adaptation-based results, where a lower level of activity is presumably the result of fatigued feature-specific neurons in a given area, are an exception to this, but the point remains that pattern information changes represent a qualitatively different result than that obtained by the standard GLM analysis.
It is interesting to note the discrepancy between the simple and complex stimuli. Although we show increased pattern decoding for primed complex objects, we did not find similar results for simple stimuli—either in subjects’ behavioral responses, via pattern decoding, or via GLM. It is unlikely that no priming occurs for simple stimuli, as even V1 is modulated (albeit weakly) by attention (20, 21), but it does appear that prior information, in this context at least, does not help the brain to decode the orientation of line segments. This raises the question of whether this lack of priming is true only for the most basic of visual features, or if progressively more complex stimuli show a graded amount of information increase with prior knowledge. On a similar note, it may be the case that wholly different types of stimuli might enhance information in different regions entirely—for example, prior information about motion stimuli may increase the amount of information in the dorsal visual stream, rather than in the ventral areas shown in this study.
These results also suggest that information priming is more than simply feature-based attention. It is known that attending to specific features of an image sharpens or increases the cortical response to those features (22–27). In this interpretation, the increase in information could be due to increased attention to visual features that compose the true object hidden in the degraded image and decreased attention to the “noise” features. Several factors, however, distinguish our results from classical feature-based attention experiments. First, attention was never explicitly directed to any image features: any specific feature-based attention was entirely endogenous as a result of increased prior knowledge about the stimuli. Second, the experiment that we conducted with simple stimuli was more similar to a classical feature-based attention experiment, as the subjects were cued with oriented stimuli before each scan. Our inability to detect a greater amount of information in this case stands in contrast to the results that the visual cortex, even on the single-unit level in V4, exhibits sharpened responses to oriented stimuli when cued (23, 25, 26). Our results indicate that information priming is object-based, whereas feature-based attention is known to work on lower levels. Finally, feature-based attention calls for an increased response in many neurons through multiplicative gain mechanisms (28) when comparing attended vs. nonattended stimuli. The fact that the most significantly activated voxels, as selected by our GLM, did not exhibit an increase in information suggests that there is more than a simple multiplicative mechanism at work. Therefore, feature-based attention cannot fully explain our results and differentiates this study from other Mooney-based experiments (5, 6).
It is interesting to speculate whether this information-based priming simply amplifies response patterns across the cortex or if there is a substantial alteration of the neural code. Training the classifiers on the primed data and testing them on the unprimed data (rather than cross-validating within each condition) results in above-chance classification rates throughout the visual cortex, indicating that there is significant conservation of the pattern between both conditions. However, our data cannot rule out the possibility of a true alteration of the neural code where the patterns differ; indeed, we would expect that both mechanisms—amplification and alteration—would occur. That is, we hypothesize that patterns in the neural code representing the stimulus are likely amplified, but additionally the brain might alter the neural code in areas representing missing information (e.g., using top-down information not found in the actual stimulus).
We have shown that an increase in knowledge about a stimulus translates into an increase in pattern information across several regions in the visual cortex. Although the time course of the fMRI signal does not allow us to conclude that these are feedback phenomena, the fact that this increase is dependent on behavioral priming with complex images suggests that this may indeed be a case for top-down facilitation of processing in the visual system.
Methods
Participants.
Nine right-handed volunteers between the ages of 22 and 35 y were recruited from the Massachusetts Institute of Technology community to participate in the fMRI experiment. All participants gave informed written consent. The study was approved by the Massachusetts Institute of Technology Institutional Review Board. Four of these volunteers were excluded from analysis on the basis of technical difficulties with the data or a failure to perform the behavioral task adequately, leaving five subjects included in the main analysis. Two of these subjects, plus two additional subjects, participated in the simple experiment.
Visual Stimuli.
Stimuli were photographs of isolated real world objects. To minimize the low-level differences between images, the magnitudes of all Fourier components were averaged across the entire image set, and the images were reconstructed via inverse Fourier transform on the basis of their original phase and the averaged magnitude of each particular frequency. To additionally degrade the images, phase noise was introduced, partially “scrambling” the images via shifting the phase angles randomly (29). These degraded images were then converted to Mooney-like images by thresholding at the per-image median gray-level intensity. The amount of noise added during the scrambling step was titrated so that the final Mooney image was not recognizable without seeing the fully coherent version.
For the simple experiment, noisy oriented stimuli were generated by overlaying hundreds of oriented line segments of random luminance on top of a gray background. The size and width of each segment was scaled exponentially to approximate the foveal magnification factor in the cortex, so that segments near fixation were the smallest. To degrade the stimuli, each oriented segment was rotated proportionately from the true stimulus orientation to a random orientation.
fMRI Experiment.
Scanning was performed on a 3.0-Tesla Siemens scanner using a standard head coil in the Martinos Imaging Center at the Massachusetts Institute of Technology. A high-resolution T1-weighted 3D-MPRAGE anatomical scan was acquired for each participant (field of view 256 × 256, 1-mm3 resolution). To measure BOLD contrast, 33 slices parallel to the anterior commissure/posterior commissure line were acquired using standard T2*-weighted gradient-echo echoplanar imaging (repetition time 2,000 ms, echo delay time 30 ms, flip angle 90°, slice thickness 3 mm, in-plane resolution 3 × 3 mm).
Scan runs began and ended with 16 s of fixation rest and included eight image presentation trials. Each trial consisted of 16 s of visual stimulation, where a given image was flickered on and off at 6 Hz to reduce habituation. Trials were followed by 2 s of rest and subsequently a 4-s response window, where the subject was required to perform a 2-AFC task regarding the content of the image seen in the previous set by pressing a button. Another 10 s of rest followed the response phase before the next trial began. Participants were additionally instructed to report via a button press the occurrence of a low-contrast flicker in the fixation cue as a means of monitoring fixation and alertness. This fixation cue was present during the image presentations and rest, but not during the response phases.
Each scan run consisted of two arbitrarily paired sets of images. Each set contained one image of an “artificial” object, such as a shoe, and one image of a “natural” object, such as a butterfly. Before the run began, one image set was designated as primed, and the undegraded versions of those images were shown to the subject. Each image was presented twice per run, for a total of eight image presentations (2 sets × 2 images × 2 trials) in pseudorandom order. During each response phase, the subject was required to press a button indicating whether they recognized the previously viewed image as either natural or artificial. The same image sets were repeated for a total of three runs. The nonprimed image set was then designated as primed, and a new image set was introduced for the next three runs. Sessions continued in this manner and typically included three to six total image sets (meaning classification was between 6 and 12 total images, depending on the subject) for a maximum session duration of 2 h. Therefore, every image was presented to the subject a total of 12 times—6 times before they saw the coherent version, followed by 6 times after priming. The very first primed images and the last unprimed images, which were not shown in both conditions, were excluded from analysis.
For the simple experiment, conducted in separate scan sessions, each scan run contained repeated presentations of two degraded orientation stimuli of four total (horizontal, vertical, and two diagonals). During each rest period, subjects were asked to indicate which of all four orientations they saw in the previous set, thereby performing a 4-AFC task. The same two stimuli were repeated for two additional runs before the subjects were shown the coherently oriented stimuli. This was followed by three runs with the same stimuli after exposure to the coherent stimuli. After six total runs, two new orientations were chosen, and the process was repeated for a maximum duration of 2 h.
Analysis.
Cortical reconstruction and volumetric segmentation was performed with the Freesurfer image analysis suite (30, 31). Functional scans were motion corrected in AFNI (32) and coregistered to individual subjects’ anatomical scans using a combination of manual alignment, custom scripts, and SPM8. No spatial or temporal smoothing was applied. The aligned functional images were then processed in a GLM with a double-gamma hemodynamic response function in FMRI Expert Analysis Tool, version 5.98, part of FMRIB's Software Library (33). Time-series analysis was carried out using FILM with local autocorrelation correction (34) and regression against motion-correction parameters. Eight β-images were output from the GLM per run. The resulting β-images were converted to z-scored images and finally extracted per region of interest for multivariate pattern analysis as described below.
Regions of interest were defined by automatic surface parcellation (35–37) in Freesurfer and by retinotopic field sign boundaries for V1–V4 determined from separate scan sessions according to previously described methods (38, 39). Voxels within the anatomically defined pericalcarine ROI were additionally masked to those that were visually responsive, determined by contrasting the average response to all stimuli compared with rest in a GLM, and thresholded to P < 0.01 and a clustering method of P < 0.05 to correct for multiple comparisons. In addition, a primed region of interest was determined using a GLM for the contrast “Primed > Unprimed” with P < 0.01 and a clustering method of P < 0.05 to correct for multiple comparisons.
Multivariate Pattern Analysis.
Multivariate pattern analysis was performed using custom Python routines based on the PyMVPA package (40, 41) with the Shogun 0.9 backend (42). Briefly, linear support vector machines (9) were trained and used to predict which image, from all a given subject had seen, was presented during a given set, using 1-vs.-Rest multiclass classifiers. As there were between 6 and 12 different images depending on the subject, chance classification rates were between 17 and 8%. Data were trained and classified independently using leave-one-run-out cross validation. Statistics were calculated by comparing paired classifications of each image before and after priming in a one-tailed McNemar test, summed over all image pairs per subject; a final group McNemar statistic was formed using a correction for nonindependent clusters across subjects (43).
Results for any region of interest were excluded if neither the primed nor unprimed images had decoding accuracy significantly higher than chance.
Supplementary Material
Acknowledgments
We thank the John Merck Foundation, the James McDonnell Foundation, and the Jim and Marilyn Simons Foundation. This work was supported by National Institutes of Health Grant EY07023 (to M.S.) and Grant NEI R21EY015521-01 (to P.S.).
Footnotes
The authors declare no conflict of interest.
This article is a PNAS Direct Submission.
This article contains supporting information online at www.pnas.org/lookup/suppl/doi:10.1073/pnas.1111224109/-/DCSupplemental.
References
- 1.Gregory RL. The Intelligent Eye. New York: McGraw-Hill; 1970. [Google Scholar]
- 2.Mooney CM. Age in the development of closure ability in children. Can J Psychol. 1957;11:219–226. doi: 10.1037/h0083717. [DOI] [PubMed] [Google Scholar]
- 3.Kashino M. Phonemic restoration: The brain creates missing speech sounds. Acoust Sci Technol. 2006;27:318–321. [Google Scholar]
- 4.Bülthoff I, Bülthoff H, Sinha P. Top-down influences on stereoscopic depth-perception. Nat Neurosci. 1998;1:254–257. doi: 10.1038/699. [DOI] [PubMed] [Google Scholar]
- 5.Dolan RJ, et al. How the brain learns to see objects and faces in an impoverished context. Nature. 1997;389:596–599. doi: 10.1038/39309. [DOI] [PubMed] [Google Scholar]
- 6.James TW, Humphrey GK, Gati JS, Menon RS, Goodale MA. The effects of visual object priming on brain activation before and after recognition. Curr Biol. 2000;10:1017–1024. doi: 10.1016/s0960-9822(00)00655-2. [DOI] [PubMed] [Google Scholar]
- 7.Bentin S, Golland Y. Meaningful processing of meaningless stimuli: The influence of perceptual experience on early visual processing of faces. Cognition. 2002;86(1):B1–B14. doi: 10.1016/s0010-0277(02)00124-5. [DOI] [PubMed] [Google Scholar]
- 8.Bentin S, Sagiv N, Mecklinger A, Friederici A, von Cramon YD. Priming visual face-processing mechanisms: Electrophysiological evidence. Psychol Sci. 2002;13(2):190–193. doi: 10.1111/1467-9280.00435. [DOI] [PubMed] [Google Scholar]
- 9.Vapnik VN. Statistical Learning Theory. New York: Wiley Interscience; 1998. [Google Scholar]
- 10.Carlson T, Grol MJ, Verstraten FAJ. Dynamics of visual recognition revealed by fMRI. Neuroimage. 2006;32:892–905. doi: 10.1016/j.neuroimage.2006.03.059. [DOI] [PubMed] [Google Scholar]
- 11.Haxby JV, et al. Distributed and overlapping representations of faces and objects in ventral temporal cortex. Science. 2001;293:2425–2430. doi: 10.1126/science.1063736. [DOI] [PubMed] [Google Scholar]
- 12.Cox DD, Savoy RL. Functional magnetic resonance imaging (fMRI) “brain reading”: Detecting and classifying distributed patterns of fMRI activity in human visual cortex. Neuroimage. 2003;19:261–270. doi: 10.1016/s1053-8119(03)00049-1. [DOI] [PubMed] [Google Scholar]
- 13.Haynes J-D, Rees G. Predicting the orientation of invisible stimuli from activity in human primary visual cortex. Nat Neurosci. 2005;8:686–691. doi: 10.1038/nn1445. [DOI] [PubMed] [Google Scholar]
- 14.Kamitani Y, Tong F. Decoding the visual and subjective contents of the human brain. Nat Neurosci. 2005;8:679–685. doi: 10.1038/nn1444. [DOI] [PMC free article] [PubMed] [Google Scholar]
- 15.Boynton GM. Imaging orientation selectivity: Decoding conscious perception in V1. Nat Neurosci. 2005;8:541–542. doi: 10.1038/nn0505-541. [DOI] [PubMed] [Google Scholar]
- 16.de Op, Beeck HP. Against hyperacuity in brain reading: Spatial smoothing does not hurt multivariate fMRI analyses? Neuroimage. 2009;49:1943–1948. doi: 10.1016/j.neuroimage.2009.02.047. [DOI] [PubMed] [Google Scholar]
- 17.Kamitani Y, Sawahata Y. Spatial smoothing hurts localization but not information: Pitfalls for brain mappers. Neuroimage. 2009;49:1949–1952. doi: 10.1016/j.neuroimage.2009.06.040. [DOI] [PubMed] [Google Scholar]
- 18.Swisher JD, et al. Multiscale pattern analysis of orientation-selective activity in the primary visual cortex. J Neurosci. 2010;30:325–330. doi: 10.1523/JNEUROSCI.4811-09.2010. [DOI] [PMC free article] [PubMed] [Google Scholar]
- 19.Hsieh P-J, Vul E, Kanwisher N. Recognition alters the spatial pattern of FMRI activation in early retinotopic cortex. J Neurophysiol. 2010;103:1501–1507. doi: 10.1152/jn.00812.2009. [DOI] [PMC free article] [PubMed] [Google Scholar]
- 20.Kastner S, De Weerd P, Desimone R, Ungerleider LG. Mechanisms of directed attention in the human extrastriate cortex as revealed by functional MRI. Science. 1998;282(5386):108–111. doi: 10.1126/science.282.5386.108. [DOI] [PubMed] [Google Scholar]
- 21.Pinsk MA, Doniger GM, Kastner S. Push-pull mechanism of selective attention in human extrastriate cortex. J Neurophysiol. 2004;92:622–629. doi: 10.1152/jn.00974.2003. [DOI] [PubMed] [Google Scholar]
- 22.Reynolds JH, Chelazzi L, Desimone R. Competitive mechanisms subserve attention in macaque areas V2 and V4. J Neurosci. 1999;19:1736–1753. doi: 10.1523/JNEUROSCI.19-05-01736.1999. [DOI] [PMC free article] [PubMed] [Google Scholar]
- 23.Haenny PE, Maunsell JH, Schiller PH. State dependent activity in monkey visual cortex. II. Retinal and extraretinal factors in V4. Exp Brain Res. 1988;69:245–259. doi: 10.1007/BF00247570. [DOI] [PubMed] [Google Scholar]
- 24.McAdams CJ, Maunsell JH. Attention to both space and feature modulates neuronal responses in macaque area V4. J Neurophysiol. 2000;83:1751–1755. doi: 10.1152/jn.2000.83.3.1751. [DOI] [PubMed] [Google Scholar]
- 25.Motter BC. Neural correlates of feature selective memory and pop-out in extrastriate area V4. J Neurosci. 1994;14:2190–2199. doi: 10.1523/JNEUROSCI.14-04-02190.1994. [DOI] [PMC free article] [PubMed] [Google Scholar]
- 26.Motter BC. Neural correlates of attentive selection for color or luminance in extrastriate area V4. J Neurosci. 1994;14:2178–2189. doi: 10.1523/JNEUROSCI.14-04-02178.1994. [DOI] [PMC free article] [PubMed] [Google Scholar]
- 27.Saenz M, Buracas GT, Boynton GM. Global effects of feature-based attention in human visual cortex. Nat Neurosci. 2002;5:631–632. doi: 10.1038/nn876. [DOI] [PubMed] [Google Scholar]
- 28.Martinez-Trujillo JC, Treue S. Feature-based attention increases the selectivity of population responses in primate visual cortex. Curr Biol. 2004;14:744–751. doi: 10.1016/j.cub.2004.04.028. [DOI] [PubMed] [Google Scholar]
- 29.Dakin SC, Hess RF, Ledgeway T, Achtman RL. What causes non-monotonic tuning of fMRI response to noisy images? Curr Biol. 2002;12:R476–R47. doi: 10.1016/s0960-9822(02)00960-0. author reply R478. [DOI] [PubMed] [Google Scholar]
- 30.LaConte S, Strother S, Cherkassky V, Anderson J, Hu X. Support vector machines for temporal classification of block design fMRI data. Neuroimage. 2005;26:317–329. doi: 10.1016/j.neuroimage.2005.01.048. [DOI] [PubMed] [Google Scholar]
- 31.Dale AM, Fischl B, Sereno MI. Cortical surface-based analysis. I. Segmentation and surface reconstruction. Neuroimage. 1999;9(2):179–194. doi: 10.1006/nimg.1998.0395. [DOI] [PubMed] [Google Scholar]
- 32.Cox RW. AFNI: software for analysis and visualization of functional magnetic resonance neuroimages. Comput Biomed Res. 1996;29(3):162–173. doi: 10.1006/cbmr.1996.0014. [DOI] [PubMed] [Google Scholar]
- 33.Beckmann CF, Jenkinson M, Smith SM. General multilevel linear modeling for group analysis in FMRI. Neuroimage. 2003;20:1052–1063. doi: 10.1016/S1053-8119(03)00435-X. [DOI] [PubMed] [Google Scholar]
- 34.Woolrich MW, Ripley BD, Brady M, Smith SM. Temporal autocorrelation in univariate linear modeling of FMRI data. Neuroimage. 2001;14:1370–1386. doi: 10.1006/nimg.2001.0931. [DOI] [PubMed] [Google Scholar]
- 35.Desikan RS, et al. An automated labeling system for subdividing the human cerebral cortex on MRI scans into gyral based regions of interest. Neuroimage. 2006;31:968–980. doi: 10.1016/j.neuroimage.2006.01.021. [DOI] [PubMed] [Google Scholar]
- 36.Fischl B, Sereno MI, Tootell RB, Dale AM. High-resolution intersubject averaging and a coordinate system for the cortical surface. Hum Brain Mapp. 1999;8:272–284. doi: 10.1002/(SICI)1097-0193(1999)8:4<272::AID-HBM10>3.0.CO;2-4. [DOI] [PMC free article] [PubMed] [Google Scholar]
- 37.Fischl B, et al. Automatically parcellating the human cerebral cortex. Cereb Cortex. 2004;14(1):11–22. doi: 10.1093/cercor/bhg087. [DOI] [PubMed] [Google Scholar]
- 38.Dougherty RF, et al. Visual field representations and locations of visual areas V1/2/3 in human visual cortex. J Vis. 2003;3:586–598. doi: 10.1167/3.10.1. [DOI] [PubMed] [Google Scholar]
- 39.Sereno MI, et al. Borders of multiple visual areas in humans revealed by functional magnetic resonance imaging. Science. 1995;268:889–893. doi: 10.1126/science.7754376. [DOI] [PubMed] [Google Scholar]
- 40.Hanke M, et al. PyMVPA: A python toolbox for multivariate pattern analysis of fMRI data. Neuroinformatics. 2009;7(1):37–53. doi: 10.1007/s12021-008-9041-y. [DOI] [PMC free article] [PubMed] [Google Scholar]
- 41.Hanke M, et al. PyMVPA: A unifying approach to the analysis of neuroscientific data. Front Neuroinform. 2009;3:3. doi: 10.3389/neuro.11.003.2009. [DOI] [PMC free article] [PubMed] [Google Scholar]
- 42.Sonnenburg S, Bernhard BS, Bennett P, Parrado-Hernández E. Large scale multiple kernel learning. J Mach Learn Res. 2006;7:1531–1565. [Google Scholar]
- 43.Durkalski VL, Palesch YY, Lipsitz SR, Rust PF. Analysis of clustered matched-pair data for a non-inferiority study design. Stat Med. 2003;22:279–290. doi: 10.1002/sim.1385. [DOI] [PubMed] [Google Scholar]
Associated Data
This section collects any data citations, data availability statements, or supplementary materials included in this article.