

Abstract
The unique topology of tail-anchored (TA) proteins precludes them from utilizing the well-studied cotranslational translocation mechanism of most transmembrane proteins, forcing them into a distinct, posttranslational pathway. In yeast, this process is the guided entry of TA-proteins (GET) pathway, which utilizes a combination of cytosolic and transmembrane proteins to identify a TA protein, transfer it, and insert it into the endoplasmic reticulum membrane. At the center of this mechanism is the Get3 homodimer, which transfers a TA protein between the two GET phases by leveraging energy gained in ATP binding and hydrolysis to undergo significant structural changes from “open” to “closed” conformations. We present all-atom molecular dynamics simulations of Get3 in multiple nucleotide states, and through rigorous potential of mean force calculations, compute the free energy landscape of the Get3 opening/closing pathway. Results agree well with experiments on the nucleotide bias of Get3 open and closed structures in the crystallographically observed no-nucleotide, two ATP, and two ADP states, and also reveal their populations in the asymmetric one ATP and one ADP cases. Structures also compare well with the recently observed “semiopen” conformation and suggest that Get3 may sample this state free in solution and not just when bound to Get1, as observed in experiments. Finally, we present evidence for a unique, “wide-open” conformation of Get3. These calculations describe the nucleotide-dependent thermodynamics of Get3 in solution, and improve our understanding of its mechanism in each phase of the GET cycle.
Keywords: enhanced sampling, adaptive biasing force,
The targeting of transmembrane proteins to the endoplasmic reticulum (ER) is a fundamental process in cellular biology, that is particularly important given the abundance of transmembrane proteins encoded in the genome (1). A majority of these proteins are delivered to the ER membrane through a highly conserved mechanism that involves binding of the signal recognition particle (SRP) to the signal sequence in the target protein as it is being transcribed and emerging from the ribosome (2, 3). However, approximately 5% of transmembrane proteins, including soluble N-ethylmaleimide-sensitive factor attachment protein receptors, apoptosis-related proteins, localization proteins, and metabolic cofactors, belong to the class of tail-anchored (TA) proteins, which have only a single transmembrane domain (TMD) located near the C terminus (4–6). These proteins are incapable of utilizing the standard cotranslational translocation pathway because their TMD (which contains their targeting information) is transcribed last and is therefore shielded from interaction with the SRP during translation (7).
In yeast, the guided entry of TA-proteins (GET) pathway utilizes six proteins, Get1–Get5 and Sgt2, to posttranslationally target TA-proteins to the ER membrane (8–11) (see Fig. 1). During the membrane targeting phase of the GET cycle, a TA protein is transferred from a cytosolic complex composed of two Get4, two Get5, and one Sgt2 molecule, to a Get3 dimer (12–15). In the second GET phase, the membrane insertion stage, Get3 associates with the transmembrane Get1/Get2 complex, which facilitates dissociation of the TA protein from Get3, followed by insertion of the TMD into the ER membrane (15–18). Although this mechanism has been primarily studied in yeast, mammalian homologues for each of the GET proteins have been discovered, suggesting that GET represents a TA targeting mechanism that is conserved across species (17, 19). The importance of this pathway is highlighted by the fact that regulation of the human Get3 analog Asna-1 has been shown to play a role in breast, skin, and ovarian cancers, most likely through the modulation of tumor cell phenotypes (20–22).
Fig. 1.

The GET pathway includes two major phases: the membrane targeting stage in which a TMD is transferred from the Get4/Get5/Sgt2 complex to Get3, and the membrane insertion stage in which the TMD is inserted into the ER membrane through interactions with the Get1/Get2 complex.
The central role Get3 plays in linking both phases of the GET pathway has made it a subject of numerous experiments. In Saccharomyces cerevisiae, each Get3 monomer consists of 355 residues that are divided into two regions, the nucleotide binding domain (NBD), containing a seven-stranded β-sheet and six α-helices, and the helical domain, composed of an additional six α-helices (23). When isolated from other proteins, crystallographic studies have resolved the Get3 homodimer into two major conformations based upon the state of its bound nucleotides (23–27). In the nucleotide-free (apo) state, the flexible protein adopts an open conformation in which the helical domains of each monomer are fully separated from one another. Binding of nucleotides induces a conformational rearrangement in which an additional approximately 1,500 Å2 of protein surface area is buried as the helical domains associate with one another in a closed state. This structure is further tightened into a “fully closed” conformation when crystallized with the transition-state analogue ADP-AlF4. One prominent feature of the closed state is the formation of a central hydrophobic groove that extends through the helical domains of both dimers, which biochemical analysis has pinpointed as the likely location of TMD binding (23). Recent structural experiments of Get3 bound to the cytosolic domains of Get1 have also shown Get3 in a semiopen state in which the helical domains are slightly separated from one another and the NBD adopts a conformation intermediate to the closed and open states (18).
Despite extensive experimental work, there remain several key questions about the structure and function of Get3: What is the influence of nucleotide binding on Get3 conformations in solution? Does the binding of a single nucleotide bias Get3 into structures different than those observed when two nucleotides bind? How does Get3 transition between these conformations? Are there other, unobserved, structures of Get3? Here, we address these questions by reporting on a series of all-atom molecular dynamics (MD) simulations of the Get3 dimer in multiple nucleotide states. Conventional and accelerated MD simulations were used to map the two-dimensional conformational landscape that corresponds to the opening/closing transition pathway, upon which rigorous free energy calculations were performed. Results from five nucleotide states agree well with experiments on symmetric nucleotide binding, predict roles for the semiopen state, describe a wide-open conformation, and shed insight into the coupling of nucleotide binding to the function of Get3.
Results
Conventional and Accelerated Molecular Dynamics Simulations.
Conventional MD (cMD) simulations of 100 ns were performed on six systems: the no-nucleotide (apo), two ATP, and two ADP nucleotide states in both the open and closed conformations. The heavy-atom rmsd of simulations initialized in the closed conformation quickly stabilized to values below 4 Å in approximately 10 ns, whereas dimers in the open conformation exhibited higher rmsd values, on the order of 6 Å (Fig. S1). Fluctuations of individual Cα atoms were also higher in the open states, primarily in the helical domains (Fig. S2).
To determine the dominant, low-frequency motions inherent to Get3, a full-correlation analysis (FCA) was performed on trajectories from all six cMD simulations (28). FCA analysis, which relies on the definition of collective degrees of freedom (modes) that minimize the mutual information of the system, has the advantage over the more traditional principal component analysis in that it includes nonlinear and multicoordinate correlations in the analysis (as opposed to only two-body linear correlations), resulting in modes that optimally describe the low-frequency, collective, anharmonic motions of biomolecules. Residues contributing the most to the first FCA mode are located at the interface of the NBD and helical domains, and on the periphery of the dimer; motions along the first FCA mode primarily describe the opening/closing pathway (Fig. 2A and Movie S1). FCA mode 4 is also of interest as it has the highest mutual-information (0.67) with mode 1 of any FCA dimension, suggesting that motions along these two modes are correlated with one another. Residues which contribute the most to FCA mode 4 are located primarily near the top of the helical domains, where there are intermonomer interactions in the closed state (Fig. 2B and Movie S2). Projections on the subspace defined by FCA modes 1 and 4 show that cMD simulations initiated in the closed state sampled less subspace than those begun in the open conformation, in accord with their lower rmsd values (Fig. 3). The no-nucleotide state diverged the least of the open simulations, sampling states relatively local to its initial conformation, whereas the two ATP and two ADP simulations opened further, with projections along FCA modes 1 and 4 increasing from their initial values.
Fig. 2.

The two primary dimensions upon which results are projected, FCA modes 1 (A) and 4 (B). FCA mode 1 is primarily responsible for opening of the nucleotide binding domains, and mode 4 describes the helical domain separation. Projections go from negative values in blue to positive ones in red.
Fig. 3.

Projection of conventional (cMD) and accelerated (aMD) simulations on the FCA mode 1/4 subspace (shown in Fig 2). Simulations initiated in the open and full-closed conformations are shown in red and blue respectively.
Despite long simulation times, the amount of phase space covered in the cMD simulations was relatively low and lacked sampling of regions between the open and closed states. To enhance sampling of the open-closed transition, three 100 ns accelerated MD (aMD) simulations were performed on each construct (29, 30). Unlike many complementary methods of enhanced sampling, aMD can effectively explore long timescale motions and large regions of phase space without the definition of a reaction coordinate, thus making it a natural choice for the initial examination of Get3 motions. Simulations begun in the closed state remained closed, although they did sample significantly more of the closed region than the corresponding cMD simulations (Fig. 3). Each of the apo/open simulations transitioned to a closed-like structure, two in the first 20 ns and one after 60 ns. In contrast, none of the nucleotide containing aMD simulations closed, and instead each of them opened further with increased projection values along both FCA modes 1 and 4 (Fig. 3).
Free Energy Calculations.
To elucidate the thermodynamic basis for the opening/closing equilibrium observed both in experiments and in aMD simulations, free energy profiles were computed using two-dimensional adaptive biasing force (ABF) calculations along FCA modes 1 and 4 (31, 32). The potentials of mean force (PMF) were calculated for five nucleotide states: apo, one or two bound ATP, and one or two bound ADP molecules. To enhance sampling, the FCA mode 1/4 landscape that was sampled throughout the aMD simulations was divided into a series of “windows,” the number and sampling within which were adapted to balance convergence and computational expense (for detail see Materials and Methods and Table 1). In addition, to reduce the required equilibration time, each window was initiated from a low-energy structure generated in the aMD simulations near the center of the desired sampling region. Based upon inspection of the results, the mode 1/4 space was divided into five states, I–V (Fig. 4A), the Boltzmann averaged free energies of which are shown in Table 2. A comparison of the efficiency and precision of cMD, aMD, and ABF calculations is presented in the SI Text (along with Figs. S3 and S4) for the interested reader.
Table 1.
The number of windows and cumulative sampling time for each free energy profile
| State | No. windows | Total simulation time, ns |
| Apo | 47 | 1,535 |
| One ATP | 56 | 1,855 |
| Two ATP | 53 | 1,775 |
| Two ADP | 58 | 1,970 |
| One ADP | 60 | 2,170 |
Fig. 4.
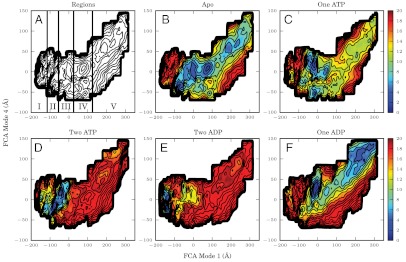
Free energy profiles for Get3 in five nucleotide states (in kcal/mol). In the no-nucleotide (apo) state (B), there are multiple minima throughout the energy landscape, whereas addition of one ATP (C), two ATP (D), two ADP (E), or one ADP (F) molecule(s) restricts the accessible regions of phase space. The consistent locations of energy minima in each of the states resulted in the subdivision of the FCA mode 1/4 landscape into five regions, based upon their degree of opening (A).
Table 2.
Free energies of FCA mode 1/4 space regions in each of the nucleotide states (kcal/mol)
| I | II | III | IV | V | |
| APO | 11.82 ± 1.34 | 0.52 ± 0.93 | 1.17 ± 0.70 | 0.00 ± 0.57 | 2.15 ± 1.10 |
| One ATP | 10.28 ± 0.96 | 6.05 ± 0.70 | 0.00 ± 0.00 | 3.86 ± 0.68 | 7.08 ± 1.27 |
| Two ATP | 5.64 ± 0.74 | 0.00 ± 0.42 | 0.39 ± 0.66 | 15.05 ± 0.95 | 12.67 ± 1.65 |
| Two ADP | 0.00 ± 0.00 | 9.00 ± 0.68 | 8.42 ± 0.85 | 13.11 ± 1.07 | 13.54 ± 1.59 |
| One ADP | 12.07 ± 1.15 | 3.89 ± 0.44 | 0.00 ± 0.04 | 6.58 ± 0.67 | 1.86 ± 1.14 |
Bold font indicates the global energy minima.
The apo state PMF has multiple local minima along the opening/closing pathway (Fig. 4B). The free energies of wells in regions II and IV are (within error) indistinguishable from one another and may both be global minima, whereas states III and V have free energies that are higher but still accessible by molecules free in solution (1.17 ± 0.70 and 2.15 ± 1.10 kcal/mol, respectively). Barriers between the wells are low, with a maximum on the order of 8 kcal/mol. Conformations in region I have free energies above 11 kcal/mol, thus they are unlikely to be significantly observed in equilibrium conditions.
Addition of nucleotides biases Get3 to sample smaller regions of phase space. Binding of a single ATP molecule lowers the free energy of region III such that it becomes the global minimum, whereas regions I, II, and V become largely inaccessible, and region IV likely has a low population in equilibrium (Fig. 4C). The equilibrium population is further shifted to closed states through the binding of a second ATP molecule, as free energy wells in regions II and III come close to merging with one another to form the global minimum, and the free energy of states in region I drops to 5.64 ± 0.74 kcal/mol (Fig. 4D). Hydrolysis of both nucleotides further biases the population to closed states, with only region I exhibiting a free energy below 8.42 ± 0.85 kcal/mol (Fig. 4E). Release of one ADP molecule induces an opening effect on the dimer: Region III again becomes dominant whereas region V is accessible with a low free energy of 1.86 ± 1.14 kcal/mol (Fig. 4F). In addition, the location of minima along FCA mode 4 is increased in the one ADP case relative to the other states discussed here.
Three metrics were used for comparison of structures in these energy wells to those observed in crystallographic experiments (for selected data, see Table 3; for full data, see Table S1). In the first, the center of mass separation distance between the alpha carbon (Cα) atoms in the beta sheets of each monomer was computed. In the second the center of mass separation distance between the Cα atoms in the α-helices comprising the helical domain, which were resolved in each of the crystal structures, was computed. These two measurements aim to characterize the average intermonomer domain arrangements of the NBD and helical domains. In the third metric, the rmsd of the 302 Cα atoms that were consistently resolved in α-helices or β-sheets in each of the crystal structures was computed relative to crystal structures of the fully closed, closed, semiopen, and open states, with the minimum values presented in Table 3 and Table S1 and full rmsd data, including averages and ranges of values, presented in Table S2. These rmsd measurements are useful in quantifying the overall agreement of structures predicted to be in energy minima by our calculations to those structures that have been experimentally observed. Structures in regions I and II exhibit properties similar to both the fully closed and closed states, typically with good agreement to the fully closed helix-separation and a better correspondence to the closed sheet separation. Conformations in region III have very good agreement with all structural properties of the semiopen state, with rmsd values below 2.5 Å throughout the nucleotide states. Regions IV and V have sheet separations and rmsd values similar to the open states, although the helix distance in region V is much greater than that in the crystal structures and region IV.
Table 3.
Structural properties of representative conformations and their comparisons to crystal structures, shown in parenthesis
| Conformation | Simulation (crystal structure) | Average helix separation, Å | Average sheet separation, Å | Minimum rmsd, Å |
| Fully closed | two ATP (2WOJ) | 29.3 ± 1.53 (28.6) | 30.8 ± 1.66 | 1.30 |
| Closed | two ATP (3IQW) | 27.6 ± 3.05 (28.8) | 32.5 ± 0.78 (32.1) | 3.22 |
| Semiopen | apo (3SJC) | 32.0 ± 2.47 (33.6) | 35.6 ± 1.49 (34.7) | 1.86 |
| Open | apo (3H84) | 42.4 ± 4.52 (43.5) | 39.7 ± 1.60 (40.3) | 3.60 |
| Wide open | one ADP (none) | 55.0 ± 1.76 (none) | 41.5 ± 1.11 (none) | none |
For full results of all energy wells, see Table S1.
Based upon the structural properties in Table 3 and their locations in FCA mode 1/4 space, we have classified regions I–V according to their degree of opening as follows. Region I corresponds to the fully closed state, region II to closed, region III to the semiopen, and region IV to open (see Fig. 5 A–D and Fig. S5 A–D). Conformations in the wells of region V are unique in that they do not correspond to any crystal structures: Although the protein structures in the nucleotide binding domains are similar to the open conformation, the helix-separation distance is significantly greater than that observed in any of the crystal structures. Therefore, region V represents a previously unobserved wide-open conformation (Fig. 5E and Fig. S5E). These classifications are general and are violated in a select few cases (for example region IV of the one ATP simulations corresponds more closely to the semiopen state than the open state, Table S1) and subtle differences exist between the same conformational states with different bound nucleotides, however, they do provide a framework for discussion of states accessible by Get3.
Fig. 5.
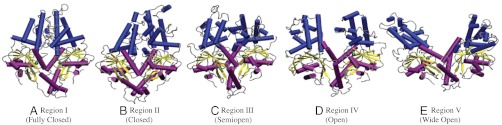
Representative structures and their associated protein states from each of the five PMF regions. For comparisons of these structures to crystal structures, see Fig. S5.
Discussion
Results presented here have led to the model of the nucleotide-dependent mechanism of Get3 opening and closing shown in Fig. 6. Initially, in the apo state, Get3 samples a variety of conformations from wide open to closed. The dimer is predominantly in the open and closed states, however at equilibrium the semiopen and wide-open states are populated as well. The free energy barriers are relatively low, thus we would expect interconversion between states to occur. Association of a single ATP molecule biases the dimer into a semiopen conformation. Binding of a second ATP molecule further pushes the equilibrium such that the majority of protein states are likely to be semiopen or closed. Hydrolysis and phosphate release in both active sites induces closing of the molecule as it adopts the fully closed conformation, which is followed by release of one ADP molecule, significantly shifting the population from fully closed to a combination of semiopen and wide open. Finally, release of the last ADP molecule returns Get3 to its apo state where it may sample states from closed to wide open. The important effect of ATP/ADP binding in modulating protein conformations found here is reminiscent of that seen in several other nucleotide binding proteins (33, 34).
Fig. 6.

Model of Get3 conformational changes throughout the hydrolysis cycle, as reveled through enhanced sampling and free energy calculations. Binding and hydrolysis of nucleotides bias the dimer into distinct conformational states which are likely important for shuttling transmembrane proteins to the ER membrane.
Although this mechanism applies to Get3 dimers free in solution, it has significant implications on our understanding of both phases of the GET cycle. A recent biochemical study showed that transfer of a TA protein to Get3 in the membrane targeting phase is dependent on nucleotide binding, but not hydrolysis (14, 15). Because energy from hydrolysis is not required, the role of nucleotides is likely to bias Get3 into a conformational state that promotes association with Get4/Get5 and not to introduce energy to overcome barriers. There has yet to be an experimentally observed Get3/Get4/Get5 structure, thus it has been difficult to discern the conformation of Get3 responsible for binding and its nucleotide occupancy. However, the recurring presence of the semiopen state as a global minimum in the single ATP/ADP states suggests that Get3 could bind in an asymmetrical nucleotide state. Alternatively, if Get3 binds in the symmetrical two ATP/ADP states, it is expected that the conformation of Get3 would be more closed. The association of Get3 in a semiopen or closed state would be advantageous to TA binding in that it allows for the partial or full preorganization of the TMD binding groove prior to TMD recognition and transfer, thereby reducing the induced fit mechanistic requirement on the helical domains. Utilization of the semiopen state could also be advantageous over the closed one in that it would allow the helical domains to be more flexible in binding around the helical TMD.
In the emerging model of the membrane insertion phase, Get2 tethers a fully closed Get3/TA protein complex to the ER membrane, where cytosolic domains of Get1 insert into the Get3 dimer interface and promote release of the TA protein for membrane insertion. This step is followed by dissociation of Get3 from the Get1/Get2 complex by adopting the closed conformation through ATP binding (17, 18). It has been assumed that Get3 must release both ADP molecules to transition to an open state and release its TA protein, however, results shown here suggest that dissociation of a single ADP molecule may be sufficient as it biases Get3 into the same semiopen state observed in the Get1/Get3 complex. In addition, transient sampling of the wide-open state may also further encourage release of a TA from Get3, as it fully disrupts the TMD binding groove. Through biasing the Get3 free energy landscape to favor semiopen and open conformations, the insertion of Get1 helices into the Get3 dimer interface is also likely responsible for initiating the conformational changes required for ADP release.
By using a combination of conventional molecular dynamics simulations with enhanced sampling and free energy methods, we have reconstructed the free energy landscape of Get3 in five possible hydrolysis states. Simulations were able to reproduce the stabilities and structural elements of the fully closed and open conformations for the symmetric nucleotide states, in accordance with previous crystallographic studies. The good structural agreement with the semiopen conformation is also remarkable given that the structure of this state was published following completion of the calculations presented here. These results have also led to several mechanistic insights into the function of Get3. For example, in solution, the apo state exists in an equilibrium of conformations, the semiopen state appears to be a prominent conformation of free Get3 molecules (and not an artifact of binding to Get1), and a heretofore unseen wide-open conformation also appears likely to contribute to Get3 dynamics. In addition, we have examined the conformational equilibria of the asymmetric single ATP and ADP hydrolysis states. Taking into account the diverse interactions in the GET cycle, the dynamic interconversion between both conformational and nucleotide states is likely to be important not only for the mechanism of Get3, but also in providing a model system for advancing our understanding of biomolecular interactions in general.
Materials and Methods
A full description of the methods may be found in the SI Text. Briefly, models of the fully closed and open Get3 dimer were constructed from structures with Protein Data Bank codes 2WOJ and 3H84 (23, 26), with missing protein segments built from segments resolved in the other structure when available, and modeled with the program PRIME (35). Simulations were performed with the AMBER99SB force field (36), with ADP and ATP parameters from Meagher et al. and zinc ion and zinc-coordinating cysteine parameters from the zinc AMBER force field (37, 38). ADP systems did not include any additional inorganic phosphates. Systems were solvated in an orthorhombic transferable intermolecular potential three point (TIP3P) water box with 150 mM NaCl concentration (39, 40). All simulations were performed with NAMD 2.8 (41, 42), long-range electrostatics were treated with particle-mesh Ewald (43), and temperature was maintained at 300 K through the use of Langevin dynamics (44, 45). Both cMD and aMD simulations were run for a total of 100 ns each, with aMD simulations seeded from snapshots taken at 10, 15, and 20 ns into the cMD simulations. Boosting parameters for aMD simulations were chosen from previous experience (46), and restraints were applied to the protein to maintain the secondary structure in the aMD simulations using the “SSRestraints” plug-in to visual molecular dynamics (VMD) (47). Analysis of simulations was performed with a combination of VMD (48), Gromacs (49), NumPy (50), SciPy (51), and matplotlib (52).
Free energy calculations were performed using the ABF method (31, 32). The dimensions that were projected along in the cMD and aMD simulations, and were biased along in ABF calculations, were generated from an FCA over all Cα atoms, excluding the terminal five residues, of the six cMD simulations (28). The space sampled in aMD calculations was divided into a series of 42 overlapping subspaces, windows, for ABF calculations (see Fig. S6). For each window, calculations were performed in three phases: targeted MD (53), equilibration, and ABF. Before calculations, molecular mechanics/generalized born analysis was performed on the aMD trajectories (54), and the low-energy structure in each window was chosen as the initial target for each window. Details of each phase, along with discussion of convergence criteria and error estimates, are present in SI Text and Fig. S7. Values in Table 2 were computed by a Boltzmann average and a standard deviation of the free energies in each region.
Supplementary Material
Acknowledgments.
The authors thank Dr. M. Fajer and members of the McCammon lab for valuable discussions concerning the work presented here. The project described here was supported by Award F32GM093581 from the National Institute of General Medical Sciences. This research used resources of the National Energy Research Scientific Computing Center, which is supported by the Office of Science of the US Department of Energy under Contract DE-AC02-05CH11231. This research was also supported in part by the National Science Foundation (NSF) through TeraGrid Supercomputer resources provided by a directors discretionary grant from the National Institute for Computational Science (TG-CHE100128) and the San Diego Supercomputer Center (TG-MCB090110) to Ross Walker. Additional support has been provided by NSF, National Institutes of Health, Howard Hughes Medical Institute, the Center for Theoretical Biological Physics, the National Biomedical Computation Resource, and the NSF Supercomputer Centers.
Footnotes
The authors declare no conflict of interest.
This article is a PNAS Direct Submission.
This article contains supporting information online at www.pnas.org/lookup/suppl/doi:10.1073/pnas.1117441109/-/DCSupplemental.
References
- 1.Wallin E, von Heijne G. Genome-wide analysis of integral membrane proteins from eubacterial, archaean, and eukaryotic organisms. Protein Sci. 1998;7:1029–1038. doi: 10.1002/pro.5560070420. [DOI] [PMC free article] [PubMed] [Google Scholar]
- 2.Keenan RJ, Freymann DM, Stroud RM, Walter P. The signal recognition particle. Annu Rev Biochem. 2001;70:755–775. doi: 10.1146/annurev.biochem.70.1.755. [DOI] [PubMed] [Google Scholar]
- 3.Rapoport TA. Protein translocation across the eukaryotic endoplasmic reticulum and bacterial plasma membranes. Nature. 2007;450:663–669. doi: 10.1038/nature06384. [DOI] [PubMed] [Google Scholar]
- 4.Wattenberg B, Lithgow T. Targeting of C-terminal (tail)-anchored proteins: Understanding how cytoplasmic activities are anchored to intracellular membranes. Traffic. 2001;2:66–71. doi: 10.1034/j.1600-0854.2001.20108.x. [DOI] [PubMed] [Google Scholar]
- 5.Kalbfleisch T, Cambon A, Wattenberg BW. A bioinformatics approach to identifying tail-anchored proteins in the human genome. Traffic. 2007;8:1687–1694. doi: 10.1111/j.1600-0854.2007.00661.x. [DOI] [PubMed] [Google Scholar]
- 6.Kutay U, Hartmann E, Rapoport TA. A class of membrane proteins with a C-terminal anchor. Trends Cell Biol. 1993;3:72–75. doi: 10.1016/0962-8924(93)90066-a. [DOI] [PubMed] [Google Scholar]
- 7.Favaloro V, Spasic M, Schwappach B, Dobberstein B. Distinct targeting pathways for the membrane insertion of tail-anchored (TA) proteins. J Cell Sci. 2008;121:1832–1840. doi: 10.1242/jcs.020321. [DOI] [PMC free article] [PubMed] [Google Scholar]
- 8.Schuldiner M, et al. The GET complex mediates insertion of tail-anchored proteins into the ER membrane. Cell. 2008;134:634–645. doi: 10.1016/j.cell.2008.06.025. [DOI] [PMC free article] [PubMed] [Google Scholar]
- 9.Simpson PJ, Schwappach B, Dohlman HG, Isaacson RL. Structures of Get3, Get4, and Get5 provide new models for TA membrane protein targeting. Structure. 2010;18:897–902. doi: 10.1016/j.str.2010.07.003. [DOI] [PMC free article] [PubMed] [Google Scholar]
- 10.Chang YW, et al. Crystal structure of Get4-Get5 complex and its interactions with Sgt2, Get3, and Ydj1. J Biol Chem. 2010;285:9962–9970. doi: 10.1074/jbc.M109.087098. [DOI] [PMC free article] [PubMed] [Google Scholar]
- 11.Hegde RS, Keenan RJ. Tail-anchored membrane protein insertion into the endoplasmic reticulum. Nat Rev Mol Cell Biol. 2011;12:787–798. doi: 10.1038/nrm3226. [DOI] [PMC free article] [PubMed] [Google Scholar]
- 12.Chartron JW, Suloway CJ, Zaslaver M, Clemons WM. Structural characterization of the Get4/Get5 complex and its interaction with Get3. Proc Natl Acad Sci USA. 2010;107:12127–12132. doi: 10.1073/pnas.1006036107. [DOI] [PMC free article] [PubMed] [Google Scholar]
- 13.Wang F, Brown EC, Mak G, Zhuang J, Denic V. A chaperone cascade sorts proteins for posttranslational membrane insertion into the endoplasmic reticulum. Mol Cell. 2010;40:159–171. doi: 10.1016/j.molcel.2010.08.038. [DOI] [PMC free article] [PubMed] [Google Scholar]
- 14.Chartron JW, Suloway CJ, Zaslaver M, Clemons WM. Structural characterization of the Get4/Get5 complex and its interaction with Get3. Proc Natl Acad Sci USA. 2010;107:12127–12132. doi: 10.1073/pnas.1006036107. [DOI] [PMC free article] [PubMed] [Google Scholar]
- 15.Wang F, Whynot A, Tung M, Denic V. The Mechanism of tail-anchored protein insertion into the ER membrane. Mol Cell. 2011;43:738–750. doi: 10.1016/j.molcel.2011.07.020. [DOI] [PMC free article] [PubMed] [Google Scholar]
- 16.Auld KL, et al. The conserved ATPase Get3/Arr4 modulates the activity of membrane-associated proteins in Saccharomyces cerevisiae. Genetics. 2006;174:215–227. doi: 10.1534/genetics.106.058362. [DOI] [PMC free article] [PubMed] [Google Scholar]
- 17.Mariappan M, et al. The mechanism of membrane-associated steps in tail-anchored protein insertion. Nature. 2011;477:61–66. doi: 10.1038/nature10362. [DOI] [PMC free article] [PubMed] [Google Scholar]
- 18.Stefer S, et al. Structural basis for tail-anchored membrane protein biogenesis by the Get3-receptor complex. Science. 2011;333:758–762. doi: 10.1126/science.1207125. [DOI] [PMC free article] [PubMed] [Google Scholar]
- 19.Stefanovic S, Hegde RS. Identification of a targeting factor for posttranslational membrane protein insertion into the ER. Cell. 2007;128:1147–1159. doi: 10.1016/j.cell.2007.01.036. [DOI] [PubMed] [Google Scholar]
- 20.Kurdi-Haidar B, Heath D, Naredi P, Varki N, Howell SB. Immunohistochemical analysis of the distribution of the human ATPase (hASNA-I) in normal tissues and its overexpression in breast adenomas and carcinomas. J Histochem Cytochem. 1998;46:1243–1248. doi: 10.1177/002215549804601104. [DOI] [PubMed] [Google Scholar]
- 21.Hemmingsson O, Zhang Y, Still M, Naredi P. ASNA1, an ATPase targeting tail-anchored proteins, regulates melanoma cell growth and sensitivity to cisplatin and arsenite. Cancer Chemother Pharmacol. 2009;63:491–499. doi: 10.1007/s00280-008-0762-2. [DOI] [PubMed] [Google Scholar]
- 22.Hemmingsson O, Nöjd M, Kao G, Naredi P. Increased sensitivity to platinating agents and arsenite in human ovarian cancer by downregulation of ASNA1. Oncol Rep. 2009;22:869–875. doi: 10.3892/or_00000511. [DOI] [PubMed] [Google Scholar]
- 23.Mateja A, et al. The structural basis of tail-anchored membrane protein recognition by Get3. Nature. 2009;461:361–366. doi: 10.1038/nature08319. [DOI] [PMC free article] [PubMed] [Google Scholar]
- 24.Suloway CJ, Chartron JW, Zaslaver M, Clemons WM. Model for eukaryotic tail-anchored protein binding based on the structure of Get3. Proc Natl Acad Sci USA. 2009;106:14849–14854. doi: 10.1073/pnas.0907522106. [DOI] [PMC free article] [PubMed] [Google Scholar]
- 25.Bozkurt G, et al. Structural insights into tail-anchored protein binding and membrane insertion by Get3. Proc Natl Acad Sci USA. 2009;106:21131–21136. doi: 10.1073/pnas.0910223106. [DOI] [PMC free article] [PubMed] [Google Scholar]
- 26.Hu J, Li J, Qian X, Denic V, Sha B. The crystal structures of yeast Get3 suggest a mechanism for tail-anchored protein membrane insertion. PLoS One. 2009;4:e8061. doi: 10.1371/journal.pone.0008061. [DOI] [PMC free article] [PubMed] [Google Scholar]
- 27.Yamagata A, et al. Structural insight into the membrane insertion of tail-anchored proteins by Get3. Genes Cells. 2010;15:29–41. doi: 10.1111/j.1365-2443.2009.01362.x. [DOI] [PubMed] [Google Scholar]
- 28.Lange O, Grubmüeller H. Full correlation analysis of conformational protein dynamics. Proteins Struct Funct Bioinf. 2008;70:1294–1312. doi: 10.1002/prot.21618. [DOI] [PubMed] [Google Scholar]
- 29.Hamelberg D, Mongan J, McCammon JA. Accelerated molecular dynamics: A promising and efficient simulation method for biomolecules. J Chem Phys. 2004;120:11919–11929. doi: 10.1063/1.1755656. [DOI] [PubMed] [Google Scholar]
- 30.Hamelberg D, de Oliveira CA, McCammon JA. Sampling of slow diffusive conformational transitions with accelerated molecular dynamics. J Chem Phys. 2007;127:155102. doi: 10.1063/1.2789432. [DOI] [PubMed] [Google Scholar]
- 31.Darve E, Rodríguez-Gómez D, Pohorille A. Adaptive biasing force method for scalar and vector free energy calculations. J Chem Phys. 2008;128:144120. doi: 10.1063/1.2829861. [DOI] [PubMed] [Google Scholar]
- 32.Hénin J, Fiorin G, Chipot C, Klein M. Exploring multidimensional free energy landscapes using time-dependent biases on collective variables. J Chem Theory Comput. 2010;6:35–47. doi: 10.1021/ct9004432. [DOI] [PubMed] [Google Scholar]
- 33.Yoshimoto K, Arora K, Brooks CL. Hexameric helicase deconstructed: Interplay of conformational changes and substrate coupling. Biophys J. 2010;98:1449–1457. doi: 10.1016/j.bpj.2009.12.4315. [DOI] [PMC free article] [PubMed] [Google Scholar]
- 34.Grant BJ, Gorfe AA, McCammon JA. Large conformational changes in proteins: Signaling and other functions. Curr Opin Struct Biol. 2010;20:142–147. doi: 10.1016/j.sbi.2009.12.004. [DOI] [PMC free article] [PubMed] [Google Scholar]
- 35.Jacobson MP, et al. A hierarchical approach to all-atom protein loop prediction. Proteins. 2004;55:351–367. doi: 10.1002/prot.10613. [DOI] [PubMed] [Google Scholar]
- 36.Hornak V, et al. Comparison of multiple Amber force fields and development of improved protein backbone parameters. Proteins. 2006;65:712–725. doi: 10.1002/prot.21123. [DOI] [PMC free article] [PubMed] [Google Scholar]
- 37.Meagher KL, Redman LT, Carlson HA. Development of polyphosphate parameters for use with the AMBER force field. J Comput Chem. 2003;24:1016–1025. doi: 10.1002/jcc.10262. [DOI] [PubMed] [Google Scholar]
- 38.Peters MB, et al. Structural survey of zinc containing proteins and the development of the zinc AMBER force field (ZAFF) J Chem Theory Comput. 2010;6:2935–2947. doi: 10.1021/ct1002626. [DOI] [PMC free article] [PubMed] [Google Scholar]
- 39.Jorgensen WL, Chandrasekhar J, Madura JD, Impey RW, Klein ML. Comparison of simple potential functions for simulating liquid water. J Chem Phys. 1983;79:926–935. [Google Scholar]
- 40.Case DA, et al. The Amber biomolecular simulation programs. J Comput Chem. 2005;26:1668–1688. doi: 10.1002/jcc.20290. [DOI] [PMC free article] [PubMed] [Google Scholar]
- 41.Phillips JC, et al. Scalable molecular dynamics with NAMD. J Comput Chem. 2005;26:1781–1802. doi: 10.1002/jcc.20289. [DOI] [PMC free article] [PubMed] [Google Scholar]
- 42.Wang Y, Harrison CB, Schulten K, McCammon JA. Implementation of accelerated molecular dynamics in NAMD. Comput Sci Discov. 2011;4:015002. doi: 10.1088/1749-4699/4/1/015002. [DOI] [PMC free article] [PubMed] [Google Scholar]
- 43.Darden T, York D, Pedersen L. Particle mesh Ewald—an N· log(N) method for Ewald sums in large systems. J Chem Phys. 1993;98:10089–10092. [Google Scholar]
- 44.Martyna GJ, Tobias DJ, Klein ML. Constant-pressure molecular-dynamics algorithms. J Chem Phys. 1994;101:4177–4189. [Google Scholar]
- 45.Feller SE, Zhang YH, Pastor RW, Brooks BR. Constant-pressure molecular-dynamics simulation—the langevin piston method. J Chem Phys. 1995;103:4613–4621. [Google Scholar]
- 46.Wereszczynski J, McCammon JA. In: Computational Drug Discovery and Design. Baron R, editor. Clifton, NJ: Humana Press; 2012. pp. 515–524. [DOI] [PubMed] [Google Scholar]
- 47.Trabuco LG, Villa E, Mitra K, Frank J, Schulten K. Flexible fitting of atomic structures into electron microscopy maps using molecular dynamics. Structure. 2008;16:673–683. doi: 10.1016/j.str.2008.03.005. [DOI] [PMC free article] [PubMed] [Google Scholar]
- 48.Humphrey W, Dalke A, Schulten K. VMD: Visual molecular dynamics. J Mol Graphics. 1996;14:33–38. doi: 10.1016/0263-7855(96)00018-5. [DOI] [PubMed] [Google Scholar]
- 49.Hess B, Kutzner C, van der Spoel D, Lindahl E. GROMACS 4: Algorithms for highly efficient, load-balanced, and scalable molecular simulation. J Chem Theory Comput. 2008;4:435–447. doi: 10.1021/ct700301q. [DOI] [PubMed] [Google Scholar]
- 50.Oliphant T. Python for scientific computing. Comp Sci Engin. 2007;9:10–20. [Google Scholar]
- 51.Jones E, et al. SciPy: Open source scientific tools for Python. 2001. http://www.scipy.org.
- 52.Hunter JD. Matplotlib: A 2D graphics environment. Comput Sci Eng. 2007;9:90–95. [Google Scholar]
- 53.Young MA, Gonfloni S, Superti-Furga G, Roux B, Kuriyan J. Dynamic coupling between the SH2 and SH3 domains of c-Src and Hck underlies their inactivation by C-terminal tyrosine phosphorylation. Cell. 2001;105:115–126. doi: 10.1016/s0092-8674(01)00301-4. [DOI] [PubMed] [Google Scholar]
- 54.Onufriev A, Bashford D, Case DA. Exploring protein native states and large-scale conformational changes with a modified generalized born model. Proteins. 2004;55:383–394. doi: 10.1002/prot.20033. [DOI] [PubMed] [Google Scholar]
Associated Data
This section collects any data citations, data availability statements, or supplementary materials included in this article.