

Abstract
Epiretinal prostheses for the blind bypass diseased photosensitive cells in the retina, directly stimulating retinal neurons electrically and evoking signals that are relayed to the brain. Current clinical implants have few electrodes and provide limited visual acuity. Acuity may be improved by identifying electrode array design features and operational details that enhance or interfere with visual percept formation. We labeled all retinal ganglion cells in whole mount retina with a calcium reporter and then measured the number and pattern of cells responding, over a range of electrode diameters and stimulus durations. Span of the response scaled with electrode diameter for electrodes 60 μm and larger. Short stimulation pulse widths selectively activated cells nearest the electrode. Our measurements in the salamander retina suggest that the spatial resolution is 150 μm, which on a human retina is equivalent to 0.55° of human visual field and corresponding Snellen acuity of 20/660. Reading large print could be possible with such a prosthesis.
Index Terms: Artificial vision, calcium imaging, electrical stimulation, neural stimulation, retina, visual acuity
I. Introduction
Retinitis pigmentosa (RP) is a family of inherited disorders causing blindness from the death of photoreceptors, with a prevalence of 100 000 in the United States and 1.5 million worldwide [1]. The genetic causes are heterogeneous, with 47 genetic loci implicated in retinitis pigmentosa (RetNet, http://www.sph.uth.tmc.edu/RetNet/) thus far. Photoreceptors are primarily affected, while inner retinal neurons and retinal ganglion cells have been shown to survive in advanced stages of the disease at rates of 78% and 30%, respectively [2]. One strategy for restoring sight is to electrically stimulate these surviving neurons in the retina. A subject with a 16-channel device was able to discriminate line orientation at spatial frequencies corresponding to the minimum possible width given the electrode spacing [3]. However, subject performance is highly variable. It is possible that adjacent electrodes activate overlapping regions of cells, introducing distortion additional to perceptual effects. The sensation of “light” seen during retinal stimulation, known as a percept or phosphene, is variable in shape and poorly understood [4], [5]. As implants are developed with more electrodes, it becomes important to understand how spatial information is conveyed from electrodes to the retina and how this impacts the acuity of prosthetic vision. Here, we used calcium imaging to measure spatial properties of activity in a large population of retinal ganglion cells (RGCs) during electrical stimulation of salamander retina in vitro (Figs. 1 and 2).
Fig. 1.

Calcium imaging and electrical stimulation were performed on the microscope stage. The retina was placed ganglion-cell-side-down on a transparent multielectrode array within the recording chamber show here. A porous membrane held the retina in place beneath the superfusion medium. Current pulses were applied to transparent or opaque electrodes, one electrode at a time. Diagram not to scale.
Fig. 2.

Fluorescence images were collected in real time during electrical stimulation. In the micrograph shown (scale bar 50 μm), the electrode encircled in light blue was stimulated. Fluorescence traces from the calcium indicator dye in several ganglion cells are shown with increasing stimulus amplitude. Traces are averages of 25 repetitions.
In normal vision, light refracted by the cornea and lens forms an image on the retina. Photons pass through the neural retina to be absorbed by photopigments in the outer segments of photoreceptor cells on the rear side of the retina. Following early visual processing by retinal neurons [6]–[8], the RGCs, as the output neurons of the retina, project axons over the front surface of the retina, where they converge at the optic disk to form the optic nerve. Electrical stimulation can excite multiple types of retinal neurons simultaneously, with an uncertain relationship between this population of cells and the visual percept.
Electrically-elicited phosphenes have been reported for decades [9], but only recently have investigations in retinal stimulation considered the possibility of evoking highly focal percepts using microelectrode arrays (MEAs) with very small electrodes [10]–[12].
Many studies measured electrically-evoked spike trains with high temporal resolution. There is presently a need for spatial information to relate percept shape [13] to stimulus design. Besides electrode size, pulse width may be important for controlling the form of the percept by altering the balance between stimulation of axons, RGC axon initial segment and the inner retina [14], [15].
Recording activity from many neurons [16] is typically accomplished with MEAs [17], such as the 512-electrode array [18] used to map receptive field mosaics in the primate retina [6] in response to optical stimulation. Electrical recordings from MEAs are challenged by occlusion of the response spike with stimulus artifact. Cell-attached patch electrodes or limiting the stimulus to short pulse widths (≪ 200 μs; [10]) can improve spike recordings, especially with artifact subtraction techniques. In this paper, we report the use of intracellular calcium imaging [19] in what is essentially the inverse of typical MEA experiments; we probed optically for “electrical receptive fields” of cells responding to electrical stimulation. Optical measurements of neuronal spiking allowed us to investigate parameter space relevant to the epiretinal prosthesis as it is practically implemented: larger electrodes and imperfect contact with the retinal surface from a monolithic MEA.
We found that the shape of the field of excited cells could be controlled by pulse width, where shorter pulses evoked a more focal response. Distancing the MEA from the retina raised stimulation threshold but had a modest impact on response area. In our evaluation of a range of electrode sizes we found a lower limit to the size of the response area refractory to reduction in the electrode diameter below 60 μm.
II. Materials and Methods
A. Imaging
Eyecups from larval tiger salamanders were retrograde-stained with the calcium indicator Oregon-Green-BAPTA-1-dextran and imaged, as described previously [19]. Total fluorescence from each cell was convolved with a difference filter; a defined threshold level was set to detect events of rapid increase in intracellular calcium. Animals were handled in accordance with protocols approved by the Institutional Animal Care and Use Committee at the University of Southern California. The stained retina was mounted onto a porous membrane (# JVWP01300, Millipore, Billerica, MA) held taut over a titanium ring and placed ganglion-cell-side down on an MEA designed and fabricated by the authors (Fig. 1). Transparent MEA electrodes and traces were patterned from indium–tin–oxide film (sheet resistance of 10 Ohms/square) on glass substrates (22 × 26 × 0.13-mm thick), similar to those used for other in vitro studies [20]. Traces were insulated with a 1- to 2-μm thick layer of silicon nitride. All 10-μm and some larger electrodes were electroplated with platinum/iridium by cyclic voltammetry from –0.7 to 0.8 V at 50 mV/s versus Ag/AgCl reference electrode.
B. Threshold Measurement
Stimulus pulse trains of cathodic-first biphasic pulses were applied to single electrodes to measure threshold for the cells in the vicinity of the stimulation site (Fig. 2). Amplitude and pulse width values are all stated for the cathodic phase. Each stimulus consisted of a 40-pulse burst at 333 Hz. Burst stimuli were repeated 25 times on 2-s intervals. The fraction of the 25 stimuli eliciting a response (dose-response curve) over ten stimulation amplitudes was fitted by a sigmoidal function; individual fits were performed for each cell in the image. Threshold was defined as the stimulation amplitude yielding a 50% response. Data from multiple experiments in the same parameter space were pooled by binning cells in a grid according to spatial location relative to the stimulating electrode and optic disk. Threshold maps in Figs. 3 and 5 were generated from the mean threshold of each grid point. The location of the response relative to the electrode was calculated by fitting a paraboloid, G(x,y) to the map thresholds, T(x,y), minimizing the sum squared error of e–G(x,y) – e–T(x,y)
| (1) |
Fig. 3.

Threshold maps for 200-μm electrodes (black circle) at three different pulse widths: A: 60-, B: 400-, C: 1000-μs. Colored dots represent the threshold current to stimulate cells at those locations. Small, medium and large dots contain 1–3, 4–5, 6+ cells. Blue oval marks the extent of the response where threshold rises 50% above the minimum value. Maps have been oriented such that the optic disk lies to the left of the image, with axons running horizontally toward their originating somata to the right. Faint open circles mark locations where observed cells did not respond to the highest stimulation amplitude. Scale bar 100 μm.
Fig. 5.

Threshold maps for three electrode sizes (A: 10-, B: 30-, C: 60-μm electrode diameters). Pulse width was 400 ms. Small, medium, and large dots contain 1–3, 4–5, 6+ cells. Blue oval marks the extent of the response where threshold rises 50% above the minimum value. Response regions local to the electrode could not be accurately calculated in A and B due to the streak-like form of the response. Scale bar 50-μm.
In (1), Tmin is the minimum threshold, k is the factor increase in threshold where the response is defined to be bounded (set to 0.5), the coordinates (x0,y0) are the center of the response area and λx and λy are the elliptical extents of the response area. The fitting was performed for grid intervals from 5 to 30 μm and the resulting values averaged. This process provided robust calculations of response location, but not always of extents. The size of the response was then calculated from the threshold profile (threshold as a function of cell distance from the center of the response). The radius of the excitation extents was the point where threshold was 1.5 times its minimum value.
The response was classified as a streak (Table I) if the threshold of distant peripheral cells was not significantly (p < 0.05) higher than 120% of the mean threshold within 100 μm of the response location. Cells farther than 150 μm from the response center, on the side of the electrode far from the optic disk were classified as antidromically-stimulated cells.
TABLE I.
Spatial Properties of Evoked Responses the Diameter of the Responding Region is Noted as ϕ(μm), With a Displacement to the Periphery of Δ(μm). the Average Threshold for n Cells Within a 200-μm-Diameter Area is T(μA)± Standard Error of the Mean (SEM).
| Spacer (μm) | Electrode diameter (μm) | Pulse width |
||||||||
|---|---|---|---|---|---|---|---|---|---|---|
| 60 μs | 400 μs | 1000 μs | ||||||||
| ϕ | Δ | T ± SEM, n | ϕ | Δ | T ± SEM, n | ϕ | Δ | T ± SEM, n | ||
| 0 | 10 | nd | nd | 6.9 ±0.6, 6 | 140 | SK | 1.05 ±0.04, 122 | 290 | SK | 0.87 ±0.03, 21 |
| 30 | nd | nd | 6.0 ±0.4, 27 | 230 | SK | 1.84 ±0.09, 94 | 200 | SK | 1.32 ±0.04, 81 | |
| 60 | 170 | 77 | 21.7 ±0.5, 80 | 170 | 58 | 3.2 ±0.2, 193 | 240 | SK | 3.2 ±0.1, 94 | |
| 200 | 200 | 57 | 13.5 ±0.4, 229 | 240 | 33 | 3.3 ±0.1, 242 | 440 | 11 | 2.33 ±0.07, 156 | |
| 30 | 60 | 130 | 39 | 41.9 ±0.7, 88 | 190 | 62 | 9.5 ±0.2, 93 | 230 | 37 | 5.45 ±0.08, 109 |
| 200 | nd | nd | > 50 | 370 | 66 | 11.4 ±0.1, 99 | 400 | 45 | 5.82 ±0.07, 103 | |
| 50 | 60 | nd | nd | nd | 180 | 81 | 22.6 ±1, 31 | nd | nd | nd |
| 200 | nd | nd | > 50 | 380 | 40 | 20.5 ±1, 81 | 400 | 33 | 12.2 ±0.8, 57 | |
SK: Streak Response; ND: Insufficient DATA
C. Spacer Gels
In vitro measurements of threshold with saline spacer gels were accomplished by depositing a thin layer of liquid agarose to the MEA. The MEA was mounted onto a variable speed spinning platform and held stationary while 0.5 mL of liquid agarose (1% in superfusion medium without calcium chloride) was pipetted into the recording chamber of the MEA. Spin speed was immediately ramped to 500 revolutions per minute (RPM). This step formed the adhesion layer of gel (10 μm). The speed was then raised to and maintained at 1800 RPM while pipetting 0.1-mL liquid agarose on 30-s intervals to build up the gel thickness. At all times the liquid agarose solution and pipette tip were maintained at 45 °C while the MEA was held at room temperature. After gel was applied, the MEA was chilled to 4 °C for 30 min. Gel on the perimeter of the chamber was trimmed away, the MEA warmed to room temperature and finally the retina was applied onto the gel-coated surface.
III. Results
A. Pulse Width
Stimulation pulse width affected several properties of the response. Long pulses led to spikes in a streak-shaped pattern of cells having axons that crossed the electrode, but short pulses evoked spikes in a cluster of cells near the electrode (Fig. 3). Although a streak can be seen at each pulse width, the threshold for this result was higher at shorter pulse widths. The mean threshold of the streak was higher than the local response mean threshold by 92% (p < 0.0001, student t-test), 60% (p < 0.0001), and 37% (p < 0.0001) for pulse widths of 60, 400, and 1000 μs (cathodic phase), respectively. Cells at any given location vary greatly in threshold, so we quantify the difference in threshold distributions as the number of standard deviations in threshold between local cells and axon bundles. Selectivity of 200-μm electrodes was 1.9, 1.1, and 0.95 standard deviations, for 60-, 400-, and 1000-μs pulses, respectively. Therefore, minimizing pulse width and amplitude may be a strategy to spatially confine the response.
B. Targeted Cells
Ganglion cells and other cells contributed to the response at different pulse widths. The responding RGCs were located over the side of the electrode peripheral to (away from) the optic disk for short pulses, but centered over the electrode at 1000 μs (Table I, Δ values). The lateral offset in response at short pulses was consistent with other evidence that the axon initial segment near the soma is the site of stimulation in RGCs [21], [22], not the soma itself. Therefore we hypothesized that long pulses, having no response offset, stimulated a cell type other than RGCs. Pharmacologically isolating RGCs from bipolar cell input [23] with the ionotropic glutamate receptor blocker kynurenic acid (1 mM) caused threshold to increase and the response area to shift to the periphery by 23 μm (p < 0.05, n = 54 cells, Kolmogorov–Smirnov test on threshold profile) at 1000 μs. Thresholds in individual RGCs with kynurenic acid (Fig. 4) were effectively unaltered (+2.9% n = 38 cells p < 0.006) for 60-μs pulses, moderately increased by 42% (n = 175p < 0.0001) at 400 μs and increased by 92% (n = 150p < 0.0001) at 1000 μs. Therefore, short pulses directly stimulated RGCs whereas longer pulses (1000 μs) did not. Moreover, directly-stimulated RGCs were positioned tens of micrometers from the electrode with the axon initial segment over the electrode. Pulses of 1000 μs activated RGCs through the presynaptic network at about 1/2 of the threshold with kynurenic acid for direct stimulation of their axon initial segment.
Fig. 4.
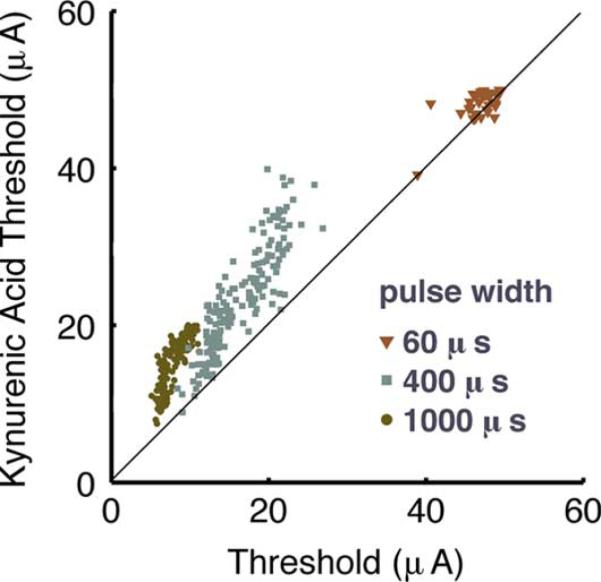
Stimulation from a 200-μm electrode targets different cells in a pulse width dependent manner. RGC thresholds at short pulse widths remain the same when isolated from bipolar cell input by kynurenic acid, indicative of direct stimulation. Threshold for the RGC response rose for long pulse widths when bipolar cell input was blocked.
C. Limitations of Small Electrodes
Electrodes smaller than 200 μm in diameter had highly variable thresholds and evoked streak-like responses characteristic of axon bundle stimulation (Fig. 5). Assuming that axon bundles can be avoided (e.g., by short pulses), the minimal span (perpendicular to the path of axons) of the response was still not less than about 150 μm (Fig. 5), even for 10-μm electrodes. Response area decreased with decreasing electrode size down to 60 μm but no further (Table I). Further reduction in electrode size is unlikely to improve visual acuity and would unnecessarily raise electrochemical charge density on the electrode surface. These results indicate that electrodes for retinal prostheses should have widths of at least 60 μm to keep charge density (Coulombs/cm2) low for the electrochemical safety of the device [24], [25]. Our finding of a minimal response area larger than the electrode points to the possibility of a mechanism for current to spread to distant cells.
D. Separating the MEA From the Retina
In vivo the MEA does not make perfect contact with the retina, being separated from the surface in extreme cases by as much as 1000 μm [26]. The surgical process of tacking the MEA to the retina results in good contact near the tacking point and, sometimes, poor contact away from the tack. Such separation of the electrode raises threshold and may affect percepts. Therefore, saline spacer gels 30- or 50-μm thick were applied between the retina and MEA by spin deposition of conductive liquid agarose gel to replicate imperfect contact in vitro. A gap between the MEA and the retina caused threshold to rise, but with very little detriment to spatial resolution (Table I). For example, in 200-μm electrodes and 1000-μs pulses the response width was about 400 μm regardless of separation. However, at 400-μs pulses the response area did widen by a factor of 1.5 upon separation. Sensitivity to separation was greater at shorter pulses.
IV. Discussion
The formation of patterned percepts from many electrodes depends at least in part upon our ability to evoke distinct pixel-like activation patterns over each electrode on the array. At short pulses, RGCs near the electrode were directly stimulated at a point tens of micrometers distal to the soma (Table I). Similarly, Fried et al. found direction-sensitive cells in rabbit retina [22] to be stimulated at the tapered segment of the axon, 40 μm from the soma, where a high sodium channel density was found. Primate parasol cells [11] have been most effectively stimulated ~ 13 μm from the soma. Stimulation of the axon initial segment at short pulses is conducive to pattern stimulation because the cells are proximal to the electrode regardless of the small displacement, in contrast to stimulation of axons bundles connected to distant cells.
The proximity of electrodes to axons on the vitreal surface of the retina presents a challenge to selective epiretinal stimulation of cell bodies local the electrode. We observed response patterns indicating stimulation of axon bundles, axon initial segments and presynaptic cells. Using 60-μs pulses improved selective stimulation of local RGCs, as found in Section III-A. Other investigations in rabbit retina found axon threshold to be higher than somatic threshold by 88% at 100 μs [27] and 400%–500% for pulses less than 1000 μs [14]. Targeted stimulation of RGC axon initial segments at short pulse widths could be one strategy to maximize visual acuity.
Alternately, one could target presynaptic neurons with 1000-μs pulses, but these also stimulate axon bundles, as described in Results and Fig. 3. Pulse shape could be modified to remove the frequency components that axon bundles preferentially respond to. Sinusoids have been investigated to selectively stimulate RGC and bipolar populations of retinal neurons [28].
The methods in this study did not permit identification of the presynaptic cells that were activated under long-pulse stimulation. Contributions from photoreceptors or inner retinal circuits are possible in our experiment with a healthy retina that would differ from a degenerated human retina. We have attempted to minimize the influence of presynaptic cells on our measurements by applying stimuli at 333 Hz, which is above the 10 Hz rate known to inhibit inner retinal circuits [10], [29].
Electrode edge effects were not observed in the threshold maps. Current density entering homogeneous isotropic medium from a disk electrode is known to be concentrated on the perimeter [30], which could result in annular activation pattern of neurons. However, the retinal prosthesis operates under less idealized conditions. The nonuniformity of current density decays rapidly with time [31] and distance from the electrode surface [32]. The retina's laminar structure makes its conductivity inhomogeneous [33]. Additionally, the nerve fiber layer may contribute to anisotropy due to its morphology. In the retina, we observe that threshold is highly uniform over the surface of the electrode (Fig. 3).
The area of activated neurons scales with electrode size for large electrodes. In rabbit retina [14], RGC response regions (extents bounded by 50% increase in threshold) were 100 μm and 600 μm for electrodes 125 μm and 500 μm in diameter, respectively. In cat retina [34], cortical areas were equivalent to retinal areas 240 μm and 140 μm wide for electrodes 100 μm wide and conical tipped 80 μm × 30 μm, respectively. Conceptually it seems possible to stimulate individual ganglion cells with a dense array of very small electrodes. However two factors appear to limit the spatial resolution of the retinal prosthesis. First, we report that larger electrodes stimulated more cells, but electrodes as small as 10 μm did not reduce the response area to span less than about 150 μm. Second, axon bundle stimulation may place a fundamental limit on retinotopic, patterned stimulation. Nevertheless, our findings suggest that short pulse width is the best tool to localize stimulation to cells near the electrode.
Reducing electrode size to achieve higher spatial resolution is constrained by the electrochemical charge injection limit. A very conservative safety limit for platinum is 0.1 mC/cm2 geometric area [35]. Using this value, a 60-μm electrode should not exceed 2800 pC, or 47 μA × 60 μs. Observed threshold on 60-μm electrodes at 60 μs was 21.7 μA. Adding a 30-μm saline layer raised threshold to 41.9 μA. Further increase in distance from the retinal surface is expected to raise threshold above the safety limit for small electrodes such as the ones evaluated in this study.
The minimum RGC response area in our experiments was roughly 150 μm in diameter. If this same response area were generated in humans, then the visual acuity possible would be 20/660, since 150 μm is equal to 0.55° in human visual field [36]. This visual acuity would enable a person to read text printed in 76-point font from 35 cm [37], assuming the prosthesis optics are of equivalent magnification to the human eye. A user-controlled zoom lens could enhance the ability to read smaller print. Considering these practical resolution limits, the optimal MEA design for a human device is a grid of electrodes 60–100μm in diameter, spaced by roughly 150 μm center to center. 260 electrodes could be placed in the central 10° of visual field, critical for reading [38]. A 5 × 5 – mm2 grid could contain > 1000 electrodes for mobility tasks in addition to reading. Current epiretinal implants have large electrodes, so it is not possible to verify these predictions in humans, however, achieving visual acuity will likely require interface technology that penetrates the retina or in some other way promotes selective coupling between electrodes and individual cells.
Stimulation thresholds (reviewed in [10]) are very low in vitro, but higher in vivo. Imperfect contact with the retina or stimulation of both ON-cells and OFF-cells could contribute to higher clinical thresholds. It may be beneficial to apply a burst of pulses encoding visual data [39] to drive RGCs to spike in a natural fashion [29] that the brain expects, for the purpose of reducing perceptual threshold. Change in higher visual centers after prolonged blindness [40] may be another factor contributing to higher thresholds. Reducing human perceptual thresholds to in vitro excitation thresholds will help to avoid stimulation of axon bundles to enable high-resolution pattern stimulation.
Acknowledgment
The authors would like to thank A. Petrossians for providing Pt/Ir electroplating solution and A. P. Sampath for assistance with housing salamanders.
This work was supported in part by the Barbara Smith Rose family, in part by the National Science Foundation under Grant EEC-0310723, in part by the WM Keck Foundation, and in part by the Albaugh Trust. The work of M. Behrend was supported by the Fannie and John Hertz Foundation. M. S. Humayun has financial interest in Second Sight Medical Products.
Biography
 Matthew Behrend received the B.S. degree in electrical engineering from the University of Southern California (USC), Los Angeles, in 2004, where he designed pulsed power electronics for real-time microscopy of pulsed cells. He received the Ph.D. degree in electrical engineering from USC, in 2009.
He worked as a summer hire at TRW in 2001 and Northrop Grumman in 2003. He is presently at Intellectual Ventures improving global health and developing models to assist disease eradication campaigns.
 Ashish Ahuja received the B.S. degree in applied physics and the M.S. degree in electrical engineering from Columbia University, in 1999 and 2002, respectively, and the Ph.D. degree in electrical engineering-electrophysics from The University of Southern California (USC), Los Angeles, in 2007. At USC he designed and fabricated microelectrode arrays and used these devices for retinal electrophysiology experiments towards the development of a retinal prosthesis implant for the blind.
He worked for two years in the Condensed Matter Physics and Fiber Optics Devices Departments at Bell Laboratories. He worked as an NIH BRP (Bioengineering Research Partnership) Post-Doctoral Fellow and then as a Research Scientist, at Second Sight Medical Products for three years. He is currently the Executive Director of Operations for The California Project to Cure Blindness at USC. The CPCB's focus is to develop a stem cell based therapy for age-related macular degeneration.
 Mark Humayun (M'97) received the Ph.D. degree from Duke University Medical School, Durham, NC, in 1989, and the Ph.D. degree in biomedical engineering from the University of North Carolina, Chapel Hill, in 1993. He then served a residency in ophthalmology at Duke Eye Center and fellowships at the Retinovascular Center at Johns Hopkins Hospital, Baltimore, MD, and in vitreoretinal surgery at the Johns Hopkins Medical Institution.
As Assistant Professor of Ophthalmology at the Johns Hopkins Wilmer Eye Institute from 1995 to 2001, his research focused on microelectronic solutions for severe retinal disease. He joined the Doheny Retina Institute of the Doheny Eye Institute, Los Angeles, CA, in August 2001, where his three appointments include ophthalmology, biomedical engineering and cell and neurobiology. He holds the Cornelius J. Pings Chair in Biomedical Sciences and holds a joint professorship at the Keck School of Medicine and the Viterbi School of Engineering at the University of Southern California, Los Angeles, and Associate Director of Research at the Doheny Retina Institute, where he provides patient care while developing innovative techniques and diagnostics to treat blinding retinal disorders. His quest to find a cure for currently untreatable blinding retinal diseases led him to become one of the primary creators of the intraocular retinal prosthesis that was recently implanted into the first patient in an FDA investigational device study.
Dr. Humayun is a member of the Institute of Medicine.
 Robert Chow was born in Washington, DC. He received the B.A. degrree in biology from Brown University, Providence, RI, in 1981, and the M.D.-Ph.D. physiology, medical scientist training program, in 1988, from University of Pennsylvania, Philadelphia, PA, working with Prof. C. Armstrong on calcium channel biophysics. He completed an Internal Medicine Residency at the University of Colorado Health Sciences Center (Clinical Investigator Pathway, ABIM board certification).
As a Howard Hughes Medical Institute Physician Postdoctoral Fellow and Alexander von Humboldt Fellow, he was a Postdoctal Fellow in the laboratory of Prof. E. Neher at the Max Planck Institute in Goettingen, Germany, investigating the biophysics of calcium-dependent cellular secretion. His first faculty position as a Lecturer, then Senior Lecturer, was in the Department of Physiology at the University of Edinburgh School of Medicine, where he was awarded the Sir Henry Wellcome Innovative Research Award. Since 2000, he has been an Associate Professor of Physiology at the Keck School of Medicine at the University of Southern California, Los Angeles, where he researches the molecular control of cellular secretion and collaborates with Prof. M. Humayun on developing novel retinal prostheses.
Dr. Chow is a member of the Biophysical Society, the American College of Physicians, and the Society for Neuroscience.
 James Weiland (SM'08) received the B.S. degree from the University of Michigan (UM) in 1988. After four years in industry with Pratt & Whitney Aircraft Engines, he returned to UM and received the M.S. and Ph.D. degrees in biomedical engineering, in 1993 and 1997, and the M.S. degree in electrical engineering, in 1995.
He joined the Wilmer Ophthalmological Institute at Johns Hopkins University in 1997 as a postdoctoral fellow and, in 1999, was appointed an Assistant Professor of Ophthalmology at Johns Hopkins. He was appointed Assistant Professor at the Doheny Eye Institute-University of Southern California, in 2001. Currently, he is an Associate Professor of Ophthalmology and Biomedical Engineering, University of Southern California. His research interests include retinal prostheses, neural prostheses, electrode technology, visual evoked responses and implantable electrical systems.
Dr. Weiland is a member of the Association for Research in Vision and Ophthalmology.
Contributor Information
Matthew R. Behrend, University of Southern California, Los Angeles, CA 90033 USA. He is now with Intellectual Ventures, Bellevue, WA 98005 USA (behrend04@gmail.com).
Ashish K. Ahuja, Department of Electrical Engineering, University of Southern California, Los Angeles, CA 90033 USA (ah.ashish@gmail.com).
Mark S. Humayun, Doheny Eye Institute and the University of Southern California, Los Angeles, CA 90033 USA (humayun@usc.edu)..
Robert H. Chow, Department of Physiology and Biophysics, University of Southern California, Los Angeles, CA 90033 USA (rchow@usc.edu).
James D. Weiland, Department of Biomedical Engineering and Doheny Eye Institute, University of Southern California, Los Angeles, CA 90033 USA (jweiland@doheny.org)..
References
- 1.Sharma RK, Ehinger B. Management of hereditary retinal de-generations: Present status and future directions. Surv. Ophthalmol. 1999 Mar-Apr;43(5):427–44. doi: 10.1016/s0039-6257(99)00006-5. [DOI] [PubMed] [Google Scholar]
- 2.Santos A, et al. Preservation of the inner retina in retinitis pigmentosa. A morphometric analysis. Arch. Ophthalmol. 1997 Apr.115(4):511–5. doi: 10.1001/archopht.1997.01100150513011. [DOI] [PubMed] [Google Scholar]
- 3.Caspi A, et al. Feasibility study of a retinal prosthesis: Spatial vision with a-electrode implant. Arch. Ophthalmol. 2009;127(4):398–401. doi: 10.1001/archophthalmol.2009.20. [DOI] [PubMed] [Google Scholar]
- 4.Margalit E, et al. Retinal prosthesis for the blind. Surv. Ophthalmol. 2002 Jul-Aug;47(4):335–56. doi: 10.1016/s0039-6257(02)00311-9. [DOI] [PubMed] [Google Scholar]
- 5.Rizzo JF, et al. Perceptual efficacy of electrical stimulation of human retina with a microelectrode array during short-term surgical trials. Invest. Ophthalmol. Vis. Sci. 2003 Dec.44(12):5362–9. doi: 10.1167/iovs.02-0817. [DOI] [PubMed] [Google Scholar]
- 6.Field GD, Chichilnisky EJ. Information processing in the primate retina: Circuitry and coding. Annu. Rev. Neurosci. 2007;30:1–30. doi: 10.1146/annurev.neuro.30.051606.094252. [DOI] [PubMed] [Google Scholar]
- 7.Dacey DM. Primate retina: Cell types, circuits and color opponency. Prog. Retin Eye Res. 1999 Nov.18(6):737–63. doi: 10.1016/s1350-9462(98)00013-5. [DOI] [PubMed] [Google Scholar]
- 8.Masland RH. Neuronal diversity in the retina. Curr. Opin. Neurobiol. 2001 Aug.11(4):431–6. doi: 10.1016/s0959-4388(00)00230-0. [DOI] [PubMed] [Google Scholar]
- 9.Potts AM, Inoue J. The electrically evoked response (EER) of the visual system. II. Effect of adaptation and retinitis pigmentosa. Invest. Ophthalmol. 1969 Dec.8(6):605–12. [PubMed] [Google Scholar]
- 10.Sekirnjak C, et al. Electrical stimulation of mammalian retinal ganglion cells with multielectrode arrays. J. Neurophysiol. 2006 Jun.95(6):3311–27. doi: 10.1152/jn.01168.2005. [DOI] [PubMed] [Google Scholar]
- 11.Sekirnjak C, et al. High-resolution electrical stimulation of primate retina for epiretinal implant design. J. Neurosci. 2008;28(17):4446–56. doi: 10.1523/JNEUROSCI.5138-07.2008. [DOI] [PMC free article] [PubMed] [Google Scholar]
- 12.Grumet AE, Wyatt JL, Jr., Rizzo JF. Multi-electrode stimulation and recording in the isolated retina. J. Neurosci. Methods. 2000 Aug.101(1):31–42. doi: 10.1016/s0165-0270(00)00246-6. [DOI] [PubMed] [Google Scholar]
- 13.Nanduri D, et al. Retinal prosthesis phosphene shape analysis. Conf. Proc. IEEE Eng. Med. Biol. Soc. 2008;2008:1785–8. doi: 10.1109/IEMBS.2008.4649524. [DOI] [PubMed] [Google Scholar]
- 14.Jensen RJ, Ziv OR, Rizzo JF. Thresholds for activation of rabbit retinal ganglion cells with relatively large, extracellular micro-electrodes. Invest. Ophthalmol. Vis. Sci. 2005 Apr.46(4):1486–96. doi: 10.1167/iovs.04-1018. [DOI] [PubMed] [Google Scholar]
- 15.Margalit E, Thoreson WB. Inner retinal mechanisms engaged by retinal electrical stimulation. Invest. Ophthalmol. Vis. Sci. 2006 Jun.47(6):2606–2612. doi: 10.1167/iovs.05-1093. [DOI] [PMC free article] [PubMed] [Google Scholar]
- 16.Segev R, et al. Recording spikes from a large fraction of the ganglion cells in a retinal patch. Nat. Neurosci. 2006 Jun.47(6):1154–16. doi: 10.1038/nn1323. [DOI] [PubMed] [Google Scholar]
- 17.Morin FO, Takamura Y, Tamiya E. Investigating neuronal activity with planar microelectrode arrays: Achievements and new perspectives. J. Biosci. Bioeng. 2005 Aug.100(2):131–143. doi: 10.1263/jbb.100.131. [DOI] [PubMed] [Google Scholar]
- 18.Litke AM, et al. What does the eye tell the brain?: Development of a system for the large-scale recording of retinal output activity. IEEE Trans. Nucl. Sci. 2004 Aug.51(4):1434–1440. [Google Scholar]
- 19.Behrend MR, et al. Selective labeling of retinal ganglion cells with calcium indicators by retrograde loading in vitro. J. Neurosci. Methods. 2009 May;179(2):166–72. doi: 10.1016/j.jneumeth.2009.01.019. [DOI] [PMC free article] [PubMed] [Google Scholar]
- 20.Gross GW, Wen WY, Lin JW. Transparent indium-tin oxide electrode patterns for extracellular, multisite recording in neuronal cultures. J. Neurosci. Methods. 1985;15(3):243–52. doi: 10.1016/0165-0270(85)90105-0. [DOI] [PubMed] [Google Scholar]
- 21.Carras PL, Coleman PA, Miller RF. Site of action potential initiation in amphibian retinal ganglion cells. J. Neurophysiol. 1992 Feb.67(2):292–304. doi: 10.1152/jn.1992.67.2.292. [DOI] [PubMed] [Google Scholar]
- 22.Fried SI, et al. Axonal sodium-channel bands shape the response to electric stimulation in retinal ganglion cells. J. Neurophysiol. 2009 Apr.101(4):1972–87. doi: 10.1152/jn.91081.2008. [DOI] [PMC free article] [PubMed] [Google Scholar]
- 23.Massey SC, Miller RF. Glutamate receptors of ganglion cells in the rabbit retina: Evidence for glutamate as a bipolar cell transmitter. J. Physiol. 1988 Nov.405:635–55. doi: 10.1113/jphysiol.1988.sp017353. [DOI] [PMC free article] [PubMed] [Google Scholar]
- 24.Mccreery DB, et al. Charge-density and charge per phase as cofactors in neural injury induced by electrical-stimulation. IEEE Trans. Biomed. Eng. 1990 Oct.37(10):996–1001. doi: 10.1109/10.102812. [DOI] [PubMed] [Google Scholar]
- 25.Merrill DR, Bikson M, Jefferys JGR. Electrical stimulation of excitable tissue: Design of efficacious and safe protocols. J. Neurosci. Methods. 2005 Feb.141(2):171–198. doi: 10.1016/j.jneumeth.2004.10.020. [DOI] [PubMed] [Google Scholar]
- 26.de Balthasar C, et al. Factors affecting perceptual thresholds in epiretinal prostheses. Invest. Ophthalmol. Vis. Sci. 2008 Jun.49(6):2303–14. doi: 10.1167/iovs.07-0696. [DOI] [PMC free article] [PubMed] [Google Scholar]
- 27.Jensen RJ, et al. Thresholds for activation of rabbit retinal, ganglion cells with an ultrafine, extracellular microelectrode. Invest. Ophthalmol. Vis. Sci. 2003 Aug.44(8):3533–3543. doi: 10.1167/iovs.02-1041. [DOI] [PubMed] [Google Scholar]
- 28.Freeman DK, et al. Selective activation of neuronal targets with sinusoidal electric stimulation. J. Neurophysiol. 2010;104(5):2778–17791. doi: 10.1152/jn.00551.2010. [DOI] [PMC free article] [PubMed] [Google Scholar]
- 29.Fried SI, Hsueh HA, Werblin FS. A method for generating precise temporal patterns of retinal spiking using prosthetic stimulation. J. Neurophysiol. 2006 Feb.95(2):970–8. doi: 10.1152/jn.00849.2005. [DOI] [PubMed] [Google Scholar]
- 30.Newman J. Resistance for flow of current to a disk. J. Electrochem. Soc. 1966;113(5):501. [Google Scholar]
- 31.Behrend MR, Ahuja AK, Weiland JD. Dynamic current density of the disk electrode double-layer. IEEE Trans. Biomed. Eng. 2008 Mar.55(3):1056–1062. doi: 10.1109/TBME.2008.915723. [DOI] [PubMed] [Google Scholar]
- 32.Suesserman MF, Spelman FA, Rubinstein JT. In vitro measurement and characterization of current-density profiles produced by nonrecessed, simple recessed and radially varying recessed stimulating electrodes. IEEE Trans. Biomed. Eng. 1991 May;38(5):401–408. doi: 10.1109/10.81558. [DOI] [PubMed] [Google Scholar]
- 33.Karwoski CJ, Frambach DA, Proenza LM. Laminar profile of resistivity in frog retina. J. Neurophysiol. 1985 Dec.54(6):1607–19. doi: 10.1152/jn.1985.54.6.1607. [DOI] [PubMed] [Google Scholar]
- 34.Eckhorn R, et al. Visual resolution with retinal implants estimated from recordings in cat visual cortex. Vis. Res. 2006 Sep.46(17):2675–90. doi: 10.1016/j.visres.2006.01.034. [DOI] [PubMed] [Google Scholar]
- 35.Rose TL, Robblee LS. Electrical-stimulation with Pt electrodes .8. electrochemically safe charge injection limits with 0.2 Ms pulses. IEEE Trans. Biomed. Eng. 1990 Nov.37(11):1118–1120. doi: 10.1109/10.61038. [DOI] [PubMed] [Google Scholar]
- 36.Drasdo N, Fowler CW. Non-linear projection of the retinal image in a wide-angle schematic eye. Br. J. Ophthalmol. 1974 Aug.58(8):709–14. doi: 10.1136/bjo.58.8.709. [DOI] [PMC free article] [PubMed] [Google Scholar]
- 37.Holladay JT. Visual acuity measurements. J. Cataract Refractive Surg. 2004 Feb.30(2):287–290. doi: 10.1016/j.jcrs.2004.01.014. [DOI] [PubMed] [Google Scholar]
- 38.Hayes JS, et al. Visually guided performance of simple tasks using simulated prosthetic vision. Artif. Organs. 2003 Nov.27(11):1016–28. doi: 10.1046/j.1525-1594.2003.07309.x. [DOI] [PubMed] [Google Scholar]
- 39.Gollisch T, Meister M. Rapid neural coding in the retina with relative spike latencies. Science. 2008 Feb.319(5866):1108–11. doi: 10.1126/science.1149639. [DOI] [PubMed] [Google Scholar]
- 40.Kaas JH, et al. Reorganization of retinotopic cortical maps in adult mammals after lesions of the retina. Science. 1990 Apr.248(4952):229–231. doi: 10.1126/science.2326637. [DOI] [PubMed] [Google Scholar]