Action potentials have a central role in the nervous system and in many cellular processes, notably those involving ion channels, and the accurate measurement of action potentials requires efficient coupling between the cell membrane and the measuring electrodes. Intracellular recording methods, such as patch clamping, involve measuring the voltage or current across the cell membrane by accessing the cell interior with an electrode, allowing both the amplitude and shape of the action potentials to be recorded faithfully with high signal-to-noise ratios1. However, the invasive nature of intracellular methods usually limits the recording time to a few hours1, and their complexity makes it difficult to simultaneously record more than a few cells. Extracellular recording methods, such as multielectrode arrays2 and multitransistor arrays3, are noninvasive and allow long-term and multiplexed measurements. However, extracellular recording not only sacrifices the one-to-one correspondence between cells and electrodes but also suffers significantly in signal strength and quality. Extracellular techniques are not, therefore, able to record action potentials with the accuracy needed to explore the properties of ion channels. As a result, the pharmacological screening of ion-channel drugs is usually performed by low-throughput intracellular recording methods4. The use of nanowire transistors5-7, nanotube-coupled transistors8 and micro gold-spine and related electrodes9-12 can significantly improve the signal strength of recorded action potentials. Here we show that vertical nanopillar electrodes can record both the extracellular and the intracellular action potentials of cultured cardiomyocytes over a long period of time with excellent signal strength and quality. Moreover, it is possible to repeatedly switch between extracellular and intracellular recording by nanoscale electroporation and resealing processes. Furthermore, vertical nanopillar electrodes can detect subtle changes in action potentials induced by drugs that target ion channels.
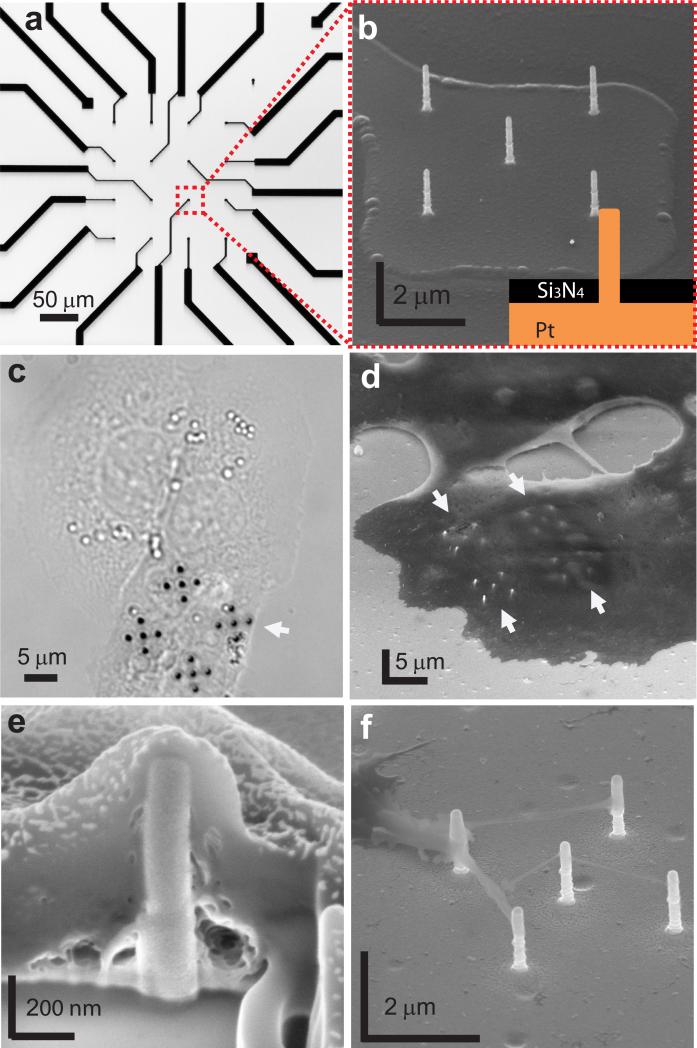
There are two major requirements for accurate recording of action potentials: (I) ensuring a tight seal between the cell membrane and the electrode so as to minimize signal loss to the bath medium, and (II) achieving low impedance across the cell-electrode interface so as to increase the signal collection efficiency. Recent years have seen demonstrations that vertical nanowires form strong interfaces with mammalian cells13-16. In this work, we show that vertically-aligned nanopillar electrodes (Fig. 1a and b) can induce tight junctions with mammalian cell membranes (requirement I) and can lower the impedance by orders of magnitude via localized electroporation (requirement II), thus achieving excellent signal strength and quality in long-term and minimally invasive both extracellular and intracellular recordings.
Figure 1. Nanopillar electrode devices and their interactions with HL-1 cardiomyocytes.
(a) An optical image of a nanopillar electrode device with 4-by-4 Pt pads and leads connected to recording amplifiers. (b) An SEM image of an array of five 150 nm-diameter, 1.5 μm-long vertical nanopillar electrodes on the Pt pad as shown in (a). Most of the nanopillar electrode surface is exposed for measuring cell electrophysiology but the rest of the pads and leads are electrically insulated by a 350 nm Si3N4/SiO2 layer. The footprint of the nanopillar electrode array on each pad is 5 × 5 μm2 or less. Inset shows schematics of fabricated pillar. (c) Optical image of HL-1 cells cultured on a glass coverslip with four 5-nanopillar electrode arrays without the underlying Pt pads. Cells growing on vertical nanopillar electrodes show similar morphology to those on planar areas. (d) An SEM image shows four 5-nanopillar electrode arrays covered by an HL-1 cell. Arrows indicate the locations of nanopillar electrodes. (e) The cell-nanopillar electrode interface exposed by FIB milling shows that the nanopillar electrode is fully engulfed by the cell. (f) An SEM image shows cellular protrudings reaching out to the nanopillar electrodes. All SEM images are taken at 52 degrees with respect to normal.
HL-1, a mouse cardiac muscle cell line17, cultured on the nanopillar electrodes shows normal growth and exhibits spontaneous beating after reaching confluence. We culture HL-1 cells around 150 nm diameter, 1.5 μm tall Pt nanopillar electrodes on glass coverslips without the underlying electrodes in order to examine their health by optical microscopy. Live imaging demonstrates that cardiomyocytes growing on the nanopillar electrodes show morphology similar to those on planar areas during rhythmic beating (Fig. 1c and Movie 1 in the Supplementary Information). Scanning electron microscopy (SEM) after cell fixation shows that the nanopillar electrodes are covered by the attached cell (Fig. 1d), a phenomenon similar to previously observed nanostructure-cell interactions9, 13, 14. To further inspect the cell-nanopillar electrode interface, we use focused ion beam milling to expose the interface cross section. Subsequent SEM imaging reveals that the nanopillar electrodes are engulfed tightly by the cell (Fig. 1e). Membrane protrudings from the cells that grow next to the nanopillar electrodes show a strong tendency to attach to the nanopillar electrodes (Fig. 1f), suggesting strong interactions between the nanopillar electrodes and the cell membrane. Our finding agrees with our previous study on the interaction between Pt nanopillars and primary cultured rat neurons15.
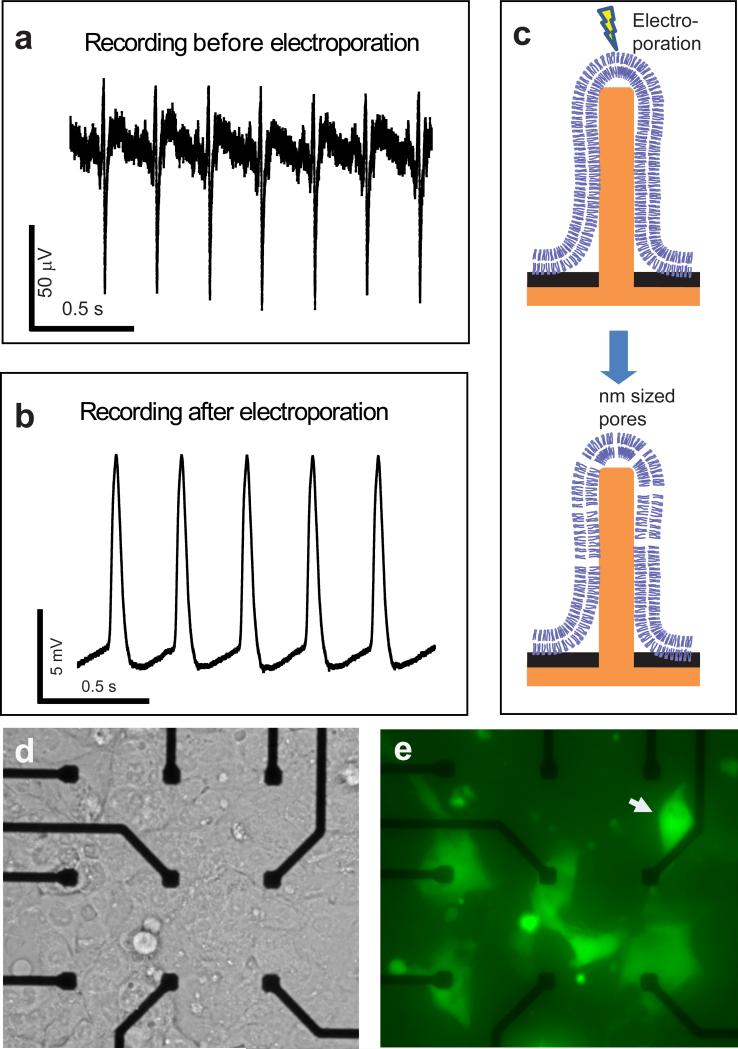
Assembled devices with the nanopillar electrode arrays (typically 9 nanopillars per array with underlying electrical connections) are then used to record action potentials from HL-1 cardiomyocytes. Fig. 2a shows that the action potential exhibits two signatures of extracellular recording: a derivative-shaped spike with amplitude about 100-200 μV. The peak-to-peak noise level is 30 μVpp and the signal-to-noise ratio is in the range of 4.5-9. For comparison, a typical commercial multielectrode array registers a noise level of 40 μVpp for 10 μm diameter and 10 μVpp for 30 μm diameter TiN electrodes and action potential signal strength of 100-500 μV (Multichannel Systems, Germany); nanowire field-effect transistors typically have a noise level of 2-3 mV and signal of 60 mV6. It is important to note that although the signal strength recorded by the nanopillar electrode arrays is similar to that measured by commercial planar multielectrode arrays, the surface area of a nanopillar electrode array (5-10 μm2) is much smaller than that of a multielectrode array electrode (400-2500 μm2)2. Due to the capacitive coupling nature of a solid state electrode, the detected signal strength directly correlates to the electrode's detection area. Our observation suggests that tight engulfment of the nanopillar electrodes by the cell membrane results in good sealing at the interface, and therefore compensates for the decreased electrode detection area.
Figure 2. Nanopillar electrode extracellular (intracellular) recording of action potentials of a single HL-1 cell before (after) electroporation.
(a) Before electroporation, the recorded train of action potentials shows extracellular signatures. (b) After electroporation, the recorded signal amplitude increases over 100 times and the shape exhibits intracellular features. (c) A schematic illustration of electroporation of the surrounding cell membrane by a nanopillar electrode. Voltage pulses create nanometer-sized pores on the cell membrane immediately surrounding the nanopillar electrode. The drawing is not to scale. (d, e) Nanopillar electroporation is confirmed by entry of membrane-impermeant calcein dye. (d) shows a bright field image of confluent HL-1 cells covering nine Pt pads. Of the nine Pt pads, the six pads in the second and third rows have nanopillar electrode arrays. To serve as a control, the three pads in the topmost row have only milled holes but no nanopillars. (e) The corresponding fluorescence image of the same area shows that calcein dye enters only those cells that contact the nanopillar electrodes. No electroporation is observed on the top three control pads. Dye entry to single cells on every electrode indicates that each nanopillar electrode array (each with 9 nanopillars) interfaces with only a single cell. The cell on the top right (white arrow) is off-site from the electrode, but its membrane protrusion extends to the nearest nanopillar electrode site as shown in higher contrast in Supplementary Fig. S2.
A transient electroporation drastically improves the quality of the nanopillar electrode-recorded signal by lowering the impedance across the interface. A high electric field can induce nanometer-sized pores in the cell membrane, as in the established in vitro technique of electroporation to introduce DNA or other molecules into cells18-20. Since our electrodes are sharp (<100 nm tip-radius) and tightly coupled to the membrane, they can create a large electric field with a small voltage to transiently and locally increase the permeability of cell membranes. Fig. 2b shows the recorded action potentials after the nanopillar electrodes deliver a train of 2.5 V, 200 μs biphasic pulses (20 pulses in 1 second) to an HL-1 cell. The recorded signal amplitude increases to 11.8 mV immediately after electroporation. The noise level of 30 μVpp is similar to extracellular recording ones, but the signal-to-noise ratio increases to 590 (Fig. 2b vs. Fig. 2a). In comparison, a typical current clamp recording has a noise level of 180 μVrms and signal strength of about 100 mV1. In addition to this 100-fold increase in the signal-to-noise ratio, our recorded action potentials reveal the intracellular attributes of a triangular shape and action potential duration at 50% of the maximum (APD50) of 30.8±0.2 ms. Immediately following each action potential, a clear refractory period is visible, which is characterized by a slow smooth transition from the maximum diastolic potential to the threshold for the initiation of the next action potential. The recorded action potential shape agrees well with patch clamping recording of HL-1 cells21. For a total of 32 devices and at least two cultures on each device, we observe intracellular recording after electroporation in every culture on every device.
Electroporation is confirmed by delivering membrane-impermeant calcein dye into the HL-1 cells with the same pulse sequence used to induce intracellular recording (Fig. 2d and 2e). Of the nine Pt pads shown in Fig. 2d (NPEs on the pads are not visible in this image taken by an inverted microscope), the six pads in the second and third rows have nanopillar electrode arrays. To serve as a control, the three pads in the topmost row have only milled holes to expose the Pt pads but no nanopillar electrodes. As shown in Fig. 2h, although the same pulse sequence is applied to all nine Pt pads, only those cells on the nanopillar electrode arrays experience electroporation and uptake the dye. Notably, not all permeabilized cells are located right on top of the nanopillar electrodes. The cell on the top right is off-site from the electrode, but like the cell shown in Fig. 1f, its membrane protrusion extends to the nearest nanopillar electrode site as shown in an image with higher contrast (Supplementary Fig. S2). It is important to note that nanopillar electrode electroporation causes minimal cell damage because relatively low voltage is applied and that the electroporation happens only in the membrane immediately surrounding each electrode, which is about 1 μm2 in area compared to the overall cell membrane area of about 1000 μm2.
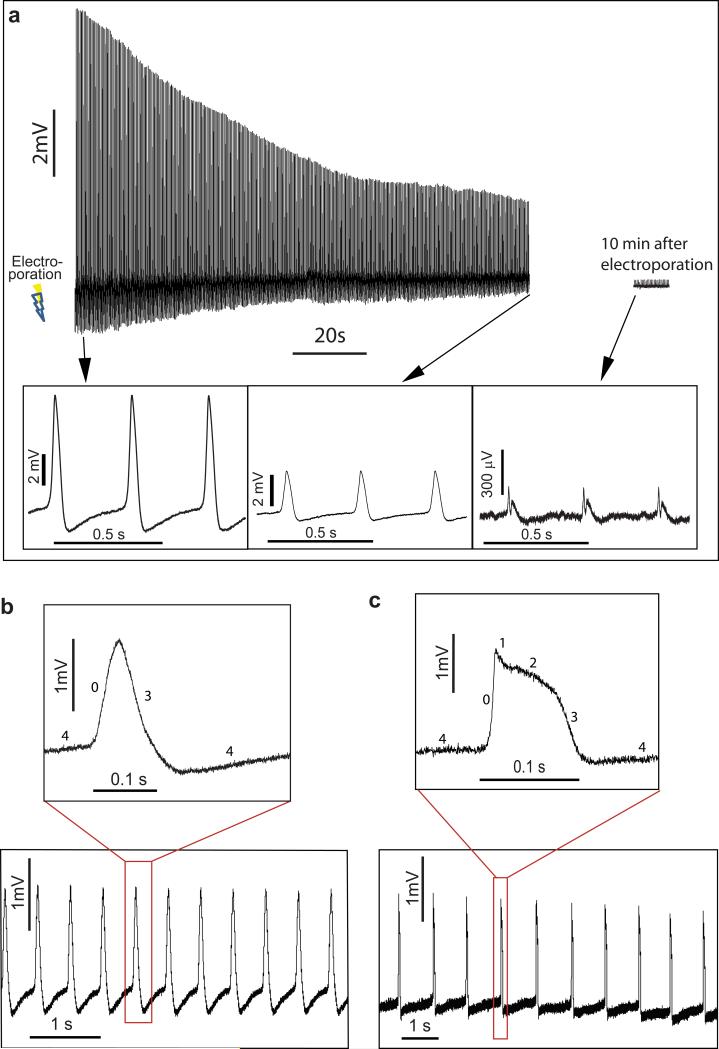
Nanopillar electrode intracellular recording after electroporation is not only minimally invasive but also provides details of HL-1 action potentials with high resolution. We observe that electroporation-generated pores seal within several minutes. Fig. 3a shows a 10-minute recording immediately after electroporation. The amplitude of the recorded action potential decays to 30% of its original amplitude after 120 seconds. However, during this period, the APD50 remains relatively constant (Supplementary Fig. S3). After 10 minutes, the recorded signal decays to ~200 μV and transitions back to extracellular features. The time scale for the pore sealing is comparable to that of recovery reported after electroporation of bulk suspended cells22. This observation further confirms that the recorded signal improvement is a direct result of electroporation. In addition, the high resolution recording allows us to possibly distinguish different types of cells in the same culture based on the shapes of their action potential. For example, the action potential shown in Fig 3b resembles that of pacemaker cells, while the action potential shown in Fig. 3c resembles that of non-pacemaker cells. The pacemaker cells have three phases with symmetric rising and falling edge. The slow rising edge is phase 0 attributed to increased inward Ca2+ conductance and the falling edge is phase 3 caused by K+ channel opening. In contrast, all five phases are present for non-pacemaker cells. The five phases represent, respectively, the opening of fast Na+ channels (depolarization phase 0), the transient outwards K+ channels (short repolarization phase 1), the slow inward Ca2+ channels (plateau phase 2), and the K+ channels (depolarization phase 3 and resting potential phase 4). The slow rising edge is phase 0 attributed to increased inward Ca2+ conductance and the falling edge is phase 3 caused by K+ channel opening.
Figure 3. Nanopillar electroporation of HL-1 cells is minimally invasive and allows intracellular measurement of action potentials with high precision.
(a) After electroporation, recorded action potential amplitude decays over time due to sealing of transient pores on the cell membrane. 120 seconds after electroporation, the amplitude decays to 30% of its maximum value, but APD50 remains constant during this period (see Supplementary Fig. S3). About 10 min after electroporation, the recorded signal approaches extracellular amplitude and shape. Three different segments of the recording are plotted for clarity. The sealing of the cell membrane indicates that the intracellular recording is only invasive over a very short period of time compared to the lifetime of the cell in the culture. Intracellular recording of action potentials of two types of HL-1 cells attributed to pacemaker (b) and non-pacemaker (c) based on their shapes. Although the recorded amplitude decays, all five phases of the non-pacemaker action potential can still be readily observed at 400 seconds after electroporation. In contrast, the pacemaker action potentials exhibit three phases with symmetric rising and falling edges. See main text for detailed description.
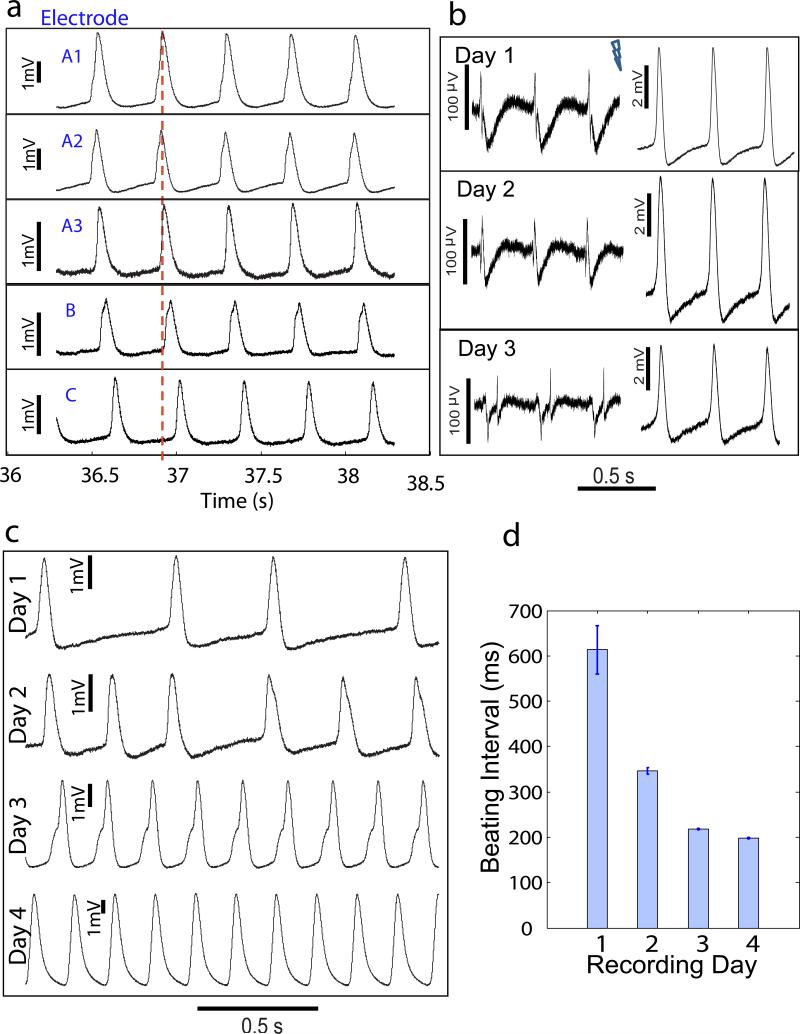
The high throughput and minimally invasive characters of nanopillar electrode intracellular recording allow repetitive recording on multiple cells in parallel over several consecutive days. Fig. 4a shows simultaneous intracellular recording with five different electrodes on the same culture. Electrodes A1, A2, and A3 are within 40 μm of each other, while electrodes B and C are separated by approximately 400 μm from each other and from electrodes A1-A3. Before reaching confluence over the whole culture, HL-1 cardiomyocytes form isolated patches. We observe that cells within the same patch (electrodes A1-A3) undergo synchronized beating, but there are time delays between cells in different patches (electrode B and C).
Figure 4. Parallel intracellular recording of multiple HL-1 cells on the same culture and monitoring of action potential evolution of single cells over consecutive days.
(a) Simultaneous intracellular recording with five different electrodes on the same culture before confluence. Electrodes A1, A2, and A3 are within 40 μm of each other, while electrodes B and C are separated by approximately 400 μm from each other and from electrodes A1-A3. Cardiomyocytes within a patch (electrodes A1-A3) undergo synchronized beating but there are time delays among cardiomyocytes in different patches (electrodes B and C). A dotted red line representing the same time is drawn to guide readers. (b) Extracellular (left) and intracellular (right) recording of a mature HL-1 cell over 3 consecutive days. Action potential shape and amplitude exhibit minimal changes. Note the vertical scale bar difference. (c, d) Intracellular recording of an HL-1 cell in a developing culture over four consecutive days. A transition from arrhythmic to rhythmic beating, an increase of beating frequency, a significant change in the action potential shape, along with an increase in recorded maximum action potential amplitude are observed. The first 23 action potentials recorded immediately after each electroporation are selected for analysis. Error bars represent one standard deviation spread of beating interval.
Fig. 4b shows recordings from a cell in a mature culture on three consecutive days before and after each electroporation. Although the amplitude of the recorded signal varies, the recorded action potential shape, duration at 50% of amplitude (APD50), and frequency remain relatively constant over the three day period. On the contrary, an HL-1 cell in a developing culture exhibits significant changes in both beating interval and action potential amplitude over the course of four days (Fig. 4c). The cell transitions from arrhythmic to rhythmic beating with increasing frequency (beating interval of 613.2 ± 53.6 ms on day 1 and 197.8 ± 0.5 ms on day 4) along with an increase in recorded maximum action potential amplitude (2.76 mV on day 1 and 9.49 mV on day 4).
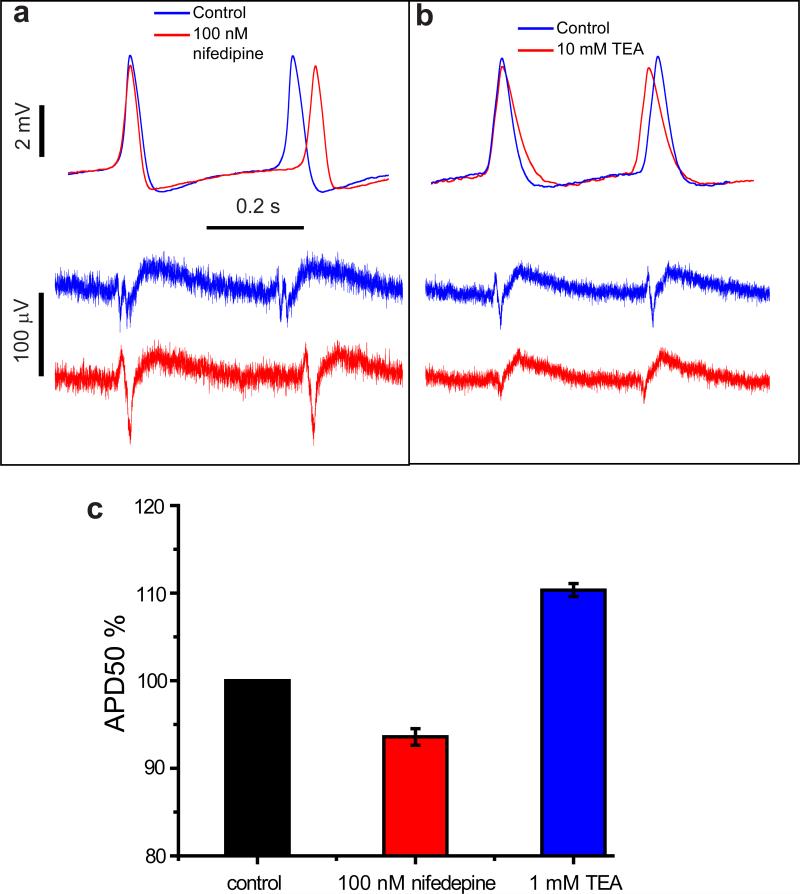
The highly detailed recording by the nanopillar electrodes after electroporation also allows us to examine the effect of ion-channel drugs on HL-1 action potentials. We demonstrate this capability as an example of potential drug screening applications by testing nifedipine, a Ca2+ channel blocker that would shorten action potentials, and tetraethylammonium, a K+ channel blocker that would lengthen action potentials23, 24, 25. For control experiments, we electroporate the cells to record action potentials in the absence of drugs. After the cells have recovered for a few hours, nifedipine or tetraethylammonium of different concentrations is added to the culture medium and the cultures are incubated for 10 min. Subsequently, another electroporation is applied to record the action potentials of drug-treated cells. As shown in Fig. 5, nanopillar electroporation recording reveals subtle changes in the shape, duration, and frequency of action potentials. 100 nM nifedipine treatment clearly decreases the duration of the action potential (quantified by the APD50) as well as increases the period of action potentials. 10 mM tetraethylammonium treatment shows the opposite effect, increasing APD50 and decreasing the period of action potentials. For either drug, the effects on APD50 and action potential period are enhanced with increasing concentration (Supplementary Fig. S4). Although the shapes of recorded action potentials vary from cell to cell, the drug effect is reliably detected because we are recording from the same cell before and after drug application (Supplementary Table 1 and 2).
Figure 5. Effect of ion-channel blocking drugs on HL-1 cells revealed by nanopillar intracellular recording after electroporation.
With Ca2+ channel blocker nifedipine (a) and K+ channel blocker tetraethylammonium (b) administered to HL-1 cells, intracellular action potential recordings by the nanopillar electrodes (top) reveal changes in both action potential duration and period with much higher clarity than extracellular recordings (bottom). Control and drug-administered recordings are overlaid at the rising edges of the first action potential for comparison. Note the difference in vertical scale bars. (c) Statistics of nifedipine and tetraethylammonium effects on percentage change of APD50 of HL-1 cells. For each drug, 4 different HL-1 cells on 3 different cultures are measured. Note the y-axis ranges from 80% to 120% of normalized APD50. See Supplementary Table 1 and 2 for details.
With the advantages of long-term measurement, high sensitivity, and minimal invasiveness, vertical nanopillar electrode recording offers many potential applications including basic biomedical research (for example, investigating how the electrophysiology of individual cells evolves during cell development) and pharmaceutical screening. Moreover, unlike existing recording techniques, arrays of nanopillar electrodes arrays can be used to mechanically pin down mammalian cells15, which should allow targeted cells to be measured without chemical or biological labels.
Supplementary Material
Acknowledgements
The HL-1 cardiac cell line is obtained from Dr. William C. Claycomb at Louisiana State University. This work is supported by NSF CAREER award 1055112, NIH grant NS057906, Searle Scholar award and Packard Science and Engineering Fellowship to B.C. Z. L. is supported by National Defense Science and Engineering Graduate Fellowship.
Methods
Chemicals and reagents
Four-inch quartz wafers are purchased from Hoya Optics (Santa Clara, CA). Cr etchant CR14 is bought from Transene Inc. (Danvers, MA). All reagents used for cell culture, including gelatin, fibronectin, Claycomb medium, fetal bovine serum, norepinephrine, L-glutamine, penicillin, and streptomycin, are purchased from Sigma-Aldrich (St Louis, MO). Ion channel drugs, nifedipine and tetraethylammonium, are also bought from Sigma-Aldrich. SEM sample preparation supplies such as glutaraldehyde, sodium cacodylate buffer, and osmium tetroxide, are bought from Ted Pella (Redding, CA). RTV108 silicone glue is from Momentive (Columbus, OH).
Nanopillar Electrode Device Fabrication and Characterization
A four-inch quartz wafer is diced into 20×20 mm2 pieces and each piece is patterned with 4-by-4 electrode (Pt/Ti 100nm/10nm) leads and pads using standard photolithography methods. The custom-designed electrode pattern is shown in Fig 1a and Supplementary Fig S1a. The substrate surface is subsequently passivated with a 350 nm Si4N3/SiO2 layer deposited by plasma enhanced chemical vapor deposition. After coating of 5 nm Cr, a focused Ga ion beam is used to mill 250 nm-diameter holes through the insulation layer to reach the Pt pads underneath (FEI Strata DB 235). Vertical nanopillar electrodes are then created from the holes by FIB-assisted Pt and therefore electrically connected with the Pt pads underneath the insulation layer. For each Pt pad, 1-10 nanopillar electrodes are constructed. The size of each nanopillar electrode is about 150-200 nm in diameter and 1-2 μm in height. After nanopillar electrode fabrication, the Cr layer is removed by CR14 so the substrate is transparent except for electrode-covered areas. The electrical impedance of a finished chip in Claycomb culture medium is measured with an Agilent B1500A parameter analyzer, and shown to decrease as the number of nanopillar electrodes increase (Supplementary Fig. S5). A plastic chamber is glued onto the center of the chip using RTV108 silicone glue for cell culture purposes. The device is finished by mounting the chip on a custom-designed printed circuit board and electrically connecting by wire bonding (Supplementary Fig. S1).
HL-1 Cell Culture and Optical Imaging
HL-1 cardiomyocyte cell line was obtained from Dr. William C. Claycomb's lab at Louisiana State University. Before plating, the nanopillar electrode device is cleaned with detergent and DI water, followed by 5 minutes of oxygen plasma treatment. The culture chamber is coated with 5 μg/ml fibronectin in 0.02% gelatin solution overnight to facilitate cell attachment17. HL-1 cells are then plated inside the chamber at a density of about 105/cm2 and maintained in the Claycomb medium supplemented with 10% fetal bovin serum, 0.1 mM norepinephrine, 2 mM L-glutamine, and 100 U/ml penicillin and 100 μg/ml streptomycin. The cells are maintained in a standard incubator at 37°C and 5% CO2. Medium is changed every 24 hrs. A typical HL-1 cell culture reaches confluence in 4-5 days after plating and exhibits spontaneous and synchronous beating, which can be observed on a Leica DM6000 inverted microscope (Supplementary Movie). Fluorescent imaging of calcein dye is performed with a 470 nm excitation filter and a 525 nm emission filter.
SEM/FIB Sample Preparation
HL-1 cells cultured on the nanopillar electrodes are fixed with 2% glutaraldehyde and 4% paraformaldehyde in 0.1 M cacodylate buffer (pH 7.3), washed in the same buffer, and post-fixed with 1% osmium tetroxide. After washing twice in DI water, the sample is dehydrated by successive exchanges to increasing concentrations of ethanol (50%, 70%, 90%, and 100%). The sample in 100% ethanol is dried with liquid CO2 in a critical point drier, which preserves cell morphology during the drying step. Prior to SEM imaging, the sample is sputter coated with a 2 nm Au layer to improve conductance. The sample is imaged using a FEI Strata 235B dual-beam SEM/FIB system that combines high resolution SEM imaging and FIB milling. To expose the cell-nanopillar electrode interface, a cell-covered nanopillar electrode is first located under SEM, and FIB is used to create submicron vertical dissection at the desired locations.
Electrophysiology Measurement
A 60-channel voltage amplifier system (Multichannel System, MEA1060) is used for recording HL-1 cells cultured on nanopillar electrode arrays (9 nanopillars per array) after cells start beating. Recording is performed in the same culture medium at 37 °C and a Ag/AgCl electrode in the medium as the reference electrode. The amplification is typically 110 for intracellular recording or 1100 times for extracellular recording and the sampling rate is 5-20 kHz. Signal is filtered with band-pass of 1 Hz - 5 kHz. For electroporation, 20 biphasic pulses of 2.5Vamp are applied to a nanopillar electrode in a total time of 1 second. The recording system is blanked during the electroporation period. Electrophysiology recordings are resumed 20-40s after the electroporation to avoid amplifier saturation.
Footnotes
Author contributions
All the authors conceived the experiments. C.X., Z.L. and L.H. carried out experiments. All the authors contributed to the scientific planning, discussions, and manuscript writing.
Additional information
Supplementary information accompanies this paper at www.nature.com/naturenanotechnology. Reprints and permission information is available online at http://npg.nature.com/reprintsandpermissions/.
References
- 1.Sakmann B, Neher E. Single-channel recording. Edn. 2nd. Springer; New York, NY: 2009. [Google Scholar]
- 2.Pine J. Recording action potentials from cultured neurons with extracellular microcircuit electrodes. J Neurosci Methods. 1980;2:19–31. doi: 10.1016/0165-0270(80)90042-4. [DOI] [PubMed] [Google Scholar]
- 3.Lambacher A, et al. Electrical imaging of neuronal activity by multi-transistor-array (MTA) recording at 7.8 mu m resolution. Applied Physics a-Materials Science & Processing. 2004;79:1607–1611. [Google Scholar]
- 4.Zheng W, Spencer RH, Kiss L. High throughput assay technologies for ion channel drug discovery. Assay Drug Dev Technol. 2004;2:543–552. doi: 10.1089/adt.2004.2.543. [DOI] [PubMed] [Google Scholar]
- 5.Timko BP, et al. Electrical recording from hearts with flexible nanowire device arrays. Nano Lett. 2009;9:914–918. doi: 10.1021/nl900096z. [DOI] [PMC free article] [PubMed] [Google Scholar]
- 6.Tian B, et al. Three-dimensional, flexible nanoscale field-effect transistors as localized bioprobes. Science. 2010;329:830–834. doi: 10.1126/science.1192033. [DOI] [PMC free article] [PubMed] [Google Scholar]
- 7.Qing Q, et al. Nanowire transistor arrays for mapping neural circuits in acute brain slices. Proc Natl Acad Sci U S A. 2010;107:1882–1887. doi: 10.1073/pnas.0914737107. [DOI] [PMC free article] [PubMed] [Google Scholar]
- 8.Duan X, et al. Intracellular recordings of action potentials by an extracellular nanoscale field-effect transistor. Nat Nanotechnol. 2011 doi: 10.1038/nnano.2011.223. [DOI] [PMC free article] [PubMed] [Google Scholar]
- 9.Hai A, Shappir J, Spira ME. In-cell recordings by extracellular microelectrodes. Nat Methods. 2010;7:200–202. doi: 10.1038/nmeth.1420. [DOI] [PubMed] [Google Scholar]
- 10.Hai A, Shappir J, Spira ME. Long-term, multisite, parallel, in-cell recording and stimulation by an array of extracellular microelectrodes. J Neurophysiol. 2010;104:559–568. doi: 10.1152/jn.00265.2010. [DOI] [PubMed] [Google Scholar]
- 11.Braeken D, et al. Local electrical stimulation of single adherent cells using three-dimensional electrode arrays with small interelectrode distances. Conf Proc IEEE Eng Med Biol Soc. 2009;2009:2756–2759. doi: 10.1109/IEMBS.2009.5333871. [DOI] [PubMed] [Google Scholar]
- 12.Choi DS, et al. Detection of neural signals with vertically grown single platinum nanowire-nanobud. J Nanosci Nanotechnol. 2009;9:6483–6486. doi: 10.1166/jnn.2009.1462. [DOI] [PubMed] [Google Scholar]
- 13.Kim W, Ng JK, Kunitake ME, Conklin BR, Yang P. Interfacing silicon nanowires with mammalian cells. J Am Chem Soc. 2007;129:7228–7229. doi: 10.1021/ja071456k. [DOI] [PubMed] [Google Scholar]
- 14.Shalek AK, et al. Vertical silicon nanowires as a universal platform for delivering biomolecules into living cells. Proceedings of the National Academy of Sciences of the United States of America. 2010;107:1870–1875. doi: 10.1073/pnas.0909350107. [DOI] [PMC free article] [PubMed] [Google Scholar]
- 15.Xie C, et al. Noninvasive neuron pinning with nanopillar arrays. Nano Lett. 2010;10:4020–4024. doi: 10.1021/nl101950x. [DOI] [PMC free article] [PubMed] [Google Scholar]
- 16.Xie C, Hanson L, Cui Y, Cui B. Vertical nanopillars for highly localized fluorescence imaging. Proc Natl Acad Sci U S A. 2011;108:3894–3899. doi: 10.1073/pnas.1015589108. [DOI] [PMC free article] [PubMed] [Google Scholar]
- 17.Claycomb WC, et al. HL-1 cells: a cardiac muscle cell line that contracts and retains phenotypic characteristics of the adult cardiomyocyte. Proc Natl Acad Sci U S A. 1998;95:2979–2984. doi: 10.1073/pnas.95.6.2979. [DOI] [PMC free article] [PubMed] [Google Scholar]
- 18.Zimmermann U, Pilwat G, Riemann F. Dielectric breakdown of cell membranes. Biophys J. 1974;14:881–899. doi: 10.1016/S0006-3495(74)85956-4. [DOI] [PMC free article] [PubMed] [Google Scholar]
- 19.Neumann E, Schaeferridder M, Wang Y, Hofschneider PH. Gene-Transfer into Mouse Lyoma Cells by Electroporation in High Electric-Fields. Embo Journal. 1982;1:841–845. doi: 10.1002/j.1460-2075.1982.tb01257.x. [DOI] [PMC free article] [PubMed] [Google Scholar]
- 20.Chang DC, Reese TS. Changes in membrane structure induced by electroporation as revealed by rapid-freezing electron microscopy. Biophys J. 1990;58:1–12. doi: 10.1016/S0006-3495(90)82348-1. [DOI] [PMC free article] [PubMed] [Google Scholar]
- 21.Sartiani L, Bochet P, Cerbai E, Mugelli A, Fischmeister R. Functional expression of the hyperpolarization-activated, non-selective cation current I(f) in immortalized HL-1 cardiomyocytes. J Physiol. 2002;545:81–92. doi: 10.1113/jphysiol.2002.021535. [DOI] [PMC free article] [PubMed] [Google Scholar]
- 22.Tovar O, Tung L. Electroporation and recovery of cardiac cell membrane with rectangular voltage pulses. Am J Physiol. 1992;263:H1128–1136. doi: 10.1152/ajpheart.1992.263.4.H1128. [DOI] [PubMed] [Google Scholar]
- 23.Zipes DP, Jalife J. Cardiac electrophysiology : from cell to bedside. Edn. 4th. Saunders; Philadelphia: 2004. [Google Scholar]
- 24.Catterall WA. Structure and function of voltage-sensitive ion channels. Science. 1988;242:50–61. doi: 10.1126/science.2459775. [DOI] [PubMed] [Google Scholar]
- 25.Choi KL, Aldrich RW, Yellen G. Tetraethylammonium blockade distinguishes two inactivation mechanisms in voltage-activated K+ channels. Proc Natl Acad Sci U S A. 1991;88:5092–5095. doi: 10.1073/pnas.88.12.5092. [DOI] [PMC free article] [PubMed] [Google Scholar]
Associated Data
This section collects any data citations, data availability statements, or supplementary materials included in this article.


