

Abstract
There is a growing public concern over the potential accumulation of heavy metals in soil, owing to rapid industrial development. In an effort to describe the status of the pollutions of soil by industrial activities, relevant data sets reported by many studies were surveyed and reviewed. The results of our analysis indicate that soils were polluted most significantly by metals such as lead, zinc, copper, and cadmium. If the dominant species are evaluated by the highest mean concentration observed for different industry types, the results were grouped into Pb, Zn, Ni, Cu, Fe, and As in smelting and metal production industries, Mn and Cd in the textile industry, and Cr in the leather industry. In most cases, metal levels in the studied areas were found to exceed the common regulation guideline levels enforced by many countries. The geoaccumulation index (I geo), calculated to estimate the enrichment of metal concentrations in soil, showed that the level of metal pollution in most surveyed areas is significant, especially for Pb and Cd. It is thus important to keep systematic and continuous monitoring of heavy metals and their derivatives to manage and suppress such pollution.
1. Introduction
Industrial pollution has been and continues to be a major cause of environmental degradation. Numerous studies have already demonstrated that areas in close proximity to industrial activities are marked by noticeable contamination of air, soil, and water [1–3]. Hence, such activities can affect the air we breathe, the water we use, and the soil we stand on and can ultimately lead to illness and/or harm to the residents in the affected area.
Among various toxic substances released by industrial activities, heavy metals have been seen as a key marker because they may be analysed effectively and consistently in most environmental matrices. Unlike organic pollutants which may degrade to less harmful components as a result of biological or chemical processes, metals are not degradable by natural processes especially when elemental metallic content is considered [4]. The effects of metal pollution on local environments and organisms may therefore be substantial and long lasting in spite of extensive remediation efforts [4]. In fact, lead, cadmium, copper, manganese, and so forth have been commonly chosen as representative metals for which their concentrations in the environment may be used as reliable indices of environmental pollution [5].
In most parts of the world, large quantities of trace metals are directly discharged to nearby land and into surface waters. This activity adversely affects the quality of air, soil, and ground water, such that it becomes a subject of serious concern worldwide [6–8]. In recent years, many governments and policy makers have continued to strive for a more comprehensive understanding of environmental health hazards due to intensive industrial activities in order to inform future policy and abatement legislation [9]. In this paper, we intend to provide the results of a review of a survey of environmental pollution caused by industrial activities. Through an in-depth analysis of basic methodologies and relevant databases, we provide some insights into the fundamental aspects of metal pollution associated with industrial activities with a major emphasis on the soil matrix.
2. Status of Data Availability of Metal Pollution between Different Criteria: Matrix Types (Air, Soil, and Water) and Industry Types
During the past few decades, industrial activities have increased greatly around the world with rapid economic growth. This has been accompanied by severe environmental pollution. Many studies have been carried out to evaluate the status of industrial pollution and its environmental impacts in a broad and aggregative manner. There are, however, very few studies that describe the impact of such pollution with respect to the spread of key pollutants across various environmental media. In order to build a database to assess the basic features of heavy metal pollution due to industrial activities, we conducted a literature survey of major articles dealing with this topic that have been published since 1996 (a total of 61 references). If these metal pollution data are sorted by matrix type, 42 of the articles dealt with the soil phase. The remaining ones dealt with the air (11) and water (8) phases. As the classification of the data sets surveyed is important, we used criteria provided by the International Standard Industrial Classification (ISIC) division of the United Nations (Table 1) [10]. The literature reviewed was chosen so as to provide a representative sample across industries, geographic area, and measured concentrations. It covered a range of industries including smelters, mining and metal (ME + MI), chemical and petrochemical (CE + PE), tannery (LE), ceramic and cement (NM), textile (TA), and industrial complexes (containing multiple generic process) (IC) of the studies in each category numbering 17, 7, 4, 3, 2, and 8, respectively. In case of air (n = 11), four case studies were mainly conducted near chemical and petrochemical (CE + PE) types, while all others concerned various industrial complexes (n = 7). Metal pollution in the water phase was investigated mainly in the brewery (BE = 4), tannery (LE = 2), and textile industries (TE = 2 cases). Figure 1 shows the frequency of data availability for this survey as a function of industry type and between the different media.
Table 1.
Classification of industry types for the analysis of soil metal pollution: the International Standard Industrial Classification (ISIC) codes.
| Order | Section | Division | Short mane | Groups | Industry Codea |
|---|---|---|---|---|---|
| 1 | Manufacturing | Beverages | BE | Beverages | 110 |
| 2 | Textiles | TE | Spinning, weaving, and finishing of textiles | 131 | |
| 3 | Other textiles | 139 | |||
| 4 | Leather and related products | LE | Tanning and dressing of leather, luggage, handbags, saddlery and harness, dressing, and dyeing | 151 | |
| 5 | Paper and paper products | PA | Paper and paper products | 170 | |
| 6 | Coke and refined petroleum products | Refined petroleum products | 192 | ||
| 7 | Chemicals and chemical products | CE | Chemicals, fertilizers and nitrogen compounds, plastics, and synthetic rubber in primary forms | 201 | |
| 8 | Pharmaceutical products and pharmaceutical preparations | PH | Pharmaceuticals, medicinal chemical, and botanical products | 210 | |
| 9 | Nonmetallic mineral products | NM | Glass and glass products | 231 | |
| 10 | Nonmetallic mineral products | 239 | |||
| 11 | Metals | ME | Iron and steel industry | 241 | |
| 12 | Precious and other nonferrous metals industry | 242 | |||
| 13 | Machinery and equipment | MA | General-purpose machinery | 281 | |
| 14 | Electrical equipment | BA | Batteries and accumulators | 272 | |
| 15 | Transport equipment | TR | Building of ships and boats | 301 | |
| 16 | Furniture | FU | Furniture | 310 | |
|
| |||||
| 17 | Mining and quarrying | Extraction of crude petroleum and natural gas | PE | Extraction of crude petroleum | 061 |
| 18 | Mining of metal ores | MI | Mining of iron ores | 071 | |
| 19 | Mining of non-ferrous metal ores | 072 | |||
aSource: ISIC Rev. 4 structure (2008, United Nations Statistics Division) [10].
Figure 1.
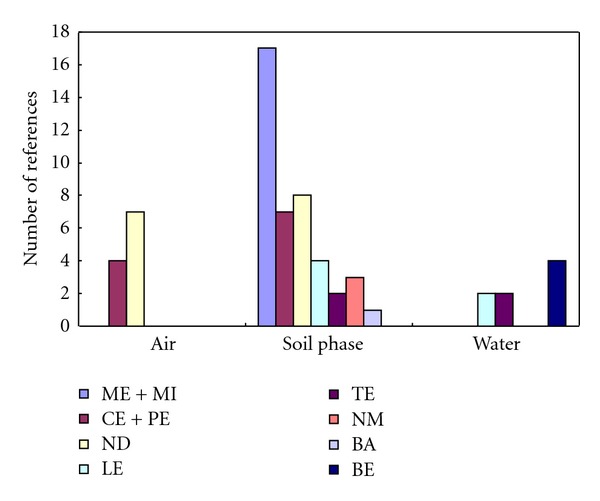
Source frequency of soil metal pollution data across different environmental matrices and with respect to different industry types (n = 61 references for comparison: refer to Table 1 for acronyms).
3. Comparison of Experimental Approaches for Data Acquisition
3.1. Sampling
In this study, considering the availability of data, our analysis concentrated on the soil matrix. In this respect, we analyzed the basic methodological approaches employed for data acquisition in all the selected references. Based on this analysis, we evaluated the fundamental features of metal pollution in soil layers resulting from industrial activities. The basic information concerning the methodologies for sampling, sample treatment, and analysis for metal content is summarized in Table 2. In order to investigate the metal load onto soil, the distance between the sampling sites and the emission sources is a critical parameter. In general, there is a progressive decrease of metal concentrations with increasing distance from the source. Most of the studies reported soil sampling within a radius of 50 m to 2 km from industrial sources [15, 23, 30]. The collection of soil samples has commonly been made by random sampling [11] or grid sampling [14]. As seen in Table 2, grid sampling based on 1 km × 1 km squares has been adopted most commonly in many of these studies [12, 16, 22]. There are, however, some exceptions like the use of 20 m × 20 m grids (e.g. [28]). Most of the studies considered employing vertical sampling in the range of 0–5 cm [11] to 0–20 cm [33]. Soil samples were typically collected with a stainless steel spatula or auger and kept in PVC packages until analysis.
Table 2.
Sampling and analytical procedures of metals in soil matrix reported between different studies.
| Order | Study area | No. of samples | Sample collection method | Method Instrument | Reference | |||
|---|---|---|---|---|---|---|---|---|
| Period | Soil depth (cm) | Grid | Reference materials used | |||||
| 1 | Albania | 21 | Jul ‘95 | 0–15 | — | ICP-AES | CRMs-BCR 142R | [11] |
| 2 | Algeria | 119 | Jan-Feb ‘06 | — | 1 × 1 km | FAASa, GFSb | CRM 141 R, SRM 2709 SJS | [12] |
| 3 | Australia | 25 | Dec ‘00–Feb ‘01 | 0–5 and 5–20 | — | ICP-MS | CRMs-AGAL 10, AGAL 11 | [13] |
| 4 | Belgium | 27 | ‘93–‘98 | 0–20 | 10 m interval | ICP-MS, ICP-AES | CRMs-SRM2710, GBW07411, | [14] |
| GBW07311 & SRM1633 | ||||||||
| 5 | Bulgaria | 14 | Jun ‘04 | — | — | XRF | — | [15] |
| 6 | Kosovo | 82 | Jun–Nov ‘02 | — | 1×1 km | XRF, ICP-MS | CRMs-BR, DR-N, GH, DTS-1, | [16] |
| SDO-1, AGV-2, NIST 2709, 2710 | ||||||||
| 7 | Greece | 30 | ‘93–‘94 | — | — | INAAc & AAS | IAEA SOIL-7, Pepperbush SRM | [17] |
| 8 | Italy | 280 | — | 0–5 | — | ICP-MS | — | [18] |
| 9 | Jordan | 3 | Sept ‘03 | 0–20 and 20–40 | — | AAS | — | [19] |
| 10 | Peru | 6 | — | 0–10 | — | ICP-ES | — | [20] |
| 11 | Slovenia | 40 | — | 0–25 | — | FAAS | WEPAL 2004.3.3 | [21] |
| 12 | UK | 70 | — | 0–15 | 1 km interval | FAAS | — | [22] |
| 13 | Bangladesh | 53 | Nov ‘95 | 0–5 and 5–15 | — | AAS | — | [23] |
| 14 | India | 30 | ‘02–‘04 | — | — | XRF | SO-1, SO-2, SO-3, SO-4, NGRI-D, | [24] |
| NGRI-U | ||||||||
| 15 | Spain | 24 | Winter ‘07 | 0–5 | — | ICP-MS & AAS-GF | CRM 052 | [25] |
| 16 | Spain | 27 | Winter ‘05 | 0–3 | — | ICP-MS | Lobster hepatopancreas | [26] |
| 17 | Turkey | 29 | Sep ‘03 | — | — | FAAS | SRM - BCR-701 | [27] |
| 18 | China | 50 | — | 0–10 | 20 m × 20 m | XRF | GSS, GRS, GSD, SO-1, NIST-2709, | [28] |
| NIST-2710, NIST-2711 | ||||||||
| 20 | Jordan | 31 | — | 0–10 and 10–20 | — | AAS | NBS SRMs | [29] |
| 21 | Pakistan | 38 | Oct ‘03–Dec ‘03 | 1–5 | — | AAS | SRM-SR-96 | [30] |
| 22 | Serbia | 59 | Jun ‘99–Mar ‘00 | 0–5 | — | FAAS | — | [31] |
| 23 | Damascus | 51 | Summer ‘98 | 0–20 | — | FAAS | — | [32] |
aFAAS—Flame atomic absorption spectrometer.
bGFS—Graphite furnace spectrometry.
cInstrumental Neutron Activation Analysis with gamma-ray spectroscopy.
The metal data in soils derived from random and grid sampling are often used to represent an entire area. In this respect, grid sampling can be particularly useful when prior knowledge of the likely spatial variability is limited. This technique also avoids any sampling bias that could result from the collection of an unrepresentative average sample as a result high portion of subsamples from the same region. Two subtypes of grid sampling such as gridcell and gridpoint have commonly been employed (e.g., [34]).
3.2. Sample Preparation
Soil samples were commonly dried at room temperature and sorted via sieving (e.g., using a 2 mm sieve). They were then mineralized in a single acid like HNO3 within Teflon bombs in a microwave digester [12]. In many studies, however, authors preferred to use mixtures of various acids like (1) HCl, HNO3, and H2O2 ([11], (2) HCl, HNO3, and HF [14], (3) HCl, HNO3, HF, and HClO4 [16], (4) HCl, HF, and HClO4 [22], and (5) aqua regia [33]). Reagent blanks and standard reference soil samples were also analyzed to reduce experimental biases and properly validate each extraction method [33]. The digestion procedure used will depend on the species in the soil requiring digestion and the final analytical step. For instance, chromates may require more extreme digestion conditions, such as HF, to properly dissolve the chromium present. However, analysis techniques such as ICP-MS prefer final solutions with relatively low ionic contents and so HF (subsequently neutralized with HBO3) may cause instrumental drift during analysis [13].
3.3. Instrumental Detection
Flame/atomic absorption spectrometer (FAAS/AAS) is the dominant technique employed for metal analysis in soil [19, 22, 23, 27, 32]. In FAAS, either an air/acetylene or a nitrous oxide/acetylene flame is used to evaporate the solvent and dissociate the sample into its component atoms. The atoms of interest absorb light from a hollow cathode lamp (selected for the target element) as it passes through the cloud of atoms produced by the atomization process. The amount of absorbed light is measured and used to calculate the concentration of each metal of interest. Compounds of the alkali and transition metals can all be atomized with good efficiency yielding typical FAAS detection limits in the sub-ppm range.
AAS is also used in combination with a graphite furnace (GF) mode—known as GF-AAS [12, 25]. It is essentially the same as flame AA, except the flame is replaced by a small, electrically heated graphite tube, or cuvette, which is heated up to 3000°C to generate the cloud of atomized sample. The higher atom density and longer residence time in the tube yield improved detection limits (DLs) for GF-AAS in the sub-ppb range, which is by 3 orders of magnitude superior to flame AAS. However, because of the temperature limitation and the use of graphite cuvettes, the analytical performance for refractory elements is still somewhat limited. The techniques also exhibit a lower throughput than many of the more recent mass spectrometry (MS) techniques; this is because it is only able to determine one element at a time, unlike MS methods which can determine a range of elements at once.
Many authors have also used inductively coupled plasma with mass spectrometry (ICP-MS) or atomic emission spectrometry (ICP-AES) for the simultaneous analysis of multiple metals [14, 16, 20, 33]. For ICP/ICP-AES analysis, the system uses temperatures as high as 10,000°C to atomize even the most refractory elements with high efficiency. As a result, DLs for these systems can be orders of magnitude lower (typically at the 1–10 parts-per-billion level) than FAAS techniques. The ICP method can simultaneously screen for up to 60 elements in a single sample run of less than one minute, without any degradation of precision or detection limits. If run in a “sequential mode” ICPs can provide analytical results for about five elements per minute [35].
ICP-MS is a multielement technique that also uses an ICP plasma source to dissociate the sample into its constituent atoms or ions [35]. However, in this case, detection focuses on the ions themselves rather than the light that they emit. The ions are extracted from the plasma and passed into the mass spectrometer, where they are separated based on their atomic mass-to-charge ratio by a quadrupole or magnetic sector analyzer. In terms of DLs, ICP-MS can produce the best results (typically 1–10 ppt), followed by GF AAS (usually in the sub-ppb range), ICP-AES (of the order of 1–10 ppb), and FAAS (in the sub-ppm range). Being a mass spectrometric technique, ICP-MS also enables quantification by isotope dilution strategies for poly-isotopic elements, which can produce highly accurate results. However, mass spectrometric techniques may also suffer from isobaric mono- and polyatomic interferences which unless properly corrected can bias results [36].
Nondestructive methods for analysis such as X-ray fluorescence (XRF) and instrumental neutron activation analysis (INAA) have also been used commonly in many recent studies [16, 17, 24, 28]. In INAA, the sample is bombarded with neutrons, causing the elements to form radioactive isotopes. As the radioactive emissions and radioactive decay paths for each element are well known, one can determine the concentrations of the elements based on the information of spectral emission. This type of application is highly advantageous in that it does not destroy the sample and is generally matrixindependent, although often very difficult to calibrate accurately.
3.4. Quality Assurance (QA)
QA procedures are made to ensure that the approach is properly validated, under control at all stages, and employed appropriately. Validation of analytical methodologies via the measurement of matrix-certified reference materials is good examples of a necessary QA activity. Another important performance criteria in QA/QC is the method detection limit (MDL). The MDL is usually defined as the lowest quantity or concentration of a component that can be reliably detected for a given analytical method [55].
Standard reference materials (SRMs—generally NIST in the USA) or certified reference materials (CRMs—the term used by most other National Measurement Institutes (NMIs)) are materials used to check the quality and traceability of results and can be divided into two categories: calibrants and matrix RMs (as mentioned above). The former is mono- or multielemental standard solutions used for calibrating instruments and ensuring traceability in measurement results, while the latter is a material of a similar matrix to the sample being analyzed which has been certified for homogeneity and its content of relevant analytes (e.g., lead in dust). Matrix RMs are used for method validation, rather than for calibration.
Most of the reference materials used in soils have been formulated by several NMIs like National Institute of Standards and Technology (NIST), USA, Institute for Reference Materials and Measurements (IRMM, Belgium), and so forth. In the industrial soils of Baoji city, China, soil standards NIST-2709, 2710, and 2711 were used along with Canadian certified reference materials such as SO-1, 2, 3, and 4 [28]. In the industrial regions of Kayseri, Turkey, BCR-701 was reported as a method validation tool [21]. Two certified reference materials, CRM 141 R and SRM 2709 SJS, were also used to develop method for the urban soils of Algeria [12] while in the industrial soils of Kosovo, CRMs in rock forms (BR, DR-N, and GH) produced by Centre National de la Recherche Scientifique, CRNS (Notre Dame des Pauvres, France), and DTS-1, SDO-1, and AGV-2 produced by the United States Geological Survey, USGS (Denver, Colorado, USA) have been employed to develop suitable analytical methods [16].
4. In Depth Analysis of Soil Metal Pollution by Industry Types
As one of the major indices of environmental pollution, trace element concentration data in the soil phase affected by industrial activities complied in this study is listed in Table 3. The comparable data sets for the air and water, although much more limited relative to soil matrix, are also provided in Table 4. In light of differences in the relative abundance of metal pollution data between these different matrices, we conducted a detailed analysis of the impact of industrial activities on environmental metal pollution by focusing mainly on soil media.
Table 3.
Summary of trace element concentrations in soils affected by diverse industrial activities.
| Order | Industry type | Industry group short namea | ISIC industry codea | Location | Trace element concentration (mg kg−1) | Reference | |||||||||
|---|---|---|---|---|---|---|---|---|---|---|---|---|---|---|---|
| City | Country | Pb | Zn | Mn | Ni | Cn | Cr | Fe | Cd | As | |||||
| 1 | Iron smelter | 241 | Kremikovtzi | Bulgaria | — | — | — | 111 | 61.8 | — | — | 2.10 | — | [15] | |
| 2 | Pb and Zn smelter | 242 | Zhuzhou | China | 472 | 907 | — | — | 77.0 | — | — | 11.9 | 38.0 | [28] | |
| 3 | Zn Smelter | 242 | Celje | Slovenia | 865 | 230 | — | 49.0 | 708 | — | — | 289 | 37.0 | [21] | |
| 4 | Smelter | 241, 242 | Wales | UK | 136 | 183 | — | — | 92.0 | — | — | 4.9 | — | [22] | |
| 5 | Smelter | 241, 242 | Reppel-Bocholt | Belgium | 899 | 137 | 246 | 94.0 | 801 | — | — | 12.0 | — | [14] | |
| 6 | Smelter | 241, 242 | Kosovska Mitrovica | Kosovo | 973 | 560 | — | 214 | 56.2 | 418 | — | 7.2 | 87.1 | [16] | |
| 7 | Metal industry | 241, 242 | Potenza | Italy | 87.7 | 62.8 | — | — | 26.1 | — | — | 1.31 | 18.3 | [18] | |
| 8 | Metal industry | 241, 242 | Annaba | Algeria | 53.1 | 67.5 | 355 | — | 39.0 | 30.9 | — | 0.44 | — | [12] | |
| 9 | Metal industry | ME + MI | 241, 242 | Karak ind. Estate (S) | Jordan | 15.7 | 4.9 | — | 3.70 | 1.60 | — | 23.4 | — | — | [29] |
| 10 | Copper smelter, steel industry | 241, 242 | Port Kembla | Australia | 20 | 42.0 | — | — | 49.0 | 12.0 | — | — | 3.20 | [33] | |
| 11 | Metal recycling, steel production | 241, 242 | Murcia | Spain | 18.3 | 21.8 | 229 | 17.7 | 7.40 | 19.4 | — | 0.20 | — | [37] | |
| 12 | Ferrous and non-ferrous metal smelters, iron and steel manufacturing, metal recovery, manganese ore treatment, scrap, metal incineration | 241, 242 | Thessaloniki | Greece | 24.2 | 68.3 | 443 | — | 26.8 | 98.7 | 37.1 | 0.22 | 36.1 | [17] | |
| 13 | Copper mines | 072 | Canchaque | Peru | 156 | 235 | 714 | 801 | — | — | — | 183 | 279 | [20] | |
| 14 | Smelters, mining | 071, 072, 241, 242 | Elbasan | Albania | 80 | 61.0 | — | 447 | 14.0 | 491 | — | 3.00 | — | [11] | |
| 15 | Smelters, mining | 071, 072, 241, 242 | Rubik | Albania | 135 | 250 | — | 66.0 | 111 | 256 | — | 9.00 | — | [11] | |
| 16 | Smelters, mining | 071, 072, 241, 242 | Munelle | Albania | 103 | 111 | — | 54.0 | 73.0 | 91.0 | — | 2.00 | — | [11] | |
| 17 | Smelters, mining | 071, 072, 241, 242 | Tharsis | Spain | 85.0 | 92.0 | 654 | — | 47.0 | — | — | — | 37.0 | [38] | |
|
| |||||||||||||||
| 18 | Petrochemical | 061 | Tarragona | Spain | 29.5 | — | 297 | — | — | 20.4 | — | 0.19 | 4.71 | [25] | |
| 19 | Petrochemical | 061 | Almowra | Spain | — | — | — | 27.6 | — | — | — | 2.13 | — | [39] | |
| 20 | Petrochemical | 061 | Tarragona | Spain | 36.3 | — | — | — | — | 13.8 | — | 0.21 | 5.50 | [26] | |
| 21 | Petrochemical | CE + PE | 061 | Catalonia | Spain | 37.8 | — | — | — | — | 16.5 | — | 0.21 | 6.51 | [40] |
| 22 | Chemical | 201 | Tarragona | Spain | 24.5 | — | 248 | — | — | 14.8 | — | 0.17 | 6.87 | [25] | |
| 23 | Chemical | 201 | Valencia | Spain | 22.2 | — | — | — | — | 17.5 | — | 0.16 | 6.24 | [40] | |
| 24 | Sulphuric acid-producing industry | 201 | Dhaka | Bangladesh | 1.03 | 126 | 277 | 88.2 | 63.5 | — | — | 0.53 | — | [23] | |
|
| |||||||||||||||
| 31 | Textile industries | TE | 131,139 | Dhaka | Bangladesh | 56.4 | 207 | 382 | 51.1 | 164 | — | — | 0.48 | — | [23] |
| 32 | Textile industries | 131,39 | Haridwar | India | 191 | — | 668 | — | 109 | 568 | 308 | 83.6 | — | [41] | |
|
| |||||||||||||||
| 27 | Tannery industries | 151 | Dhaka | Bangladesh | 68.1 | 290 | 39.7 | 5.20 | 17.6 | — | — | 1.26 | — | [23] | |
| 28 | Tannery industries | LE | 151 | Haridwar | India | — | — | 097 | — | 0.04 | 744 | 37.7 | 0.04 | — | [41] |
| 29 | Tannery industries | 151 | Peshawar | Pakistan | 4.66 | 2.38 | 5.29 | — | — | 29.9 | 18.0 | 0.60 | — | [30] | |
| 30 | Tannery industries | 151 | Damascus | Syria | 17.0 | 103 | — | 39.0 | 34.0 | 57.0 | — | — | — | [32] | |
| 33 | Cement factory | 239 | Qadissiya | Jordan | 55.0 | 45.0 | 204 | 39.0 | 2.90 | 22.2 | — | 5.00 | — | [29] | |
| 25 | Ceramic industries | NM | 239 | Dhaka | Bangladesh | 28.6 | 287 | 217 | 50.1 | 38.4 | — | — | 0.33 | — | [23] |
| 26 | Ceramic industries | 239 | Castellón | Spain | 229 | — | 345 | 36.5 | 66.0 | 29.7 | — | 72.0 | — | [42] | |
|
| |||||||||||||||
| 34 | Battery manufacturing | BA | 272 | Baoji | China | 268 | 169 | — | 39.3 | 62.3 | 100 | — | — | — | [28] |
|
| |||||||||||||||
| 35 | Textile, plastic, furniture, industries | 131, 201, 310 | Thane-Belapur | India | — | 191 | — | 184 | 105 | 521 | — | — | — | [43] | |
| 36 | Chemicals, dyes, textile, paint industries | 131, 201, 202 | Rajasthan | India | 293 | — | — | 136 | 298 | 240 | — | — | — | [43] | |
| 37 | Paint, battery, textile, milling and chemical industries | 131, 201, 272 | Lagos | Nigeria | — | — | — | 24.7 | 106 | — | — | 13.4 | — | [44] | |
| 38 | Ceramic, paper products, petrochemical industries | 061, 170, 239 | Belgrade | Serbia | 37.7 | 103 | — | 66.6 | 40.0 | — | — | — | — | [31] | |
| 39 | Chemicals, pharmaceutical, batteries | ND | 201, 210, 272 | Hyderabad | India | 65.0 | 313 | — | 45.0 | 193 | 433 | — | 0.70 | 33.0 | [24] |
| 40 | Chemicals, furniture, printing, leather, textile | 131, 151, 201, 310 | Kayseri | Turkey | 74.8 | 112 | — | 44.9 | 36.9 | 29.0 | — | 2.53 | — | [27] | |
| 41 | Brewery, steel/metal works, paints, pharmaceuticals, packaging, food processing, textiles and plastic products industries Tannery, textile, fertilizer, |
110, 131, 139, 201, 241 | Lagos | Nigeria | 143 | 247 | 283 | 17.0 | 25.6 | 26.6 | — | 2.90 | — | [45] | |
| 42 | rerolling and casting, chemicals paints plastics | 131, 139, 151, 201, 241 | Jajmau, Unnao | India | 38.3 | 159.9 | — | — | 42.9 | 265 | — | — | — | [46] | |
aRefer to Table 2.
bND—not defined due to the complexity of industry types.
Table 4.
Trace element concentration in (a) air and (b) water phases affected by industrial activities.
(a) Air phase
| Order | Industry type | Industry group Short namea | ISIC industry codea | Location | Trace element concentrations (ng m−3) | Reference | |||||||||
|---|---|---|---|---|---|---|---|---|---|---|---|---|---|---|---|
| City | Country | Pb | Zn | Mn | Ni | Cu | Cr | Fe | Cd | As | |||||
| 1 | Petrochemical | CE + PE | 061 | Tarragona | Spain | 1.22 | — | 4.70 | — | — | 2.19 | — | 0.05 | 0.12 | [25] |
| 2 | Petrochemical | 061 | Rio de Janeiro | Brazil | 8.90 | 25.1 | 1.50 | — | 12.1 | — | 15.9 | 0.30 | — | [47] | |
| 3 | Chemical and petrochemical | 061, 201 | Rio de Janeiro | Brazil | 15.9 | 2124 | 16.0 | 2.10 | 22.0 | 2.40 | 775 | 0.40 | — | [48] | |
| 4 | Chemical | 201 | Tarragona | Spain | 3.20 | — | 8.50 | — | — | 2.19 | — | 0.23 | 0.69 | [25] | |
|
| |||||||||||||||
| 5 | Machinery, metallurgical, petrochemistry, pulp and paper, textile | 131, 170, 241, 242, 281, | Sihwa | Rrpublic of Korea | 321 | 657 | 161 | — | — | 69.6 | 1203 | 7.10 | 7.70 | [49] | |
| 6 | Textile, metallurgical, paper | 131, 241, 242, 281, | Banwol | Rrpublic of Korea | 346 | 1272 | 86.3 | — | — | 21.0 | 1218 | 6.30 | 6.30 | [49] | |
| 7 | Metal recycling, steel production | 241, 242 | Pohang | Rrpublic of Korea | 93.8 | 389 | 245 | — | — | 23.9 | 5423 | 1.95 | — | [50] | |
| 8 | Ceramic, paper products, petrochemical | NDb | 061, 170, 239 | Onda | Spain | 164 | 203 | 7.00 | — | — | 3.00 | 432 | — | — | [40] |
| 9 | Oil refineries, cement, shipyards, steel | 192, 239, 241, 301 | Elefsina | Greece | 71.1 | — | 21.1 | — | — | — | — | 14.5 | 3.70 | [51] | |
| 10 | Oil refineries, steel mill Ferrous and non-ferrous metal |
192, 241 | Capana | Argentina | 70.6 | 36.9 | 21.2 | — | — | 2.83 | 552 | 0.27 | 2.76 | [44] | |
| 11 | manufacturing, fertilizer production, manganese ore treatment, scrap, metal incineration, oil refining | 192, 201, 241, 242 | Thessaloniki | Greece | 140 | 830 | 84.0 | — | 59.0 | 7.50 | — | 2.70 | 3.60 | [17] | |
aRefer to Table 2.
bNO—not defined due to the complexity of industry types.
(b) Water phase
| Phase | Industry type | Industry group short namea | ISIC industry | Location | Trace element concentration (mg L−1) | Reference | |||||||||
|---|---|---|---|---|---|---|---|---|---|---|---|---|---|---|---|
| codea | City | Country | Pb | Zn | Mn | Ni | Cu | Cr | Fe | Cd | As | ||||
| 1 | Brewery | 110 | Ibadan | Nigeria | — | 0.33 | 0.04 | — | 0.60 | 0.01 | 0.18 | — | — | [52] | |
| 2 | Brewery | BE | 110 | Benin | Nigeria | — | 0.17 | 0.03 | — | 0.46 | 0.01 | 0.38 | — | — | [52] |
| 3 | Brewery | 110 | Lagos | Nigeria | — | 0.22 | — | — | 0.54 | 0.02 | 0.15 | — | — | [52] | |
| 4 | Brewery | 110 | Ibadan | Nigeria | 0.19 | 2.40 | — | — | 0.36 | 0.21 | — | 0.11 | — | [53] | |
|
| |||||||||||||||
| 5 | Tannery | LE | 151 | Peshawar | Pakistan | 0.08 | 0.13 | 0.087 | — | — | 0.09 | 0.14 | 0.014 | — | [30] |
| 6 | Tannery | 151 | Haridwar | India | — | — | 0.02 | — | — | 0.93 | 0.84 | 0.007 | — | [41] | |
|
| |||||||||||||||
| 7 | Textile | TE | 131,139 | Kaduna | Nigeria | — | 0.31 | 1.18 | — | 1.16 | — | 2.14 | — | — | [54] |
| 8 | Textile | 131,139 | Haridwar | India | — | — | 0.7 | — | 0.05 | — | 2.95 | — | — | [41] | |
aRefer to Table 1.
Trace metals occur naturally in soils as a result of diverse geological processes such as chemical reaction and erosion of underground geological materials [56]. Beside these natural sources, industrial activities can supply a considerable quantity of metals to soil [57]. A large number of industrial activities produce wastes and contaminants that reach the soil through direct disposal, spills, leaks, atmospheric deposition from air, and other pathways [25]. Hence, enhanced metal levels (e.g., Cu, Zn, Pb, Co, Ni, Cd, As, and others) in soil media have been reported from in and around several industrial sites. As one of the dominant transportation routes of heavy elements, atmospheric emissions have commonly been designated as the main route of metallic accumulation in surface soils via their subsequent deposition, along with other transport routes like waste water discharge [58].
4.1. Mining, Smelter, and Metallurgical Industries
Severe metal pollution has been reported from areas surrounding mines and smelters in many countries [33, 59–63]. High levels of metals discharged from mine wastes may cause adverse environmental effects, because they can be dispersed into nearby agricultural soils and stream systems and taken up by food crops [64]. Among the 17 references dealing with metal pollution in mining and smelter sites, 4 elements (Cu, Cd, Pb, and Zn) stood out as the most common choice of target analyte. However, the data for other metals (e.g., Mn, Ni, Cr, Fe, and As), although not as common as the above 4 elements, are also available in many studies (Table 3). For this industry type, noticeably high concentrations of Pb, Zn, Mn, and Cr are frequently detected in the soil samples analysed. The relative ordering of the metal concentrations in these soils, if compared in terms of their median values, can be arranged in the following descending order: Mn > Zn > Pb > Cr > Ni > Cu > As > Fe > Cd (Table 5).
Table 5.
Statistical summary of trace element concentration (in mg kg−1) in soils affected by industrial activities.
| Industry group short name | Statistical parameter | Trace elements | ||||||||
|---|---|---|---|---|---|---|---|---|---|---|
| Pb | Zn | Mn | Ni | Cu | Cr | Fe | Cd | As | ||
| ME + MI | Mean | 258 | 190 | 440 | 186 | 137 | 177 | 30.3 | 37.6 | 67.0 |
| Median | 95 | 102 | 399 | 80.0 | 52.6 | 94.9 | 30.3 | 3.95 | 37.0 | |
| SD | 343 | 234 | 205 | 252 | 244 | 189 | 9.69 | 86.7 | 89.0 | |
| Min | 15.7 | 4.90 | 229 | 3.70 | 1.60 | 12.0 | 23.4 | 0.20 | 3.20 | |
| Max | 973 | 907 | 714 | 801 | 801 | 491 | 37.1 | 289 | 279 | |
| N | 16 | 16 | 6 | 10 | 16 | 8 | 2 | 14 | 8 | |
|
| ||||||||||
| CE + PE | Mean | 25.2 | 126 | 274 | 57.9 | 63.5 | 16.6 | — | 0.51 | 5.97 |
| Median | 25.2 | — | 274 | 57.9 | — | 16.6 | — | 0.51 | 5.97 | |
| SD | 13.4 | — | 24.6 | 42.9 | — | 2.57 | — | 0.72 | 0.86 | |
| Min | 1.03 | — | 248 | 27.6 | — | 13.8 | — | 0.16 | 4.71 | |
| Max | 37.8 | — | 297 | 88.2 | — | 20.4 | — | 2.13 | 6.87 | |
| N | 6 | 1 | 3 | 2 | 1 | 5 | 0 | 7 | 5 | |
|
| ||||||||||
| TE | Mean | 124 | 207 | 525 | 51.1 | 136 | 568 | 308 | 42.0 | — |
| Median | 124 | — | 525 | — | 136 | — | — | 42.0 | — | |
| SD | 95.2 | — | 202 | — | 38.7 | — | — | 58.8 | — | |
| Min | 56.4 | — | 382 | — | 109 | — | — | 0.48 | — | |
| Max | 191 | — | 668 | — | 164 | — | — | 83.6 | — | |
| N | 2 | 1 | 2 | 1 | 2 | 1 | 1 | 2 | 0 | |
|
| ||||||||||
| LE | Mean | 29.9 | 132 | 15.3 | 22.1 | 17.2 | 277 | 27.9 | 0.63 | — |
| Median | 17.0 | 103 | 5.29 | 22.1 | 17.6 | 57.0 | 27.9 | 0.60 | — | |
| SD | 33.6 | 146 | 21.2 | 23.9 | 17.0 | 405 | 13.9 | 0.61 | — | |
| Min | 4.66 | 2.38 | 0.97 | 5.20 | 0.04 | 29.9 | 18.0 | 0.04 | — | |
| Max | 68.1 | 290 | 39.7 | 39.0 | 34.0 | 744 | 37.7 | 1.26 | — | |
| N | 3 | 3 | 3 | 2 | 3 | 3 | 2 | 3 | 0 | |
|
| ||||||||||
| NM | Mean | 104 | 166 | 255 | 41.9 | 35.8 | 26.0 | — | 25.8 | — |
| Median | 55.0 | 166 | 217 | 39.0 | 38.4 | 26.0 | — | 5.00 | — | |
| SD | 109 | 171 | 77.9 | 7.24 | 31.6 | 5.30 | — | 40.1 | — | |
| Min | 28.6 | 45.0 | 204 | 36.5 | 2.90 | 22.2 | — | 0.33 | — | |
| Max | 229 | 287 | 345 | 50.1 | 66.0 | 29.7 | — | 72.0 | — | |
| N | 3 | 2 | 3 | 3 | 3 | 2 | 0 | 3 | 0 | |
|
| ||||||||||
| BA | Value | 268 | 169 | — | 39.3 | 62.3 | 100 | — | — | — |
|
| ||||||||||
| ND | Mean | 109 | 188 | 283 | 74.0 | 106 | 252 | — | 4.89 | — |
| Median | 69.9 | 176 | — | 45.0 | 74 | 253 | — | 2.72 | — | |
| SD | 98.2 | 81.2 | — | 62.3 | 95.6 | 203 | — | 5.76 | — | |
| Min | 37.7 | 103 | — | 17.0 | 25.6 | 26.6 | — | 0.70 | — | |
| Max | 293 | 313 | — | 184 | 298 | 521 | — | 13.4 | — | |
| N | 6 | 6 | 1 | 7 | 8 | 6 | 0 | 4 | 0 | |
|
| ||||||||||
| All | Mean | 158 | 180 | 312 | 106 | 106 | 176 | 84.8 | 21.6 | 42.8 |
| Median | 65.0 | 131 | 280 | 49.6 | 52.6 | 44.0 | 37.1 | 2.00 | 25.7 | |
| SD | 247 | 180 | 208 | 168 | 176 | 217 | 125 | 59.8 | 71.8 | |
| Min | 1.03 | 2.38 | 0.97 | 3.70 | 0.04 | 12.0 | 18.0 | 0.04 | 3.20 | |
| Max | 973 | 907 | 714 | 801 | 801 | 744 | 308 | 289 | 279 | |
| N | 37 | 30 | 18 | 26 | 34 | 26 | 5 | 33 | 14 | |
Fairly high concentrations of Mn, Zn, and Cr (e.g., 443, 68.3, and 98.7 mg kg−1, resp.) were found near metal industries in Thessaloniki [17]. In general, all elements determined in their study were comparable to the levels normally determined in clay soils worldwide [17]. Enhanced concentrations (mg kg−1) of Mn (652), Pb (85), Zn (92), and Cu (47) were also found in soils surrounding the mining and smelting areas in Tharsis, Spain [38]. An investigation covering eight smelters and mining sites in Albania reported exceedingly high concentrations of one or more metals [11]. These authors reported the maximum concentrations (mg kg−1) of metals in soil dry matter (DM): Cd (14), Cr (3,865), Cu (1,107), Ni (3,579), Pb (172), and Zn (2,495). If one refers to the report of Kabata-Pendias and Pendias [65], the measurements of Shallari et al. [11] appear to be toxic with the observed levels harmful for plant growth.
Borgna et al. [16] measured 12 trace elements (As, Cd, Co, Cr, Cu, Ni, Pb, Sb, Th, Tl, U, and Zn) in topsoils from the smelter site in the K. Mitrovica area, Kosovo. They reported considerably elevated median values (mg kg−1) for Pb, Zn, and Cu of 294, 196, and 37.7, respectively. Borgna et al. [16] also noticed that metal levels caused by mining activities decreased significantly with soil depth. Such pollution activities, therefore, basically affected the upper soil layer between 0 and 50 cm [66]. The analysis of vertical soil profiles generally showed an accumulation of trace metals towards the surface soil due to the outputs of mining, smelter, and metallurgical industries [61, 67, 68]. However, there is also contrasting evidence of vertical metal distribution patterns. For instance, near an iron smelter in Bulgaria, Schulin et al. [15] found that the differences in metal levels between topsoil and subsoil samples were generally small. These authors concluded that the observed vertical profiles of soil metal levels in the study area should primarily be related to geogenic processes. Martley et al. [33] was also unable to find any differences in metal concentrations at soil layers between 0–5 and 5–20 cm, except for Pb and Zn. Similar partitioning results for trace elements were also seen from soils around the Harjavalta smelter, Finland [69], and in Tharsis, Spain [38].
Considering horizontal distributions, metal concentrations in soil usually decrease with increasing distance from the mining or smelter site, generally following an exponential or negative-power decay function. In most cases, metal concentrations in topsoil layers significantly exceeded those of background levels (background levels being considered as those many kilometers from the smelter facilities). For instance, contamination was found to be detectable up to 33 km for a copper smelter or up to 217 km for a zinc smelter in Canada [70]. It was found that As was generally transported over long distances relative to other elements (e.g., Pb, Zn, etc.) [68, 71]. The reason for such enhanced distribution of As may come as a result of its higher volatility and extended atmospheric residence time. Hence, As is less likely to deposit very near the point source from which it was emitted [72]. However, smelter emissions generally depend on a variety of factors including the mass of emitted contaminants, their particle size distributions, stack height, meteorological conditions such as wind speed and direction, and topography [67]. Garmash [73] found that concentrations of zinc, lead, and cadmium were an order of magnitude lower in soil at iron smelter than from a nearby the zinc smelter as a function of the different emissions profile from each plant.
4.2. Chemical and Petrochemical Industries
Chemical and petrochemical industries have been identified as large emitters of not only metals but also a wide variety of pollutants (e.g., volatile organic compounds (VOCs), polycyclic aromatic hydrocarbons (PAHs), polychlorinated biphenyls (PCBs), etc.) [25]. As these pollutants are also commonly recognized as markers of environmental pollution, they have also been identified as the cause of some adverse health effects in workers and people living nearby [25]. In Table 3, it is shown that Cd, Pb, Cr, and As are the most abundant trace metals found in soil samples around chemical and petrochemical sites. The release of metals such as Pb, As, or Cr may occur in refining operations and from the burning of residual oils [74]. In contrast, Mn, Ni, Zn, and Cu were determined only at 3, 2, 1, and 1 sites, respectively, from the 7 references examined in this study (Table 3). As shown in Table 5, the mean concentrations (mg kg−1) of Pb, Cr, As, and Cd resulting from this industry type were 25.2, 16.6, 5.97, and 0.51, respectively.
In a study conducted near a sulphuric acid plant in Bangladesh, very high concentrations (mg kg−1) of Zn (126), Mn (277), Ni (88.2) and Cu (63.5) were detected in soil samples [23]. The status of metal pollution in soil near the sulphuric acid production facilities should directly depend on the quantity of waste material discharged onto the land. Furthermore, many trace metals are likely to be deposited by localized acid rain, once emitted to air from the industry in question [23]. There is also a strong possibility of soil acidification as a result of SO2 emissions from the acid-producing industries [75]. Low pH values from the sulphuric acid production facility are also likely to help increase solubility and mobility of metals in the soil.
4.3. Textile Industries
Textile industries can act as one of the major sources of metal pollution in the environment [41]. There is evidence that significant amounts of trace metals have been released into the surrounding soil from textile industries (Table 3). In one of the previous studies conducted in Bangladesh, mean soil concentrations of Pb, Zn, Mn, Ni, and Cd in the vicinity of textile industries were found to be 56.4, 207, 382, 51.1, 164 mg kg−1, respectively [23]. All metals except Ni were detected in 18 soil samples collected near textile industrial facilities with their mean values being (mg kg−1) of 191 (Pb), 668 (Mn), 109 (Cu), 586 (Cr), 380 (Fe), and 83.6 (Cd) [41]. In addition, chromium and cadmium in the soils contaminated with textile effluent in Tamil Nadu, India were reported to be in the range of 55.4–180 and 0.2–5.8 mg kg−1, respectively [76]. Although relatively high levels of lead are generally seen in soil samples contaminated by textile industries, conversely lead concentrations in textile effluents were below the detection limit. The presence of lead in soil was thus ascribed to its airborne transport and subsequent deposition from automobiles and other industries in the area.
4.4. Leather Industries
Solid and liquid wastes emanating from the tanning industry are known to contain various toxic trace metals [68]. In most developing countries, tannery effluents are directly discharged to nearby land where they adversely affect the quality of both soil and ground water [23]. According to our evaluation, Cr showed the highest values followed by Zn, amongst the trace metals reported in this category (Table 5). This finding can be ascribed to the fact that chromium salts are the most widely used tanning substances [32, 77]. Only a fraction of the chromium salts are actually consumed during leather processing, and most of the salt is discharged as liquid effluent [30]. The mean concentrations (mg kg−1) of trace metals were determined to be Cr (744), Zn (0.97), Cu (0.04), Fe (37.7), and As (0.04) in soil samples in the vicinity of leather industries in India [41]. On the other hand, higher iron and copper levels were seen (4837–6311 and 7.20–20.5 mg kg−1, resp.) in soils affected by tannery effluent in Mexico [78]. Cr was also reported to range from 155 to 568 mg kg−1 in tannery waste contaminated soil in the Vellore district of Tamil Nadu, India [5].
4.5. Non-Metallic Mineral Industries
Nonmetallic mineral industries such as cement, ceramic, and battery manufacturing facilities can act as a major source of trace metal pollution in soil. In a study made in Jordan, it was suggested that cement factory emissions might represent the most important pollution source in the area investigated [29]. High Pb, Zn, Mn, and Ni concentrations (e.g., 55, 45, 204, and 39 mg kg−1, resp.) were recorded in the soil samples close to the cement plant [29]. This may reflect the fact that the process and production of cement industry require a substantial amount of energy (supplied by burning fossil fuel) and traffic activity in and around the plant [79]. Kashem and Singh [23] found Ni and Zn in excess of tolerable levels, set as 50 mg kg−1and 290 mg kg−1, respectively, in the soil samples of ceramic industry sites in Bangladesh. High levels (mg kg−1) of Pb (268) and Zn (169) were also found near battery manufacturing facilities, which are suspected to pollute the soil in the industrial area of Baoji city, China [28]. It was noted that Pb is the main primary raw material used for battery production, while the geochemical behavior of Pb, Zn, and Mn is known to be very similar in most natural processes [80].
5. Evaluation of Metal Pollution between Soils Affected by Different Industry Types
To learn more about the relative dominance of a given metal between different industry types, we evaluated our soil metal data by various classification criteria (Table 5). Considering the metal concentration levels determined for different industry types, the overall mean values for different metals can be arranged in the following descending manner: Mn > Zn > Cr > Pb > Ni > Cu > Fe > As > Cd (Table 5). Across the different industry types, the highest average metal concentrations (6 out of 9 studies) were observed from smelter and metal industries. However, the highest mean Mn and Cd concentrations were found from the textile industry, while the highest Cr from leather industry studies (Figure 2). In a study comparing textile and leather industries, Deepali and Gangwar [41] found chromium content to be 23.6% lower in soil contaminated by textile effluent than that contaminated by tannery effluent. Textile industry effluent showed an excess concentration when compared to that from the tannery industry of 87.8% (Fe), 99.9% (Mn), and 99.9% (Cd), while soils affected by tannery industry were characterized by excess Cr. In another study comparing textile and tannery industries in Bangladesh, higher concentrations of Mn, Ni, and Cu were found in soil samples due to textile activity [23]. On the other hand, Pb and Zn showed the opposite trend, that is, higher values from tannery than textile industry samples.
Figure 2.
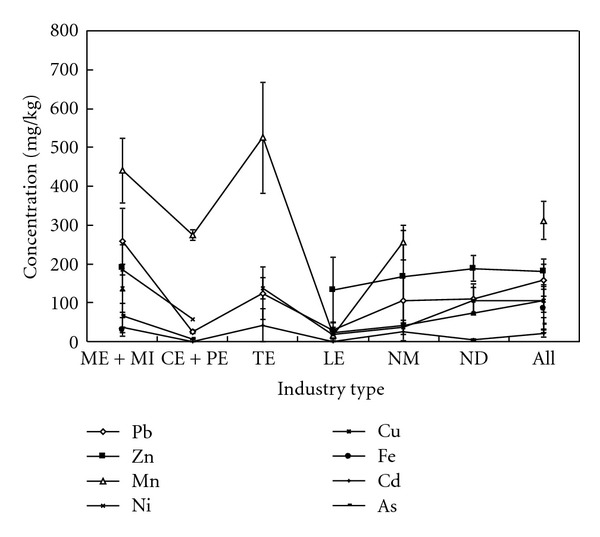
Comparison of soil metal levels affected by different industry types.
The rapid growth in industrial activities has increased the pressure on environmental sustainability. For a healthy and balanced environment, several regulations have been set out by different governments recognizing the need for improved environmental management. In case of soil, the regulations are set on total metals in the soil, and as such it is important to consider bioavailability of the metals in relation to soil physiochemical properties (such as organic matter content, clay content, cation exchange capacity, etc.). The regulations for the maximum allowable soil metal levels established in different countries are presented in Table 6. However, there are large variations in regulatory metal limits in different countries. In this discussion, we will consider mainly regulatory values which are common to a large number of countries. If our database of soil pollution (Table 3) is examined in this respect, Pb is found to exceed the maximum allowable level (e.g., 100 mg kg−1 in Table 6) on many occasions as a result of the metal and mining industries (8 out of 17 studies) and on a single occasion from textile, ceramic, and battery manufacturing industries. Much more emphasis has been placed on lead contamination in soils in recent years, as it exerts very toxic effects on humans and animals. Lead enters human or animal metabolism either via the food chain or by intake of soil dust [93]. In addition to the sources mentioned above, battery production and scrap battery recovery facilities, thermal power plants, and iron-steel industries are commonly found to be major industrial sources of Pb [94]. The concentration of Zn measured from a (Pb and Zn) smelter in China, a metal industry facility in Kosovo, and an industrial complex in India averaged as 907, 560, and 313 mg kg−1, respectively (Table 3). Hence, these observed Zn levels also exceeded commonly allowable concentration levels (e.g., 300 mg kg−1 in Table 6). The mean concentration of Ni was much higher than its allowable limit (e.g., 50 mg kg−1) close to a number of industries such as mining and metal, chemical, textile, ceramic, and industrial complexes. In the case of Cu, concentrations above the regulatory value (e.g., 100 mg kg−1) were mainly seen from textile and metal industries. In textile processing, a number of heavy metals (especially Cu, Cr, Zn, etc.) are used in dying and printing processes [95]. As such, the mean concentrations of Cr and Cd in metal, textile, leather, and industrial complexes exceeded the guideline values (i.e., 150 and 3 mg kg−1, resp.). The contents of Cr and Cd in topsoil were reported to increase due to the release of various industrial wastes such as tannery wastes, electroplating sludges, leather manufacturing wastes, and so forth [94]. In contrast, exceedance of the regulatory guideline level for As (i.e., 20 mg kg−1) was found only in the case of mining and metal industries.
Table 6.
Regulatory levels for soil metals established between different countries.
| Order | Country | Concentration (mg kg−1) | Reference | ||||||
|---|---|---|---|---|---|---|---|---|---|
| Pb | Zn | Ni | Cu | Cr | Cd | As | |||
| 1 | Australia | — | 200 | 60 | 60 | 50 | — | 20 | [81] |
| 2 | Japan | — | — | — | 125 | — | 1 | 15 | [82] |
| 3 | Taiwan | 100 | 300 | — | 150 | 200 | 4 | 20 | [83] |
| 4 | Turkey | 150 | 500 | — | 100 | — | 5 | — | [84] |
| 5 | EU | 300 | 300 | 75 | 140 | 150 | 3 | — | [85] |
| 6 | Netherlands | 150 | 500 | 100 | 100 | 250 | 5 | — | [86] |
| 7 | Spain | 300 | 450 | 112 | 210 | 150 | 3 | — | [87] |
| 8 | Germany | 100 | 300 | 50 | 100 | 100 | 3 | 20 | [88] |
| 9 | France | 100 | 300 | 50 | 100 | 150 | 2 | 20 | [89] |
| 10 | UK | 550 | 280 | 35 | 140 | 600 | 4 | 10 | [90] |
| 11 | USA | 150 | 300 | 31 | 45 | 212 | 2 | 5.6 | [91] |
| 12 | Canada | 500 | 500 | 100 | 100 | 250 | 5 | — | [92] |
6. Assessment of Geoaccumulation (I geo) Index
In order to learn more about the level of metal pollution in soil and around industrialized areas, we employed a common approach to estimate the enrichment of metal concentrations in soil relative to background concentration, by computing the geoaccumulation index (I geo) [96, 97]. This method allows assessment of the extent of metal pollution into seven classes based on the increasing numerical value of the index as follows: (1) I geo ≤ 0: practically uncontaminated, (2) 0 < I geo < 1: uncontaminated to moderately contaminated, (3) 1 < I geo < 2: moderately contaminated, (4) 2 < I geo < 3: moderately to heavily contaminated (5) 3 < I geo < 4: heavily contaminated (6) 4 < I geo < 5: heavily to extremely contaminated, and (7) 5 ≤ I geo: extremely contaminated [96]. This index can be derived by the following equation:
| (1) |
where Cn is the measured concentration of the trace element in the soil samples and Bn is the geochemical background value in the earth's crust. The constant 1.5 allows us to account for the natural fluctuations in the content of a given substance in the environment and the possible influence of nonlocalized anthropogenic sources. Results for calculation of the geo-accumulation index using our survey soil data are summarized in Table 7. If we calculate the average I geo values of the trace metals in our soil database, they can be arranged in ascending order: Zn (0.81), Ni (1.26), Cu (1.28), As (1.49), Cr (1.60), Pb (2.06), and Cd (3.60). According to this geo-accumulation index calculation, it can be seen that the extent of soil pollution is the least significant for such metals as Mn and Fe, despite the influence of industrial activities. This indicates that these two metals are commonly derived from natural (geogenic) processes. It is also found that Zn, Ni, and Cu remain below class 3 level, while the highest I geo were recorded for Cr, As, Pb, and Cd such as 3.57, 3.84, 5.02, and 9.33, respectively (Table 7). Among the metals, higher I geo values were found for Pb and Cd that are mainly in association with mining and metal industries. The relative ordering of I geo values within our study is comparable to those reported in a number of previous studies. In one of the previous studies in the Gebze industrial area, Turkey, the highest I geo values for metals were found as 10.2 (Cd), 8.38 (Pb), 6.64 (Zn), 4.77 (As), 3.63 (Cu), 3.52 (Mn), and 3.49 (Cr) [94]. Around a cement factory in Ghana, the I geo of Ca, Cu, Mn were found 1.21, 1.36, and 2.96, respectively [98].
Table 7.
Comparison of the geoaccumulation index calculated for the soil bound metals affected by industrial activities.
| Order | Industry type | Industry group short namea | Country | Index of geoaccumulation (I geo) | ||||||||
|---|---|---|---|---|---|---|---|---|---|---|---|---|
| Pb | Zn | Mn | Ni | Cu | Cr | Fe | Cd | As | ||||
| 1 | Iron smelter | Bulgaria | —a | — | — | 0.12 | — | — | — | 2.22 | — | |
| 2 | Pb and Zn smelter | China | 3.98 | 2.67 | — | — | 0.19 | — | — | 4.72 | 0.96 | |
| 3 | Zn Smelter | Slovenia | 4.85 | 0.69 | — | — | 3.39 | — | — | 9.33 | 0.92 | |
| 4 | Smelter | UK | 2.18 | 0.36 | — | — | 0.45 | — | — | 3.44 | — | |
| 5 | Smelter | Belgium | 4.91 | — | — | — | 3.57 | — | — | 4.74 | — | |
| 6 | Smelter | Kosovo | 5.02 | — | — | 1.07 | — | 1.63 | — | 4.00 | 2.16 | |
| 7 | Metal industry | Italy | 1.55 | — | — | — | — | — | — | 1.54 | — | |
| 8 | Metal industry | Algeria | 0.82 | — | — | — | — | — | — | — | — | |
| 9 | Metal industry | ME + MI | Jordan | — | — | — | — | — | — | — | — | — |
| 10 | Copper smelter, steel industry | Australia | — | — | — | — | — | — | — | — | — | |
| 11 | Metal recycling, steel production Ferrous and non-ferrous metal smelters, iron and |
Spain | — | — | — | — | — | — | — | — | — | |
| 12 | steel manufacturing, metal recovery, manganese ore treatment, scrap, metal incineration | Greece | — | — | — | — | — | — | — | — | 0.89 | |
| 13 | Copper mines | Peru | 2.38 | 0.72 | — | 2.97 | — | — | — | 8.67 | 3.84 | |
| 14 | Smelters, mining | Albania | 1.42 | — | — | 2.13 | — | 1.86 | — | 2.74 | — | |
| 15 | Smelters, mining | Albania | 2.17 | 0.81 | — | — | 0.71 | 0.92 | — | 4.32 | — | |
| 16 | Smelters, mining | Albania | 1.78 | — | — | — | 0.11 | — | — | 2.15 | — | |
| 17 | Smelters, mining | Spain | 1.50 | — | — | — | — | — | — | — | 0.92 | |
|
| ||||||||||||
| 18 | Petrochemical | Spain | — | — | — | — | — | — | — | — | — | |
| 19 | Petrochemical | Spain | — | — | — | — | — | — | — | — | — | |
| 20 | Petrochemical | Spain | 0.28 | — | — | — | — | — | — | — | — | |
| 21 | Petrochemical | CE + PE | Spain | 0.33 | — | — | — | — | — | — | — | — |
| 22 | Chemical | Spain | — | — | — | — | — | — | — | — | — | |
| 23 | Chemical | Spain | — | — | — | — | — | — | — | — | — | |
| 24 | Sulphuric acid producing industry | Bangladesh | — | — | — | — | — | — | — | 0.24 | — | |
|
| ||||||||||||
| 31 | Textile industries | TE | Bangladesh | 0.91 | 0.54 | — | — | 1.28 | — | — | 0.09 | — |
| 32 | Textile industries | India | 2.67 | — | — | — | 0.69 | 2.07 | — | 7.54 | — | |
|
| ||||||||||||
| 27 | Tannery industries | Bangladesh | 1.18 | 1.03 | — | — | — | — | — | 1.49 | — | |
| 28 | Tannery industries | LE | India | — | — | — | — | — | 2.46 | — | — | — |
| 29 | Tannery industries | Pakistan | — | — | — | — | — | — | — | 0.42 | — | |
| 30 | Tannery industries | Syria | — | — | — | — | — | — | — | — | — | |
|
| ||||||||||||
| 33 | Cement factory | Jordan | 0.87 | — | — | — | — | — | — | 3.47 | — | |
| 25 | Ceramic industries | NM | Bangladesh | — | 1.01 | — | — | — | — | — | — | — |
| 26 | Ceramic industries | Spain | 2.93 | — | — | — | — | — | — | 7.32 | — | |
|
| ||||||||||||
| 34 | Battery manufacturing | BA | China | 3.16 | 0.25 | — | — | — | — | — | — | — |
|
| ||||||||||||
| 35 | Textile, plastic, furniture, industries | India | — | 0.42 | — | 0.85 | 0.63 | 1.95 | — | — | — | |
| 36 | Chemicals, dyes, textile, paint industries Paint, battery, textile, |
India | 3.29 | — | — | 0.42 | 2.14 | 0.83 | — | — | — | |
| 37 | milling and chemical industries | Nigeria | — | — | — | — | 0.65 | — | — | 4.90 | — | |
| 38 | Ceramic, paper products, petrochemical industries Chemicals, pharmaceutical, batteries |
Serbia | 0.33 | — | — | — | — | — | — | — | — | |
| 39 | plastic products | ND | India | 1.12 | 1.14 | — | — | 1.52 | 1.68 | — | 0.64 | 0.76 |
| 40 | Chemicals, furniture, printing, leather, textile Brewery, steel/metal works, paints, |
Turkey | 1.32 | — | — | — | — | — | — | 2.49 | — | |
| 41 | pharmaceuticals, packaging, food processing, textiles and plastic products industries Tannery, textile, |
Nigeria | 2.25 | 0.80 | — | — | — | — | — | 2.69 | — | |
| 42 | fertilizer, rerolling and casting, chemicals, paints, plastics | India | 0.35 | 0.17 | — | — | — | 0.97 | — | — | — | |
aNo numeric values are shown for the cases with negative values.
7. Conclusions
To learn more about the effect of industrial activities on environmental pollution, we performed a comprehensive survey of metal pollution in different environmental media. Although database which our survey drew upon is limited in terms of number of studies and the range of industry types, it is representative of the diversity and type of studies in the literature and hence the results of our analysis still provide valuable insights into metal pollution in the soil environment. The data obtained in this survey demonstrate that the metal concentrations in soil generally reflect the influence of various local industrial activities which include metal and mining, chemical and petrochemical, textile, leather, cement, and ceramic industries. Observations of generally enhanced metal levels in soils around various industrial facilities are explainable by unregulated, untreated solid and fluid wastes released by the industries to the nearby land. Among the 9 reference trace metals examined, it is seen that Cu, Cd, Pb, and Zn were monitored the most frequently. Evaluation of soil metal data indicates that their maximum values occur in relation to particular industry types, that is, Pb, Zn, Ni, Cu, Fe, and As in smelter and metal industries, Mn and Cd in the textile industry, and Cr in leather industry studies. The observed metal levels in many of the mining and metal industry samples frequently exceeded the guidance levels set by the environmental legislation in the relevant country. The status of soil pollution in this study, if assessed according to I geo values, was classified as moderately-to-extremely contaminated. Most of the samples exhibited the strongest contamination in Pb and Cd. However, the samples were not greatly polluted with respect to Mn and Fe. Considering that there are no regulatory guidelines regarding soil pollution in many developing countries, more efforts should be made to characterize the soil pollution in relation to various industrial activities. This may also help us set proper soil regulation guidelines for sustaining a healthy and balanced environment and protecting human health.
Acknowledgments
This study was supported by a National Research Foundation of Korea (NRF) Grant funded by the Ministry of Education, Science and Technology (MEST) (no. 2010-0007876). The fourth author acknowledges the support made by a grant from the Korea Basic Science Institute (Project no. T31603). The fifth author also acknowledges partial support made by the Human Resources Development of the Korea Institute of Energy Technology Evaluation and Planning (KETEP) Grant funded by the Korea government Ministry of Knowledge Economy (no. 20100092).
References
- 1.De Bartolomeo A, Poletti L, Sanchini G, Sebastiani B, Morozzi G. Relationship among parameters of lake polluted sediments evaluated by multivariate statistical analysis. Chemosphere. 2004;55(10):1323–1329. doi: 10.1016/j.chemosphere.2003.12.005. [DOI] [PubMed] [Google Scholar]
- 2.Landajo A, Arana G, De Diego A, Etxebarria N, Zuloaga O, Amouroux D. Analysis of heavy metal distribution in superficial estuarine sediments (estuary of Bilbao, Basque Country) by open-focused microwave-assisted extraction and ICP-OES. Chemosphere. 2004;56(11):1033–1041. doi: 10.1016/j.chemosphere.2004.06.005. [DOI] [PubMed] [Google Scholar]
- 3.Miró M, Estela JM, Cerdà V. Application of flowing stream techniques to water analysis: part III. Metal ions: alkaline and alkaline-earth metals, elemental and harmful transition metals, and multielemental analysis. Talanta. 2004;63(2):201–223. doi: 10.1016/j.talanta.2003.10.047. [DOI] [PubMed] [Google Scholar]
- 4.Amiard JC, Amiard-Triquet C, Méayer C. Experimental study of bioaccumulation, toxicity, and regulation of some trace metals in various estuarine and coastal organisms. In: Salanki J, editor. In: Proceedings of the Symposium on Heavy Metals in Water Organisms; 1995; Budapest, Hungary. Akademiai Kiado; pp. 313–324. [Google Scholar]
- 5.Mahimairaja S. An overview of heavy metals: impact and remediation. Current Science. 2000;78(7):34–45. [Google Scholar]
- 6.Dahbi S, Azzi M, Saib N, De la Guardia M, Faure R, Durand R. Removal of trivalent chromium from tannery waste waters using bone charcoal. Analytical and Bioanalytical Chemistry. 2002;374(3):540–546. doi: 10.1007/s00216-002-1490-9. [DOI] [PubMed] [Google Scholar]
- 7.Babel S, Kurniawan TA. Low-cost adsorbents for heavy metals uptake from contaminated water: a review. Journal of Hazardous Materials. 2003;97(1–3):219–243. doi: 10.1016/s0304-3894(02)00263-7. [DOI] [PubMed] [Google Scholar]
- 8.Farabegoli G, Carucci A, Majone M, Rolle E. Biological treatment of tannery wastewater in the presence of chromium. Journal of Environmental Management. 2004;71(4):345–349. doi: 10.1016/j.jenvman.2004.03.011. [DOI] [PubMed] [Google Scholar]
- 9.Parikh JK, Sharma VK, Gosh U, Panda MK. Trade and Environment Linkages: a case study of India. Indira Gandhi Institute of Development; 1995. [Google Scholar]
- 10. International Standard Industrial Classification (ISIC), Rev.4 structure (United Nations Statistics Division), 2008.
- 11.Shallari S, Schwartz C, Hasko A, Morel JL. Heavy metals in soils and plants of serpentine and industrial sites of Albania. Science of the Total Environment. 1998;209(2-3):133–142. [PubMed] [Google Scholar]
- 12.Maas S, Scheifler R, Benslama M, et al. Spatial distribution of heavy metal concentrations in urban, suburban and agricultural soils in a Mediterranean city of Algeria. Environmental Pollution. 2010;158(6):2294–2301. doi: 10.1016/j.envpol.2010.02.001. [DOI] [PubMed] [Google Scholar]
- 13.Brown RJC, Goddard SL, Blakley KC, Brown AS. Improvements to standard methodologies for the analytical determination of metals in stationary-source emissions samples. Journal of the Air and Waste Management Association. 2011;61(7):764–770. doi: 10.3155/1047-3289.61.7.764. [DOI] [PubMed] [Google Scholar]
- 14.Cappuyns V, Van Herreweghe S, Swennen R, Ottenburgs R, Deckers J. Arsenic pollution at the industrial site of Reppel-Bocholt (North Belgium) Science of the Total Environment. 2002;295(1–3):217–240. doi: 10.1016/s0048-9697(02)00096-7. [DOI] [PubMed] [Google Scholar]
- 15.Schulin R, Curchod F, Mondeshka M, Daskalova A, Keller A. Heavy metal contamination along a soil transect in the vicinity of the iron smelter of Kremikovtzi (Bulgaria) Geoderma. 2007;140(1-2):52–61. [Google Scholar]
- 16.Borgna L, Di Lella LA, Nannoni F, et al. The high contents of lead in soils of Northern Kosovo. Journal of Geochemical Exploration. 2009;101(2):137–146. [Google Scholar]
- 17.Voutsa D, Grimanis A, Samara C. Trace elements in vegetables grown in an industrial area in relation to soil and air particulate matter. Environmental Pollution. 1996;94(3):325–335. doi: 10.1016/s0269-7491(96)00088-7. [DOI] [PubMed] [Google Scholar]
- 18.Medici L, Bellanova J, Belviso C, et al. Trace metals speciation in sediments of the Basento River (Italy) Applied Clay Science. 2011;53(3):414–442. [Google Scholar]
- 19.Al-Khashman OA. Heavy metal distribution in dust, street dust and soils from the work place in Karak Industrial Estate, Jordan. Atmospheric Environment. 2004;38(39):6803–6812. [Google Scholar]
- 20.Bech J, Poschenrieder C, Llugany M, et al. Arsenic and heavy metal contamination of soil and vegetation around a copper mine in Northern Peru. Science of the Total Environment. 1997;203(1):83–91. [Google Scholar]
- 21.Voglar GE, Lestan D. Solidification/stabilisation of metals contaminated industrial soil from former Zn smelter in Celje, Slovenia, using cement as a hydraulic binder. Journal of Hazardous Materials. 2010;178(1–3):926–933. doi: 10.1016/j.jhazmat.2010.02.026. [DOI] [PubMed] [Google Scholar]
- 22.Davies BE. Heavy metal contaminated soils in an old industrial area of Wales, Great Britain: source identification through statistical data interpretation. Water, Air, & Soil Pollution. 1997;94(1-2):85–98. [Google Scholar]
- 23.Kashem A, Singh BR. Heavy metal contamination of soil and vegetation in the vicinity of industries in Bangladesh. Water, Air, & Soil Pollution. 1999;115(1–4):347–361. [Google Scholar]
- 24.Govil PK, Sorlie JE, Murthy NN, et al. Soil contamination of heavy metals in the Katedan Industrial Development Area, Hyderabad, India. Environmental Monitoring and Assessment. 2008;140(1–3):313–323. doi: 10.1007/s10661-007-9869-x. [DOI] [PubMed] [Google Scholar]
- 25.Nadal M, Mari M, Schuhmacher M, Domingo JL. Multi-compartmental environmental surveillance of a petrochemical area: levels of micropollutants. Environment International. 2009;35(2):227–235. doi: 10.1016/j.envint.2008.06.001. [DOI] [PubMed] [Google Scholar]
- 26.Nadal M, Schuhmacher M, Domingo JL. Levels of metals, PCBs, PCNs and PAHs in soils of a highly industrialized chemical/petrochemical area: temporal trend. Chemosphere. 2007;66(2):267–276. doi: 10.1016/j.chemosphere.2006.05.020. [DOI] [PubMed] [Google Scholar]
- 27.Tokahoglu S, Kartal S. Multivariate analysis of the data and speciation of heavy metals in street dust samples from the Organized Industrial District in Kayseri (Turkey) Atmospheric Environment. 2006;40(16):2797–2805. [Google Scholar]
- 28.Li X, Huang C. Environment impact of heavy metals on urban soil in the vicinity of industrial area of Baoji city, P.R. China. Environmental Geology. 2007;52(8):1631–1637. [Google Scholar]
- 29.Al-Khashman OA, Shawabkeh RA. Metals distribution in soils around the cement factory in southern Jordan. Environmental Pollution. 2006;140(3):387–394. doi: 10.1016/j.envpol.2005.08.023. [DOI] [PubMed] [Google Scholar]
- 30.Tariq SR, Shah MH, Shaheen N, Khalique A, Manzoor S, Jaffar M. Multivariate analysis of trace metal levels in tannery effluents in relation to soil and water: a case study from Peshawar, Pakistan. Journal of Environmental Management. 2006;79(1):20–29. doi: 10.1016/j.jenvman.2005.05.009. [DOI] [PubMed] [Google Scholar]
- 31.Slavkovic L, Skrbic B, Miljevic N. Antonije Onjia, Principal component analysis of trace elements in industrial soils. Environmental Chemistry Letters. 2004;2:105–108. [Google Scholar]
- 32.Möller A, Müller HW, Abdullah A, Abdelgawad G, Utermann J. Urban soil pollution in Damascus, Syria: concentrations and patterns of heavy metals in the soils of the Damascus Ghouta. Geoderma. 2005;124(1-2):63–71. [Google Scholar]
- 33.Martley E, Gulson BL, Pfeifer HR. Metal concentrations in soils around the copper smelter and surrounding industrial complex of Port Kembla, NSW, Australia. Science of the Total Environment. 2004;325(1–3):113–127. doi: 10.1016/j.scitotenv.2003.11.012. [DOI] [PubMed] [Google Scholar]
- 34.Dinkins CP, Jones C. Soil sampling strategies. A self learning resource from Montana State University extension. Agriculture and Natural Resource. 2008;9:221–230. [Google Scholar]
- 35.Skoog DA, Holler FJ, Crouch SR. Principles of Instrumental Analysis. 6th edition. Brooks/Cole; 2007. [Google Scholar]
- 36.Brown RJC, Yardley RE, Brown AS, Milton MJT. Sample matrix and critical interference effects on the recovery and accuracy of concentration measurements of arsenic in ambient particulate samples using ICP-MS. Journal of Analytical Atomic Spectrometry. 2004;19(5):703–705. [Google Scholar]
- 37.Acosta JA, Faz A, Martínez-Martínez S, Arocena JM. Enrichment of metals in soils subjected to different land uses in a typical Mediterranean environment (Murcia City, southeast Spain) Applied Geochemistry. 2011;26(3):405–414. [Google Scholar]
- 38.Chopin EIB, Alloway BJ. Trace element partitioning and soil particle characterisation around mining and smelting areas at Tharsis, Ríotinto and Huelva, SW Spain. Science of the Total Environment. 2007;373(2-3):488–500. doi: 10.1016/j.scitotenv.2006.11.037. [DOI] [PubMed] [Google Scholar]
- 39.Soriano A, Pallarés S, Pardo F, Vicente AB, Sanfeliu T, Bech J. Deposition of heavy metals from particulate settleable matter in soils of an industrialised area. Journal of Geochemical Exploration. 2012;113:36–44. [Google Scholar]
- 40.Rodríguez S, Querol X, Alastuey A, et al. Comparative PM10-PM2.5 source contribution study at rural, urban and industrial sites during PM episodes in Eastern Spain. Science of the Total Environment. 2004;328(1–3):95–113. doi: 10.1016/S0048-9697(03)00411-X. [DOI] [PubMed] [Google Scholar]
- 41.Deepali KK, Gangwar K. Metals concentration in textile and tannery effluents, associated soils and ground water. New York Science Journal. 2010;3(4):82–89. [Google Scholar]
- 42.Jordán MM, Montero MA, Pina S, García-Sánchez E. Mineralogy and distribution of Cd, Ni, Cr, and Pb in biosolids-amended soils from castellón province (NE, Spain) Soil Science. 2009;174(1):14–20. [Google Scholar]
- 43.Krishna AK, Govil PK. Heavy metal distribution and contamination in soils of Thane-Belapur industrial development area, Mumbai, Western India. Environmental Geology. 2005;47(8):1054–1061. [Google Scholar]
- 44.Smichowski P, Marrero J, Gómez D. Inductively coupled plasma optical emission spectrometric determination of trace element in PM10 airborne particulate matter collected in an industrial area of Argentina. Microchemical Journal. 2005;80(1):9–17. [Google Scholar]
- 45.Fakayode SO, Onianwa PC. Heavy metal contamination of soil, and bioaccumulation in Guinea grass (Panicum maximum) around Ikeja Industrial Estate, Lagos, Nigeria. Environmental Geology. 2002;43(1-2):145–150. [Google Scholar]
- 46.Srinivasa Gowd S, Ramakrishna Reddy M, Govil PK. Assessment of heavy metal contamination in soils at Jajmau (Kanpur) and Unnao industrial areas of the Ganga Plain, Uttar Pradesh, India. Journal of Hazardous Materials. 2010;174(1–3):113–121. doi: 10.1016/j.jhazmat.2009.09.024. [DOI] [PubMed] [Google Scholar]
- 47.Paulino SA, Cirilo JV, Quiterio SL, Arbilla G, Escaleira V. Analysis of the impact of emission from the peterochemical complex in Campos Eliseos on the air quakity of air basin III. Brazil. Journal of Petroleum and Gas. 2009;3(2):67–74. [Google Scholar]
- 48.Toledo VE, Almeida PB, Quiterio SL, et al. Evaluation of levels, sources and distribution of toxic elements in PM10 in a suburban industrial region, Rio de Janeiro, Brazil. Environmental Monitoring and Assessment. 2008;139(1–3):49–59. doi: 10.1007/s10661-007-9815-y. [DOI] [PubMed] [Google Scholar]
- 49.Lim JM, Lee JH, Moon JH, Chung YS, Kim KH. Airborne PM10 and metals from multifarious sources in an industrial complex area. Atmospheric Research. 2010;96(1):53–64. [Google Scholar]
- 50.Kim MK, Jo WK. Elemental composition and source characterization of airborne PM10 at residences with relative proximities to metal-industrial complex. International Archives of Occupational and Environmental Health. 2006;80(1):40–50. doi: 10.1007/s00420-006-0102-y. [DOI] [PubMed] [Google Scholar]
- 51.Manalis N, Grivas G, Protonotarios V, Moutsatsou A, Samara C, Chaloulakou A. Toxic metal content of particulate matter (PM10), within the Greater Area of Athens. Chemosphere. 2005;60(4):557–566. doi: 10.1016/j.chemosphere.2005.01.003. [DOI] [PubMed] [Google Scholar]
- 52.Dawodu FA, Ajanaku KO. Evaluation of the effects of Brewery Effluents disposal on public water bodies in Nigeria. Aqua Environmental Toxicology. 2008;31:25–29. [Google Scholar]
- 53.Ipeaiyeda AR, Onianwa PC. Impact of brewery effluent on water quality of the Olosun river in Ibadan, Nigeria. Chemistry and Ecology. 2009;25(3):189–204. [Google Scholar]
- 54.Yusuff RO, Sonibare JA. Characterization of textile industries’ effluents in Kaduna, Nigeria and pollution implications. GLOBAL NEST: The International Journal. 2005;6(3):212–221. [Google Scholar]
- 55.IUPAC. Compendium of Chemical Terminology. 2nd edition. The “Gold Book”; 1997. [Google Scholar]
- 56.Tuchschmid MP, Dietrich V, Richner P, et al. Federal Office of Environment, Forests and Landscape. Berne, Switzerland: BUWAL; 1995. (Umweltmaterialien no. 32). [Google Scholar]
- 57.Wilmoth RC, Hubbard SJ, Burckle JO, Martin JF. Production and processing of metals: their disposal and future risks. In: Merian E, editor. Metals and Their Compounds in the Environment, Occurrence, Analysis and Biological Relevance. Vol. 23. Weinheim, Germany: VCH; 1991. pp. 19–65. [Google Scholar]
- 58.Dumontet S, Levesque M, Mathur SP. Limited downward migration of pollutant metals (Cu, Zn, Ni, and Pb) in acidic virgin peat soils near a smelter. Water, Air, & Soil Pollution. 1990;49(3-4):329–342. [Google Scholar]
- 59.Kabala C, Singh BR. Fractionation and mobility of copper, lead, and zinc in soil profiles in the vicinity of a copper smelter. Journal of Environmental Quality. 2001;30(2):485–492. doi: 10.2134/jeq2001.302485x. [DOI] [PubMed] [Google Scholar]
- 60.McMartin I, Henderson PJ, Plouffe A, Knight RD. Comparison of Cu-Hg-Ni-Pb concentrations in soils adjacent to anthropogenic point sources: examples from four Canadian sites. Geochemistry. 2002;2(1):57–74. [Google Scholar]
- 61.Šichorová K, Tlustoš P, Száková J, Kořínek K, Balík J. Horizontal and vertical variability of heavy metals in the soil of a polluted area. Plant, Soil and Environment. 2004;50(12):525–534. [Google Scholar]
- 62.Rawlins BG, Lark RM, Webster R, O’Donnell KE. The use of soil survey data to determine the magnitude and extent of historic metal deposition related to atmospheric smelter emissions across Humberside, UK. Environmental Pollution. 2006;143(3):416–426. doi: 10.1016/j.envpol.2005.12.010. [DOI] [PubMed] [Google Scholar]
- 63.Susaya J, Kim KH, Jung MC. The impact of mining activities in alteration of As levels in the surrounding ecosystems: an encompassing risk assessment and evaluation of remediation strategies. Journal of Hazardous Materials. 2010;182(1–3):427–438. doi: 10.1016/j.jhazmat.2010.06.050. [DOI] [PubMed] [Google Scholar]
- 64.Pérez-Sirvent C, García-Lorenzo ML, Martínez-Sánchez MJ, Navarro MC, Marimón J, Bech J. Metal-contaminated soil remediation by using sludges of the marble industry: toxicological evaluation. Environment International. 2007;33(4):502–504. doi: 10.1016/j.envint.2006.11.003. [DOI] [PubMed] [Google Scholar]
- 65.Kabata-Pendias A, Pendias H. Trace Elements in Soils and Plants. Boca Raton, Fla, USA: CRC Press; 1992. [Google Scholar]
- 66.Koljonen T. Geochemical Atlas of Finland, Part 2: Till. Espoo, Finland: Geological Survey of Finland; 1992. [Google Scholar]
- 67.Henderson PJ, McMartin I, Hall GE, Percival JB, Walker DA. The chemical and physical characteristics of heavy meals in humus and till in the vicinity of the base metal smelter at Flin Flon, Manitoba, Canada. Environmental Geology. 1998;34(1):39–58. [Google Scholar]
- 68.McMartin I, Henderson PJ, Nielsen E. Impact of a base metal smelter on the geochemistry of soils of the Flin Flon region, Manitoba and Saskatchewan. Canadian Journal of Earth Sciences. 1999;36(2):141–160. [Google Scholar]
- 69.Kaasalainen M, Yli-Halla M. Use of sequential extraction to assess metal partitioning in soils. Environmental Pollution. 2003;126(2):225–233. doi: 10.1016/s0269-7491(03)00191-x. [DOI] [PubMed] [Google Scholar]
- 70.Franzin WG, McFarlane GA, Lutz A. Atmospheric fallout in the vicinity of a base metal smelter at Flin Flon, Manitoba, Canada. Environmental Science and Technology. 1979;13(12):1513–1522. [Google Scholar]
- 71.Kelley JA, Jaffe DA, Baklanov A, Mahura A. Heavy metals on the Kola Peninsula: aerosol size distribution. Science of the Total Environment. 1995;160-161:135–138. [Google Scholar]
- 72.Rasmussen PE. Long-range atmospheric transport of trace metals: the need for geoscience perspectives. Environmental Geology. 1998;33(2-3):96–108. [Google Scholar]
- 73.Garmash GA. Distribution of heavy metals in soils near metallurgical plants. Soviet Soil Science. 1985;17(1):80–85. [Google Scholar]
- 74.Stigter JB, De Haan HPM, Guicherit R, Dekkers CPA, Daane ML. Determination of cadmium, zinc, copper, chromium and arsenic in crude oil cargoes. Environmental Pollution. 2000;107(3):451–464. doi: 10.1016/s0269-7491(99)00123-2. [DOI] [PubMed] [Google Scholar]
- 75.Hutchinson TC, Collins FW. Effect of H+ ion activity and Ca2+ on the toxicity of metals in the environment. Water, Air, & Soil Pollution. 1977;7:421–429. [Google Scholar]
- 76.Malarkodi M, Krishnasamy R, Kumaraperumal R, Chitdeshwari T. Characterization of heavy metal contaminated soils of Coimbatore district in Tamil Nadu. Journal of Agronomy. 2007;6(1):147–151. [Google Scholar]
- 77.Bosnic M, Buljan J, Daniels RP. Pollutants in tannery effluents US/RAS/92/120, UNIDO Regional program for pollution control in Tanning industry in South-East, 2000.
- 78.Alvarez-Bernal D, Contreras-Ramos SM, Trujillo-Tapia N, Olalde-Portugal V, Frías-Hernández JT, Dendooven L. Effects of tanneries wastewater on chemical and biological soil characteristics. Applied Soil Ecology. 2006;33(3):269–277. [Google Scholar]
- 79.Banat KM, Howari FM, Al-Hamad AA. Heavy metals in urban soils of central Jordan: should we worry about their environmental risks? Environmental Research. 2005;97(3):258–273. doi: 10.1016/j.envres.2004.07.002. [DOI] [PubMed] [Google Scholar]
- 80.Reimann C. Chemical Elements in the Environment. Berlin, Germany: Springer; 1998. [Google Scholar]
- 81. Australian Soil Resource Information System (ASRIS), 2009, http://www.asris.csiro.au/index_other.html.
- 82. Ministry of the Environment, Japan. Soil Contamination Countermeasures, 2003, http://www.env.go.jp/en/water/soil/contami_cm.pdf.
- 83.Taiwan EPA. Soil and Groundwater Pollution Remediation Act. 2001. The regulation of trace elements in soils of Taiwan. http://ww2.epa.gov.tw/SoilGW/english_web/laws.htm. [Google Scholar]
- 84.Yukselen MA. Characterization of heavy metal contaminated soils in Northern Cyprus. Environmental Geology. 2002;42(6):597–603. [Google Scholar]
- 85.European Community Directive. Protection of the environment, and in particular of the soil, when sewage sludge is used in agriculture. Journal European Commission. 1986;181:6–12. [Google Scholar]
- 86.Ewers V. Standards, guidelines and legislative regulations concerning metals and their compounds. In: Merian E, editor. Metals and Their Compounds in the Environment: Occurrence, Analysis and Biological Relevance. Weinheim, Germany: VCH; 1991. [Google Scholar]
- 87.BOE. Royal Decree 1310/1990 of 29 October, which regulates the use of sewage sludge in agriculture. BOE No. 262 de 1 de noviembre de 1990, Madrid, Spain, pp. 32339–32340, 1990.
- 88.Louekari K, Salminen S. Intake of heavy metals from foods in Finland, West Germany and Japan. Food Additives and Contaminants. 1986;3(4):355–362. doi: 10.1080/02652038609373602. [DOI] [PubMed] [Google Scholar]
- 89.Bourgoin F. Soil protection in French environmental law. The Journal for European Environmental and Planning Law. 2006;3:204–211. [Google Scholar]
- 90.UK Environment Agency. Using Soil Guideline Values Better Regulation. Science Programme Science report: SC050021/SGV introduction, 2009.
- 91. USEPA. PART 503—Standards for the use or disposal of sweage sludge. Electronic Code of Federal Regulations (e-CFR), 2007, http://www.epa.gov/epacfr40/chapt-I.info/chi-toc.htm.
- 92. Ministere de l’Environmement du Quebec, Politique de Protection des Soil et de Rehabilitation des Terrains Contamines. Publications of the MEQ, Collection Terrains Contamines, Quebec, Canada, 2001.
- 93.Piotrowska M, Dudka S, Ponce-Hernandez R, Witek T. The spatial distribution of lead concentrations in the agricultural soils and main crop plants in Poland. Science of the Total Environment. 1994;158:147–155. [Google Scholar]
- 94.Yaylali-Abanuz G. Heavy metal contamination of surface soil around Gebze industrial area, Turkey. Microchemical Journal. 2011;99(1):82–92. [Google Scholar]
- 95.Smith B. A Workbook for Pollution Prevention by Source Reduction in Textile Wet Processing. Pollution Prevention Pays Program of the North Carolina Division of Environmental Management, 1988.
- 96.Müller G. Index of geo-accumulation in sediments of the Rhine River. Geojournal. 1969;2:108–118. [Google Scholar]
- 97.Loska K, Wiechulła D, Korus I. Metal contamination of farming soils affected by industry. Environment International. 2004;30(2):159–165. doi: 10.1016/S0160-4120(03)00157-0. [DOI] [PubMed] [Google Scholar]
- 98.Ahiamadjie H, Adukpo OK, Tandoh JB, et al. Determination of the elemental contents in soils around Diamond Cement Factory, Aflao. Research Journal of Environmental and Earth Sciences. 2011;3(1):46–50. [Google Scholar]