

Abstract
Motivation: The NanoString nCounter Platform is a new and promising technology for measuring nucleic acid abundances. It has several advantages over PCR-based techniques, including avoidance of amplification, direct sequence interrogation and digital detection for absolute quantification. These features minimize aspects of experimental error and hold promise for dealing with challenging experimental conditions such as archival formalin-fixed paraffin-embedded samples. However, systematic inter-sample technical artifacts caused by variability in sample preservation, bio-molecular extraction and platform fluctuations must be removed to ensure robust data.
Results: To facilitate this process and to address these issues for NanoString datasets, we have written a pre-processing package called NanoStringNorm in the R statistical language. Key features include an extensible environment for method comparison and new algorithm development, integrated gene and sample diagnostics, and facilitated downstream statistical analysis. The package is open-source, is available through the CRAN package repository, includes unit-tests to ensure numerical accuracy, and provides visual and numeric diagnostics.
Availability: http://cran.r-project.org/web/packages/NanoStringNorm
Contact: paul.boutros@oicr.on.ca
Supplementary information: Supplementary data are available at Bioinformatics online.
1 INTRODUCTION
The NanoString® nCounter Platform is an emerging medium-throughput technology for measuring mRNA and miRNA abundances and for assessing copy number variants (Geiss et al., 2008). NanoString technology has several potential benefits relative to microarray- and PCR-based technologies. First, its parallelized nature and small number of manual manipulations generate data faster than many PCR-based methods. Second, the hybridization method used directly interrogates target sequences, avoiding the need for bias-prone amplification steps, even for low-abundance transcripts. Third, measurement is achieved using digital detection of uniquely bar-coded probes, providing absolute quantification.
This combination of advantages is thought to provide favorable conditions for testing formalin-fixed paraffin-embedded (FFPE) samples. FFPE preparation is a standard protocol for the long-term storage of human clinical specimens. Despite some positive reports (Hui et al., 2009), the degradation of RNA in FFPE samples challenges existing mRNA quantitation assays. The ability to reliably process FFPE samples would greatly facilitate retrospective studies.
Accordingly there has been a dramatic increase in the uptake of NanoString technology in our research facility. In some cases, it is used as a validation procedure; in others as a discovery tool using candidate genes. A common rationale is the desire to exploit large, clinically well-annotated FFPE collections. Since NanoString is a new technology, many details of its analysis remain unexplored: optimal methods of data pre-processing are unknown, although this is well-known to impact biological conclusions (Shippy et al., 2006).
NanoString currently recommends pre-processing using Microsoft Excel spreadsheet functions. This has significant limitations. First, manual analysis is both hard to reproduce and prone to errors (McCullough and Heiser, 2006): gene- and sample-name auto-formatting are well-known issues (Zeeberg et al., 2004). Second, macros and worksheets cannot easily be adapted to changing experimental designs or pre-processing methods: spreadsheet software lacks the sophisticated statistical tools common in bioinformatics (e.g. survival or mixed models). Third, it is highly desirable to integrate workflows in a single environment, and downstream analyses are typically performed in statistical environments. Fourth, the quality of data pre-processing requires careful assessment with data visualizations that are difficult to automate using spreadsheets.
For these reasons we have developed an open-source R package, called NanoStringNorm, to implement a reference set of pre-processing techniques. We chose the R statistical environment to allow integration with BioConductor libraries (Gentleman et al., 2004), and to exploit its data-visualization (Chen and Boutros, 2011) and statistical tools. NanoStringNorm outlines a pipeline of pre-processing steps with multiple options at each stage and provides a framework for method development and comparison. By standardizing code and automating error capture, NanoStringNorm will enable more reproducible and robust analysis of NanoString datasets.
2 IMPLEMENTATION
2.1 Pre-processing pipeline
NanoString provides analysis guidelines for miRNA and mRNA assays online, which provide detailed instructions on options available for pre-processing of the output of an nCounter. Pre-processing involves five independent, but ordered, steps. Complete equations for each algorithm are given in Supplementary Material.
2.2 Probe-level background correction
The first step is not discussed in the NanoString guidelines, but it is mentioned in nCounter documentation: during some runs, probes are flagged for correction. Adjustment values are annotated in text files which can be acquired from core facilities. Correction factors are multiplied by the maximum positive control value, then subtracted from the raw counts, per sample.
2.3 Code-count normalization
The second step accounts for lane-by-lane variation of the nCounter platform. A series of exogenous probes of known concentration are used, allowing observed variation to be attributed specifically to the assay. Normalization occurs by summarizing (i.e. mean, median, sum or geometric mean) the positive control counts and adjusting samples by a factor relative to other samples.
2.4 Background correction
Even though data are presented as absolute counts, detectable levels of non-specific binding remain, as measured by negative controls. The background level is calculated as an aggregate summary of six to eight control probes with no target transcript. The calculated background level for each sample is then subtracted from the adjusted probe value. Negative values are scaled to zero as a baseline for no expression. The mean of negative controls is a non-stringent correction that maximizes sensitivity in exchange for increased false positives. Alternatively, the maximum or mean plus two SDs can be used to prevent spurious results.
2.5 Sample content normalization
Sample RNA input variation is caused by laboratory and pipetting anomalies independent of NanoString assay variation. Using housekeeping genes is one common method of removing this bias. For miRNAs and FFPE samples, it is often unclear how such genes should be selected. Alternative approaches include summarizing all genes, or focusing on a set of highly expressed genes. Sample content normalization factors are calculated similar to code count ones: a group of normalization genes is selected, summarized (e.g. geometric mean, etc.) and a sample adjustment factor is calculated.
2.6 Concentration prediction
A convenience function has been added to transform counts to concentrations using positive controls: fitting of positive control concentrations is used to predict endogenous probe concentrations.
2.7 Best normalization
To evaluate the best pre-processing method for specific code sets and study designs, a function was created to rank methods based on the coefficient of variation of control probes, the intra-class correlation of replicate groups and the fold change accuracy for primary traits of interest. This function is suited for studies with technical replication, such as titrations.
2.8 Software engineering decisions
The package is highly modular, to maximize extensibility. Gene and sample summary plots and diagnostics (Fig. 1) are auto-generated and flag experimental artifacts. Unit-tests are continuously added to diagnose and prevent numerical errors.
Fig. 1.
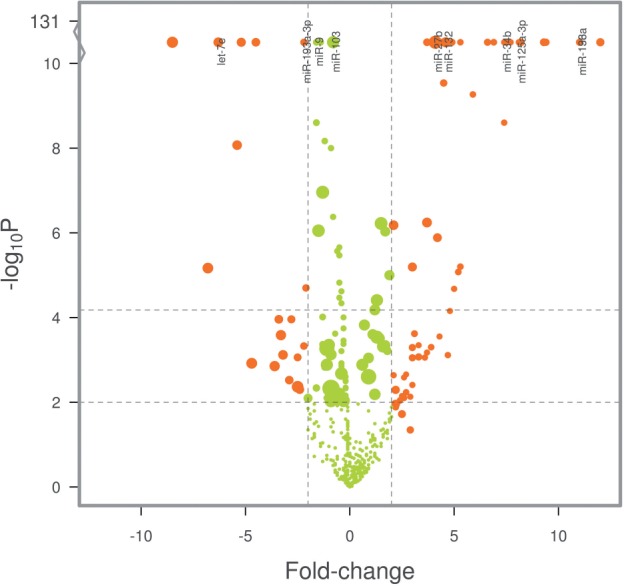
NanoStringNorm volcano plot showing differential expression caused by batch-effects between experiments on two days. Point-size reflects mean counts per probe. Naive co-normalization introduces bias
2.9 Visual and numeric diagnostics
We developed extensive diagnostics to enhance interpretation, with a particular focus on experimental quality and reliability. NanoStringNorm flags potential systematic batch-effects, identifies background artifacts and assesses negative/positive-controls. Each flag is associated with plots (Supplementary Fig. S3) and all results, diagnostics and differential expression can be output in interactive Google motion charts (Supplementary Fig. S4).
3 RESULTS AND CONCLUSIONS
For a variety of reasons, NanoString usage is rising; making standardized approaches to data analysis increasingly critical. We have therefore developed an extensible, open-source R package to automate pre-processing. Our package enables a wide range of pre-processing approaches to be evaluated, and will be updated as improved techniques are developed. For example, NanoString data can be processed and statistically analyzed based on the negative binomial distribution (Brumbaugh et al., 2011). Similar modeling, integrated into the NanoStringNorm API, will make NanoString data broadly useful for clinical applications. Future work will account for correlation among experimental design features such as replicates, tissue subgroups and inter-experimental batch-effects.
Supplementary Material
ACKNOWLEDGEMENTS
We thank the Boutros lab for support and software testing.
Funding: Ontario Institute for Cancer Research (to P.C.B. and B.G.W.); Ontario Ministry of Health and Long Term Care (OMOHLTC; to B.G.W. and F.-F.L.); Dr Mariano Elia Chair in Head & Neck Cancer Research; philanthropic support from the Wharton family, Joe's Team and Gordon Tozer. Views expressed do not necessarily reflect those of the OMOHLTC.
Conflict of Interest: none declared.
REFERENCES
- Brumbaugh C.D., et al. Normalization and differential expression analysis of NanoString nCounter data. BMC Bioinformatics. 2011;12:479. doi: 10.1186/1471-2105-12-479. [DOI] [PMC free article] [PubMed] [Google Scholar]
- Chen H., Boutros P.C. VennDiagram: a package for the generation of highly customizable Venn and Euler diagrams in R. BMC Bioinformatics. 2011;12:35. doi: 10.1186/1471-2105-12-35. [DOI] [PMC free article] [PubMed] [Google Scholar]
- Geiss G.K., et al. Direct multiplexed measurement of gene expression with color-coded probe pairs. Nat. Biotechnol. 2008;26:317–325. doi: 10.1038/nbt1385. [DOI] [PubMed] [Google Scholar]
- Gentleman R.C., et al. Bioconductor: open software development for computational biology and bioinformatics. Genome Biol. 2004;5:R80. doi: 10.1186/gb-2004-5-10-r80. [DOI] [PMC free article] [PubMed] [Google Scholar]
- Hui A.B.Y., et al. Robust global micro-RNA profiling with formalin-fixed paraffin-embedded breast cancer tissues. Lab. Invest. 2009;89:597–606. doi: 10.1038/labinvest.2009.12. [DOI] [PubMed] [Google Scholar]
- McCullough B.D., Heiser D.A. On the accuracy of statistical procedures in Microsoft Excel 2007. Comput. Stat. Data Anal. 2006;52:4570–4578. [Google Scholar]
- Shippy R., et al. Using RNA sample titrations to assess microarray platform performance and normalization techniques. Nat. Biotechnol. 2006;24:1123–1131. doi: 10.1038/nbt1241. [DOI] [PMC free article] [PubMed] [Google Scholar]
- Zeeberg B.R., et al. Mistaken identifiers: gene name errors can be introduced inadvertently when using Excel in bioinformatics. BMC Bioinformatics. 2004;5:80. doi: 10.1186/1471-2105-5-80. [DOI] [PMC free article] [PubMed] [Google Scholar]
Associated Data
This section collects any data citations, data availability statements, or supplementary materials included in this article.