Abstract
We have developed ethylenedicysteine-glucosamine (ECG) as an alternative to 18F-fluoro-2-deoxy-D-glucose (18F-FDG) for cancer imaging. ECG localizes in the nuclear components of cells via the hexosamine biosynthetic pathway. This study was to evaluate the feasibility of imaging mesothelioma with 99mTc-ECG and 68Ga-ECG. ECG was synthesized from thiazolidine-4-carboxylic acid and 1,3,4,6-tetra-O-acetyl-2-amino-D-glucopyranose, followed by reduction in sodium and liquid ammonia to yield ECG (52%). ECG was chelated with 99mTc/tin (II) and 68Ga/69Ga chloride for in vitro and in vivo studies in mesothelioma. The highest tumor uptake of 99mTc-ECG is 0.47 at 30 min post injection, and declined to 0.08 at 240 min post injection. Tumor uptake (%ID/g), tumor/lung, tumor/blood, and tumor/muscle count density ratios for 99mTc-ECG (30–240 min) were 0.47 ± 0.06 to 0.08 ± 0.01; 0.71 ± 0.07 to 0.85 ± 0.04; 0.47 ± 0.03 to 0.51 ± 0.01, and 3.49 ± 0.24 to 5.06 ± 0.25; for 68Ga-ECG (15–60 min) were 0.70 ± 0.06 to 0.92 ± 0.08; 0.64 ± 0.05 to 1.15 ± 0.08; 0.42 ± 0.03 to 0.67 ± 0.07, and 3.84 ± 0.52 to 7.00 ± 1.42; for 18F-FDG (30–180 min) were 1.86 ± 0.22 to 1.38 ± 0.35; 3.18 ± 0.44 to 2.92 ± 0.34, 4.19 ± 0.44 to 19.41 ± 2.05 and 5.75 ± 2.55 to 3.33 ± 0.65, respectively. Tumor could be clearly visualized with 99mTc-ECG and 68Ga-ECG in mesothelioma-bearing rats. 99mTc-ECG and 68Ga-ECG showed increased uptake in mesothelioma, suggesting they may be useful in diagnosing mesothelioma and also monitoring therapeutic response.
1. Introduction
Drug discovery is accelerating due to mapping of molecular targets and the rapid synthesis of high-throughput in vitro testing of compounds in their early stage of the drug development process. The development of radiolabeled biochemical compounds, understanding molecular pathways and imaging devices to detect the radioactivity by external imaging, has expanded the use of nuclear molecular imaging studies in drug development. Nuclear molecular imaging provides vascular angiogenesis, cellular translational, and transcriptional information. The important applications in molecular imaging in oncology are at the characterization of tumors (degree of malignancy), optimal dosing determination, differentiation (i.e., inflammation/infection versus recurrence, sensitive versus resistant, low versus high grade), and prediction of treatment response (i.e., select patient who may respond to therapy). Thus, molecular imaging helps to control and monitor dosage for increased safety and effectiveness. The focus of molecular imaging in oncology is to identify tumor-specific markers and apply these markers for evaluation of patient response to treatment. Nuclear molecular imaging could noninvasively assess diseases treatment endpoints which used to rely almost exclusively on biopsies and histopathological assays. 18F-Fluoro-deoxy-glucose (18F-FDG), a gold standard for molecular imaging, utilizes glucose transporters and hexokinase phosphorylated processes for tumor imaging [1]. However, 18F-FDG has several limitations that give rise to false positive/negative results [2]. 18F-FDG has poor differentiation between tumor and inflammation/infection due to its high uptake in granulocytes and macrophages. Therefore, it is amenable to develop a radiotracer as an alternative for better differentiation in tumor imaging.
Glucosamine enters into cells via hexosamine biosynthetic pathway and its regulatory products of glucosamine-6-phosphate mediate insulin activation, downstream signaling, glycosylation, and tumor growth. In the hexosamine pathway, upregulated glucose transporters induce overexpression of glutamine: fructose-6-phosphate amidotransferase (GFAT). GFAT uses the amide group of glutamine to convert fructose 6-phosphate to glucosamine 6-phosphate and forms hexosamine products [3]. Phosphorylated glucosamine interacts with uridine diphosphate (UDP) to form UDPN-acetylglucosamine (UDP-GlcNAc). The dynamic glycosylation of serine or threonine residues on nuclear and cytosolic proteins by O-linked protein N-acetylglucosamine (O-GlcNAc) transferase is abundant in all multicellular eukaryotes. Glycosylation is a part of posttranslational modification and appears to modify a large number of nucleocytoplasmic proteins. O-GlcNAc transferase (OGT) activity is exquisitely responsive to intracellular UDP-GlcNAc and UDP concentrations, which are in turn highly sensitive to glucose concentrations and other stimuli [4]. In cell nucleus, the ubiquitous transcription factor Sp1 is extensively modified by O-GlcNAc. Sp1 becomes hyperglycosylated in response to hyperglycemia or elevated glucosamine [4]. Because O-GlcNAc is involved in hexosamine pathway and nucleus activity, it becomes an attractive imaging agent for differential diagnosis in cancers.
68Ga (89% positron, 68 min half-life) and 99mTc (140 keV, 6 hrs half-life) are obtained from generators on-site and have significant commercial interest. 68Ga and 99mTc could provide serial images which are pivotal to clinical applications by positron emission tomography (PET) and single photon emission-computed tomography (SPECT). PET/SPECT/CT is better than PET and SPECT alone because multiple slices by CT and serial images by PET and SPECT provide a better delineation in tumor volumes. L,L-ethylenedicysteine (EC), a family of bisaminoethanethiol, is known to form stable metal complexes [5, 6]. The strong metal complexing property of such EC systems is also applied for labeling of small molecules, proteins, and peptides after conjugation to EC derivatives. EC-technology platform has shown to coordinate radiometals and metals for image-guided target assessment, theranostic applications, and the selection of patient for treatment [7–19].
Mesothelioma is a cancer caused by exposure to asbestos. Asbestos fibers have been shown to alter the function and secretory properties of macrophages, ultimately creating conditions which favor the development of mesothelioma. Following asbestos phagocytosis, macrophages generate increased amounts of hydroxyl radicals which are thought to promote asbestos carcinogenicity. Furthermore, genetic alterations in asbestos-activated macrophages may result in the release of potent mesothelial cell mitogens such as platelet-derived growth factor and transforming growth factor-β which, in turn, may induce the chronic stimulation and proliferation of mesothelial cells after injury by asbestos fibers. Although there have been some modest improvements in prognosis from newer chemotherapies and multimodality treatments, the prognosis for malignant mesothelioma remains poor. The standard approaches such as radiation, chemotherapy, and surgery have been investigated to treat patients with malignant pleural mesothelioma. Treatment of malignant mesothelioma at earlier stages has a better prognosis, but cures are exceedingly rare. Immunohistochemical analysis has shown that GlcNAc-specific binding sites are useful for distinguishing metastatic carcinoma from mesothelioma in human [20]. Subsequently, EC-glucosamine (ECG), a glucose analogue, is developed to trace the glucose transport system and glucosamine binding sites in mesothelioma. 99mTc-ECG and 68Ga-ECG may assess the staging, restaging, and response monitoring in mesothelioma for early and right medication of this disease.
2. Materials and Methods
2.1. General
All chemicals and solvents were obtained from Sigma-Aldrich (St. Louis, MO). Nuclear magnetic resonance (NMR) was performed on Bruker 300 MHz Spectrometer, and mass spectra were performed on Waters Q-TOF Ultima Mass Spectrometer (Milford, MA) at the core facility at the University of Texas MD Anderson Cancer Center (UTMDACC, Houston, TX). Chemical shifts were reported in δ (ppm) and J values in Hertz. FDG was obtained from Department of Nuclear Medicine at UTMDACC.
2.2. Synthesis of ECG
2.2.1. Step 1: Synthesis of T-G-(Ac)4
To a solution of thiazolidine-4-carboxylic acid (T) (2.6 g, 0.02 mol) in DMF (20 mL) and 5.0 mL trimethylamine, 1-hydroxybenzotriazole hydrate 2.7 g (0.02 mol) was added. After 30 min, 1,3,4,6-tetra-O-acetyl-2-amino-α-D-glucopyranose hydrochloride (G-(Ac)4) (7.7 g, 0.02 mol), N,N′-di-cyclohexylcarbodiimide (DCC; 4.2 g, 0.02 mol), and 4-dimethylaminopyridine (DMAP; 1.2 g, 0.01 mol) were added to the mixture and stirred for overnight at room temperature. The solution was evaporated to dryness at high vacuum. Dichloromethane (CH2Cl2) (50 mL) was added to the residual and kept at 4°C for overnight, then filtered. The product was purified with silica gel by eluting with CH2Cl2/MeOH (95/5, V/V) to yield white product T-G-(Ac)4 4.08 g (44.2%). NMR and mass spectrometry were used to confirm the structure of T-G-(Ac)4.
2.2.2. Step 2: Reduction Reaction
Sodium was added piece by piece to a solution of T-G-(Ac)4 (4.08 g, 8.8 mmol) in liquid ammonia (170 g). The color of the solution was slowly changed to dark blue. After 30 minutes, a little of ammonium chloride was added. The liquid ammonia was removed by reduced pressure. The residual solid was triturated with methanol (100 mL). The solid was then filtered and washed with additional methanol (50 mL) to yield crude product 4.16 g. To obtain analytical pure ECG, the crude product (0.1 g) was dissolved in 1.0 mL of HCl (0.1 N) and purified with sephadex column by eluting with H2O. The aqueous fractions were combined and lyophilized to yield EC-G 0.029 g (46.7%). NMR, mass spectrometry, and HPLC were used to confirm the structure of ECG.
2.3. Synthesis of Cold Ga-ECG
69GaCl3 (20 mg, 0.11 mmol) in 0.2 mL H2O was added to a solution of ECG (60 mg, 0.1 mmol) in 0.5 mL H2O. The pH value was adjusted to 4-5 with 0.1 N NaOH (50 μL). The solution was heated for 30 min at 60°C. The product was purified by a sephadex column eluting with H2O to yield Ga-ECG. After lyophilization, Ga-ECG was obtained as white solid (52 mg, 78.1%). NMR, mass spectrometry, and HPLC were used to confirm the structure of 69Ga-ECG.
2.4. Radiosynthesis of 68Ga-ECG and 99mTc-ECG
68GaCl3 was obtained from a 68Ge/68Ga generator (Eckert Ziegler, Valencia, CA) eluted with 0.1 N HCl. 68GaCl3 (120 μL, 300 μCi) was added to the solution of ECG (1.2 mg) in 0.1 mL H2O, and pH value was adjusted to 4-5 with NaHCO3 (40 μL, 0.1 N). The solution was heated at 60°C for 15 min. Sodium pertechnetate (Na99mTcO4) was obtained from 99Mo/99mTc generator by Covidien (Houston, TX). Radiosynthesis of 99mTc-ECG was achieved by adding 99mTc-pertechnetate (40–50 mCi) into the lyophilized residue of ECG (5 mg) and tin (II) chloride (SnCl2, 100 μg). The complexation of ECG with 99mTc was carried out at pH 6.5. Radiochemical purity was determined by TLC (Waterman No. 1, Aldrich-Sigma, St. Louis, MO) eluted with saline. High-performance liquid chromatography (HPLC), equipped with a NaI detector and UV detector (210 nm), was performed on a C-18 reverse phase column (C18-extend, Agilent, Santa Clara, CA) eluted with acetonitrile/water (1 : 9, V/V) at a flow rate of 0.5 mL/min. HPLC of cold 69Ga-ECG was used to confirm the structure of 68Ga-ECG.
2.5. Biodistribution of Radiotracers in Mesothelioma-Bearing Rats
Female Fischer 344 rats (150 ± 25 g) (Harlan Sprague-Dawley, Indianapolis, IN) (n = 3 rats/time point) were inoculated with malignant pleural mesothelioma cells derived from the IL-45 cell line. Tumor cells (106 cells/rat) were injected (i.m.) into the hind legs. Studies were performed 14 to 17 days after inoculation when tumors were approximately 1 cm in diameter. In tissue distribution studies, each animal was injected (iv, 10 μCi/rat, 10 μg/rat) with 99mTc-ECG, 68Ga-ECG, and 18F-FDG. Rats were sacrificed at 0.5–4 hrs. The selected tissues were excised, weighed, and counted for radioactivity by using a gamma counter (Packard Instruments, Downers Grove, IL). The biodistribution of tracer in each sample was calculated as percentage of the injected dose per gram of tissue wet weight (%ID/g).
2.6. Scintigraphic Imaging Studies
Female Fischer 344 rats (150 ± 25 g) bearing malignant pleural mesothelioma (at hind legs) derived from the IL-45 cell line were used for imaging studies. Studies were performed 14 to 17 days after inoculation when tumors were approximately 1 cm in diameter. Scintigraphic images were obtained either from a micro-PET (Inveon) embedded in the gantries coordinate PET/CT data acquisition or from an M-gamma camera (Siemens Medical Systems, Inc., Hoffman Estates, IL) equipped with low-energy parallel-hole collimator. Each animal was administered with 99mTc-ECG (300 μCi/rat, iv), 68Ga-ECG, and 18F-FDG (400 μCi/rat, iv), and the images were obtained at 0.5–4 hrs. To demonstrate 68Ga-ECG could be used for image-guided therapy, the same mesothelioma-bearing rats (n = 3) at tumor volume 1.5 cm were treated with paclitaxel (20 mg/kg, iv, single injection). Prior to treatment and postpaclitaxel treatment on day 7, the tumor-bearing rats were imaged with 68Ga-ECG. Computer-outlined regions of interest (ROI) (counts per pixel) were used to determine tumor-to-background count density ratios for 99mTc-ECG. Computer outlined regions of interest (ROI) (counts per pixel) for tumor and muscle at the corresponding time interval were used to generate a dynamic plot for 68Ga-ECG and 18F-FDG. Dynamic plot was from 0 to 45 minutes. Paclitaxel was selected because it produced antiproliferative effects by inhibition of glucose transporters (Glut-1) in cell line studies [21]. Also, it has been reported that mesothelioma responds to paclitaxel treatment in the animal model [22].
3. Result
3.1. Chemistry
The synthetic scheme is shown in Figure 1. ECG was synthesized by two-step reactions. In the first step, thiazolidine-4-carboxylic acid (T) was reacted with 1,3,4,6-tetra-O-acetyl-2-amino-α-D-glucopyranose hydrochloride (G-(Ac)4) in the presence of 1-hydroxybenzotriazole hydrate, DCC, and DMAP. After purification, the yield of product T-G-(Ac)4 was 44.2%. 1H NMR (D2O, δ): 1.97–2.14 (m, 12H), 3.88 (t, 1H), 3.93 (s, 2H), 4.05–4.10 (m, 6H) 4.22–4.30 (m, 2H), 5.09 (t, 1H), 5.34 (t, 1H), 5.80 (d, 1H), 6.93 (d, 1H). 13C NMR (D2O, δ): 171.19, 171.00, 170.65, 169.35, 166.35, 141.76, 92.05, 82.45, 72.79, 72.02, 68.02, 61.73, 60.39, 53.21, 42.32, 20.84, 20.68, 20.58, 20.55. FAB MS m/z: 462.5.
Figure 1.
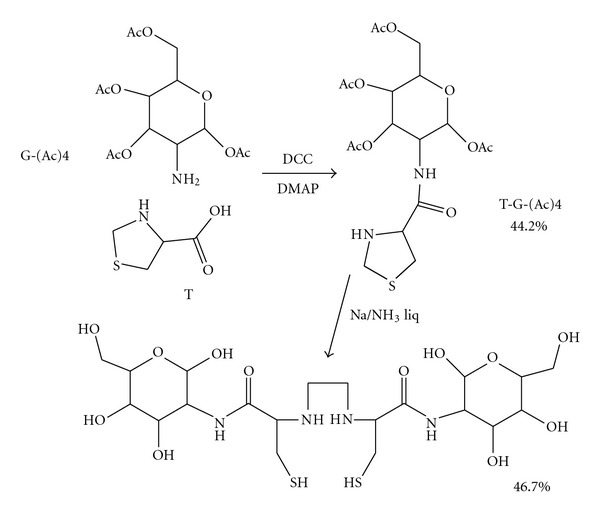
Efficient synthesis of ECG.
In the second step, T-G-(Ac)4 was reduced by sodium in liquid ammonia (Birch reduction). The crude product was purified with a sephadex column to yield ECG (46.7%). HPLC shows that purity is over 82%. 1H NMR (D2O, δ): 3.15–3.20 (m, 4H), 3.78–4.05 (m, 6H), 4.08–4.15 (m, 8H), 4.2-4.3 (d, 2H), 4.68–4.73 (d, 2H), 5.19–5.21 (d, 2H). 13C NMR (D2O, δ): 174.81, 174.56, 94.95, 90.87, 90.84, 75.96, 73.91, 73.85, 71.59, 70.71, 70.66, 70.10, 69.88, 60.72, 60.62, 56.72, 54.11, 23.33, 22.23, 21.96. FAB MS m/z: 591.
NMR of cold 69Ga-ECG was 1H NMR (D2O, δ): 2.94–3.38 (m, 8H), 3.43–3.65 (m, 4H), 3.50–3.80 (m, 10H), 3.92–4.02 (t, 2H), 4.23–4.34 (d, 2H), 5.15–5.34 (d, 2H), 13C NMR (D2O, δ): 175.51, 175.16, 95.55, 90.85, 90.67, 75.76, 74.90, 73.55, 71.59, 70.71, 70.66, 70.10, 69.88, 60.72, 60.62, 56.72, 54.11, 23.53, 22.83, 22.16. Radio-TLC and HPLC analyses of the purity of 68Ga-ECG and 99mTc-ECG were > 96% (Figures 2–4). HPLC of cold 69Ga-ECG was used to confirm the structure of 68Ga-ECG (Figure 3).
Figure 2.

TLC analysis of 68Ga-ECG using saline as an eluant. Radio-TLC analysis of the purity of 68Ga-ECG was > 96%.
Figure 4.
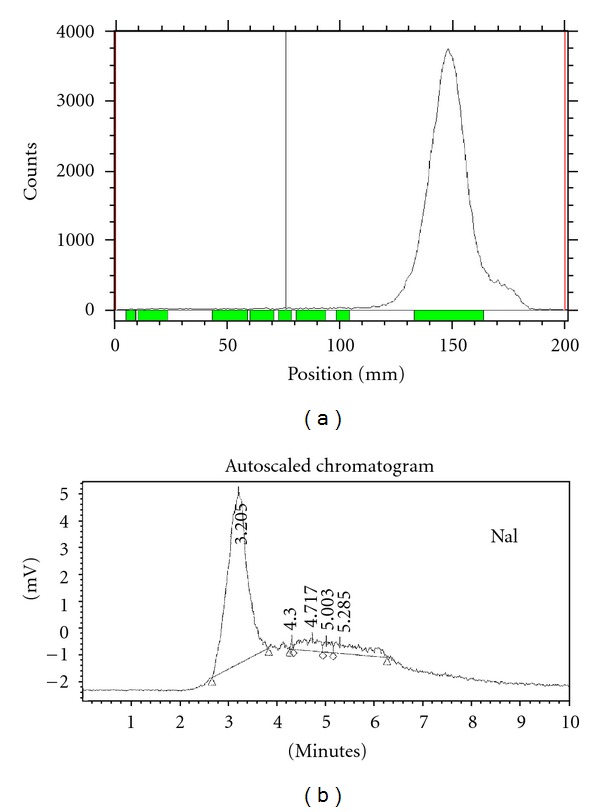
ITLC (a, in saline) and HPLC (b, NaI detector) analysis of 99mTc-ECG (mobile phase: H2O/acetonitrile, 9 : 1 V/V, flow rate: 0.5 mL/min, Column: C18-extend (Agilent), UV ABS: 210 nm). Radio-TLC and HPLC analyses of the purity of 99mTc-ECG were >96%.
Figure 3.
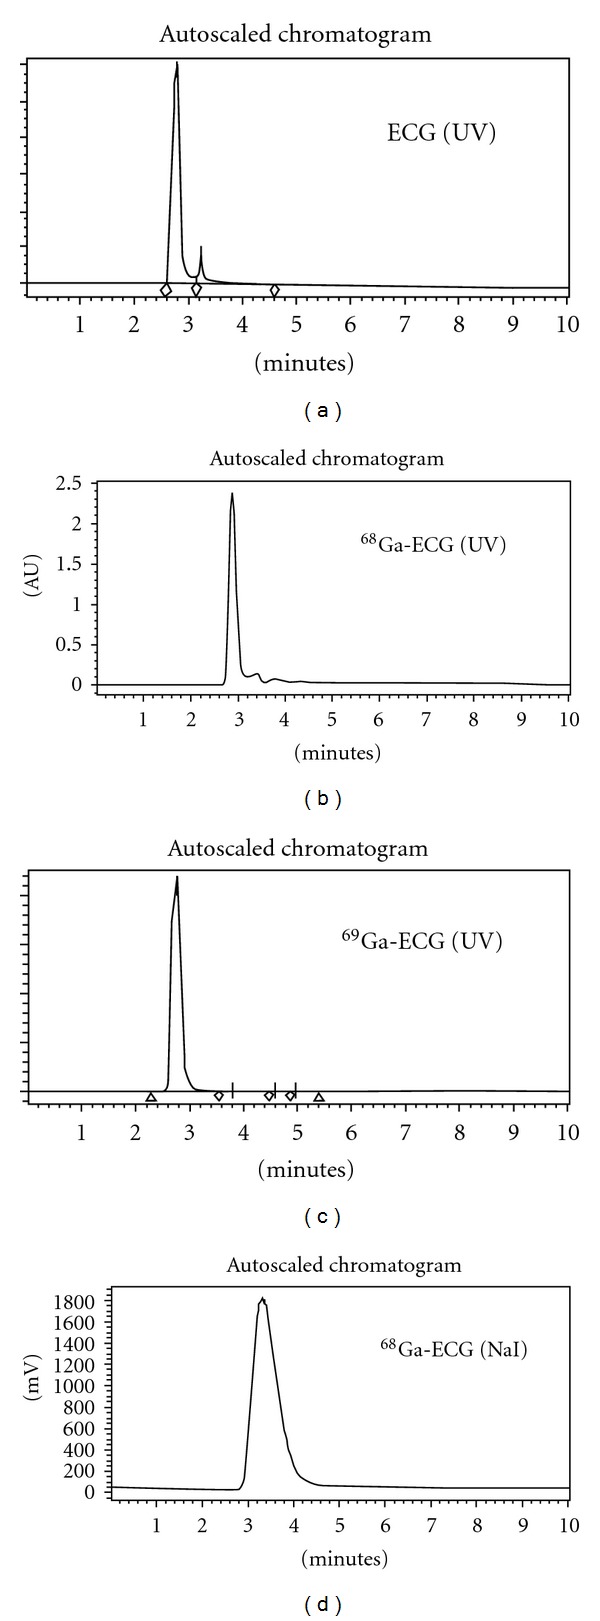
HPLC analysis of 68/69Ga-ECG and ECG (mobile phase: H2O/acetonitrile, 9 : 1 V/V, flow rate: 0.5 mL/min, column: C18-extend (Agilent), UV ABS 210 nm). HPLC analysis of the purity of 68Ga-ECG was >96%.
3.2. In Vivo Biodistribution Studies
Tumor and tissue uptake (%ID/g) of 68Ga-ECG, 99mTc-ECG and 18F-FDG are shown in Tables 1, 2, and 3. The highest tumor uptake of 99mTc-ECG is 0.47 at 30 min after injection, and declined to 0.08 at 240 min after injection. Tumor uptake (%ID/g), tumor/lung, tumor/blood, and tumor/muscle count density ratios for 99mTc-ECG (30–240 min) were 0.47 ± 0.06 to 0.08 ± 0.01, 0.71 ± 0.07 to 0.85 ± 0.04, 0.47 ± 0.03 to 0.51 ± 0.01, and 3.49 ± 0.24 to 5.06 ± 0.25; for 68Ga-ECG (15–60 min) were 0.70 ± 0.06 to 0.92 ± 0.08, 0.64 ± 0.05 to 1.15 ± 0.08, 0.42 ± 0.03 to 0.67 ± 0.07, and 3.84 ± 0.52 to 7.00 ± 1.42; and for FDG (30–180 min) were 1.86 ± 0.22 to 1.38 ± 0.35, 3.18 ± 0.44 to 2.92 ± 0.34, 4.19 ± 0.44 to 19.41 ± 2.05, and 5.75 ± 2.55 to 3.33 ± 0.65, respectively. Higher kidney uptake was observed for both 68Ga-ECG and 99mTc-ECG groups, presumable because EC and EC-conjugates may interact with renal tubules in the kidney [11].
Table 1.
Biodistribution of 68Ga-ECG in mesothelioma-bearing rats.
| Percentage of injected dose per gram of tissue weight (n = 3/time, interval, iv)1 | |||
|---|---|---|---|
| 15 min | 30 min | 60 min | |
| Blood | 1.66 ± 0.06 | 1.54 ± 0.02 | 1.38 ± 0.03 |
| Heart | 0.51 ± 0.04 | 0.39 ± 0.04 | 0.40 ± 0.03 |
| Lung | 1.07 ± 0.02 | 0.94 ± 0.04 | 0.80 ± 0.04 |
| Thyroid | 0.88 ± 0.07 | 0.96 ± 0.11 | 0.83 ± 0.05 |
| Pancreas | 0.29 ± 0.02 | 0.28 ± 0.03 | 0.29 ± 0.03 |
| Liver | 0.77 ± 0.05 | 0.71 ± 0.07 | 0.78 ± 0.04 |
| Spleen | 0.41 ± 0.03 | 0.44 ± 0.07 | 0.49 ± 0.01 |
| Kidney | 1.53 ± 0.06 | 0.75 ± 0.04 | 0.70 ± 0.02 |
| Stomach | 0.29 ± 0.07 | 0.37 ± 0.02 | 0.40 ± 0.04 |
| Intestine | 0.31 ± 0.04 | 0.35 ± 0.05 | 0.53 ± 0.01 |
| Uterus | 0.87 ± 0.19 | 0.81 ± 0.04 | 0.77 ± 0.10 |
| Tumor | 0.70 ± 0.06 | 0.72 ± 0.06 | 0.92 ± 0.08 |
| Muscle | 0.18 ± 0.01 | 0.14 ± 0.01 | 0.14 ± 0.02 |
| Bone | 0.27 ± 0.02 | 0.51 ± 0.09 | 0.46 ± 0.02 |
| Brain | 0.05 ± 0.01 | 0.07 ± 0.01 | 0.08 ± 0.01 |
| Tumor/blood | 0.42 ± 0.03 | 0.47 ± 0.04 | 0.67 ± 0.07 |
| Tumor/muscle | 3.84 ± 0.52 | 5.63 ± 1.03 | 7.00 ± 1.42 |
| Tumor/brain | 11.68 ± 1.87 | 8.81 ± 1.54 | 13.20 ± 2.78 |
| Tumor/lung | 0.64 ± 0.05 | 0.78 ± 0.10 | 1.15 ± 0.08 |
1Values represent the mean ± standard deviation of data from 3 animals.
Table 2.
Biodistribution of 99mTc-ECG in mesothelioma-bearing rats.
| Percentage of injected dose per gram of tissue weight (n = 3/time, interval, iv)1 | |||
|---|---|---|---|
| 30 min | 2 h | 4 h | |
| Blood | 0.98 ± 0.06 | 0.23 ± 0.03 | 0.16 ± 0.01 |
| Heart | 0.28 ± 0.02 | 0.06 ± 0.01 | 0.04 ± 0.00 |
| Lung | 0.65 ± 0.03 | 0.16 ± 0.03 | 0.10 ± 0.00 |
| Thyroid | 0.55 ± 0.04 | 0.12 ± 0.02 | 0.08 ± 0.00 |
| Pancreas | 0.21 ± 0.02 | 0.05 ± 0.01 | 0.04 ± 0.01 |
| Liver | 1.05 ± 0.02 | 0.86 ± 0.07 | 0.51 ± 0.02 |
| Spleen | 0.59 ± 0.05 | 0.61 ± 0.07 | 0.70 ± 0.02 |
| Kidney | 3.79 ± 0.57 | 2.02 ± 0.49 | 1.33 ± 0.10 |
| Stomach | 0.35 ± 0.03 | 0.07 ± 0.01 | 0.03 ± 0.00 |
| Intestine | 0.28 ± 0.02 | 0.11 ± 0.04 | 0.04 ± 0.01 |
| Uterus | 0.55 ± 0.04 | 0.15 ± 0.06 | 0.08 ± 0.01 |
| Tumor | 0.47 ± 0.06 | 0.12 ± 0.01 | 0.08 ± 0.00 |
| Muscle | 0.13 ± 0.01 | 0.03 ± 0.01 | 0.02 ± 0.00 |
| Bone | 0.16 ± 0.06 | 0.05 ± 0.01 | 0.03 ± 0.00 |
| Brain | 0.04 ± 0.00 | 0.01 ± 0.00 | 0.01 ± 0.00 |
| Tumor/blood | 0.47 ± 0.03 | 0.50 ± 0.03 | 0.51 ± 0.00 |
| Tumor/muscle | 3.49 ± 0.24 | 3.75 ± 0.44 | 5.06 ± 0.25 |
| Tumor/brain | 10.79 ± 0.50 | 10.22 ± 1.37 | 15.52 ± 0.89 |
| Uterus/muscle | 4.18 ± 0.23 | 4.49 ± 0.96 | 4.74 ± 0.16 |
| Tumor/lung | 0.71 ± 0.07 | 0.75 ± 0.10 | 0.85 ± 0.04 |
1Values represent the mean ± standard deviation of data from 3 animals.
Table 3.
Biodistribution of 18F-FDG in mesothelioma-bearing rats.
| Percentage of injected dose per gram of tissue weight (n = 3/time, interval, iv)1 | |||
|---|---|---|---|
| 30 min | 90 min | 180 min | |
| Blood | 0.45 ± 0.07 | 0.15 ± 0.01 | 0.07 ± 0.01 |
| Heart | 3.42 ± 1.14 | 1.95 ± 0.40 | 1.94 ± 0.45 |
| Lung | 0.60 ± 0.07 | 0.53 ± 0.03 | 0.46 ± 0.06 |
| Thyroid | 0.65 ± 0.04 | 0.47 ± 0.05 | 0.54 ± 0.04 |
| Pancreas | 0.22 ± 0.02 | 0.21 ± 0.02 | 0.21 ± 0.03 |
| Liver | 0.51 ± 0.08 | 0.33 ± 0.03 | 0.23 ± 0.03 |
| Spleen | 0.88 ± 0.08 | 0.87 ± 0.06 | 0.98 ± 0.10 |
| Kidney | 0.85 ± 0.13 | 0.43 ± 0.04 | 0.23 ± 0.01 |
| Stomach | 0.55 ± 0.03 | 0.40 ± 0.03 | 0.38 ± 0.02 |
| Intestine | 0.94 ± 0.16 | 1.00 ± 0.22 | 0.62 ± 0.07 |
| Uterus | 0.52 ± 0.06 | 0.57 ± 0.08 | 0.39 ± 0.09 |
| Tumor | 1.86 ± 0.22 | 1.63 ± 0.19 | 1.38 ± 0.35 |
| Muscle | 0.45 ± 0.14 | 0.23 ± 0.03 | 0.42 ± 0.06 |
| Bone | 0.21 ± 0.09 | 0.14 ± 0.07 | 0.24 ± 0.06 |
| Brain | 2.36 ± 0.10 | 2.24 ± 0.20 | 1.89 ± 0.35 |
| Tumor/blood | 4.19 ± 0.44 | 11.01 ± 1.60 | 19.41 ± 2.05 |
| Tumor/muscle | 5.75 ± 2.55 | 7.40 ± 1.67 | 3.33 ± 0.65 |
| Tumor/brain | 0.77 ± 0.09 | 0.72 ± 0.02 | 0.71 ± 0.05 |
| Uterus/muscle | 1.58 ± 0.69 | 2.50 ± 0.37 | 0.94 ± 0.16 |
| Tumor/lung | 3.18 ± 0.44 | 3.41 ± 0.43 | 2.92 ± 0.34 |
1Values shown represent the mean ± standard deviation of data from 3 animals.
3.3. Scintigraphic Imaging Studies
Scintigraphic images of rats administered 68Ga-ECG, 99mTc-ECG, and 18F-FDG showed that tumors could be clearly visualized at 0.5–4 hrs (Figures 5–7). Dynamic plot of tumor uptake with 68Ga-ECG and 18F-FDG showed similar transporter pattern (Figure 5). 68Ga-ECG was able to monitor paclitaxel treatment response in the same mesothelioma-bearing rats (Figure 6). Two rats receiving 99mTc-ECG (middle and right) were randomly selected to compare to that of the rat receiving 99mTc-EC (left) under the same imaging panel. Tumor in 99mTc-ECG group showed much higher uptake than 99mTc-EC (control) group at 1 and 2 hrs (Figure 7).
Figure 5.
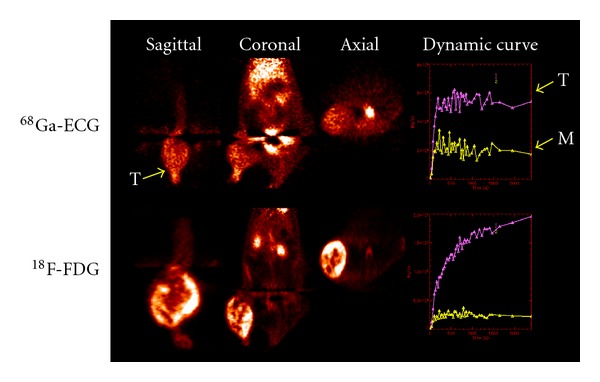
18F-FDG and 68Ga-ECG PET imaging in mesothelioma-bearing rats (400 μCi/rat, iv, acquired 45 minutes). Computer-outlined regions of interest (ROI) (counts per pixel) for tumor and muscle at the corresponding time interval were used to generate a dynamic plot. Dynamic plot was from 0 to 45 minutes.
Figure 7.
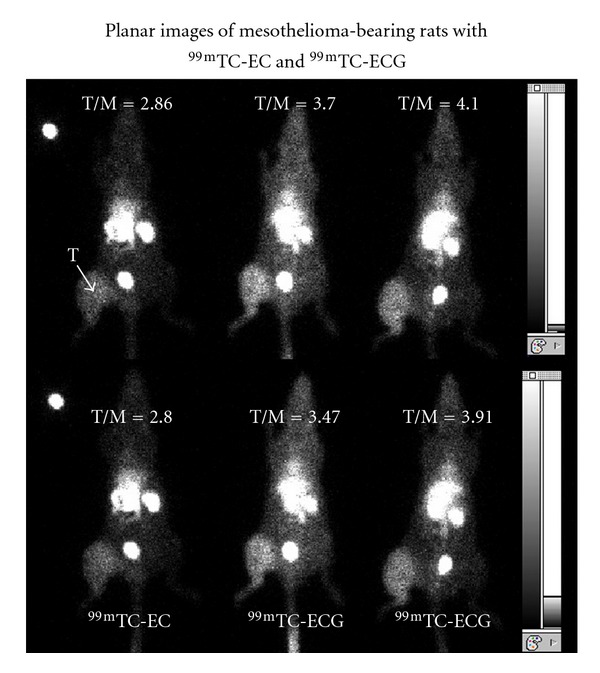
Planar scintigraphy of 99mTc-EC (left) and 99mTc-ECG (300 μCi/rat, iv, acquired 500,000 count) (middle and right) in mesothelioma-bearing rats. The numbers are tumor-to-muscle count density ratios at 1 hr (upper panel) and 2 hrs (lower panel). T: tumor.
Figure 6.
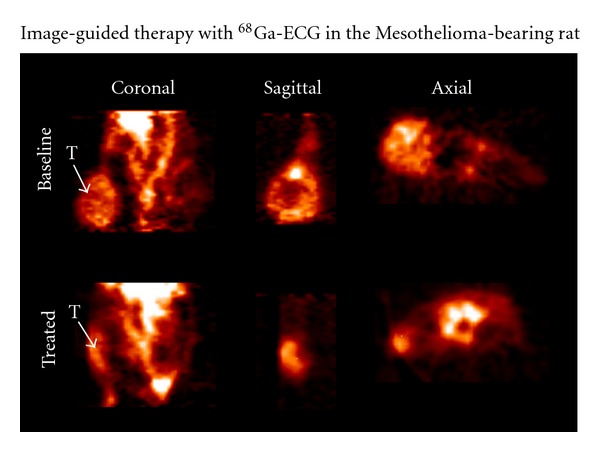
68Ga-ECG PET images in rat bearing mesothelioma (400 μCi/rat, iv, lower body) before and after treatment at 45 minutes. Top: baseline at tumor size 1.5 cm; bottom: treated with paclitaxel (20 mg/kg, iv, single dose on day 7). T: tumor.
4. Discussion
Previous studies have shown that 99mTc-ECG exhibits characteristics similar to 18F-FDG in terms of the glucose membrane transport process and tumor uptake [11]. These glucose membrane transporters are involved in both the glycolytic pathway and the hexosamine biosynthetic pathway. Cell cycle analysis revealed that 99mTc-ECG was able to transport across the nucleus membrane and involved in proliferation activity in all phases cell cycles [14]. Moreover, the thymidine incorporation assay studies showed similar uptake patterns for both unlabeled ECG and glucose, suggesting that both ECG and glucose were involved in the proliferation/growth activity of cells, whereas unlabeled FDG was not [14].
The lack of 18F-FDG involvement in DNA proliferation is attributable to the presence of the fluorine atom at position 2 of the molecule, which prevents its metabolism and consequently its utilization in cell proliferation and growth [23]. As both molecules enter a cell and become phosphorylated by hexokinase, it can be diverted from the main glycolytic/glycogen pathways into accessory pathways. For example, under normal conditions, cells utilize 95% glucose which is transported via transporters 1 and 3 through the glycolytic pathway. 18F-FDG uses transporters 1 and 3. 99mTc-ECG uses transporters 2 and 4 which are the transporters for glucosamine and transport glucose by the hexosamine pathway under normal conditions [24]. In addition, under abnormal conditions, only 3 to 5% of glucose is being utilized by the glycolytic pathway. However, in the case where an abnormal condition exists, there is a dramatic shift from 95% and above [25]. It should be noted that when the cell senses stress or a disease state occurs, the cells become hyper and glucose deficient/depleted, which in turn deactivates the glycolytic pathway. The hexosamine biosynthesis pathway then becomes active and takes over. The proliferation rates for tumors are with 100–1000x more than normal cells and thus a relatively greater concentration of 99mTc-ECG than normal cells. 99mTc-ECG can be utilized by cancer cells; thus the imaging studies are successful. Clinical phase 1 and 2 trials revealed that 99mTc-ECG was safe and had favorable radiation dosimetry. 99mTc-ECG was able to differentiate tumor and inflammation in lung cancer patients [26].
In the present study, we are able to place different radiometals in ECG. Both 99mTc-ECG and 68Ga-ECG were able to image mesothelioma in the animal model. 68Ga-ECG was able to provide image-guided therapy assessment. From biodistribution (Tables 1–3), tumor/brain count density ratios of 99mTc-ECG and 68Ga-ECG were better than those of FDG. It may have advantage in brain tumor imaging than FDG. However, tumor/blood count density ratios of 99mTc-ECG and 68Ga-ECG were less than that of FDG. Additional experiments such as mechanistic studies and differential diagnosis would warrant their applications in oncology.
In summary, efficient synthesis of ECG was achieved with high yield. 68Ga-ECG and 99mTc-ECG were prepared with high radiochemical purities. Biodistribution and planar imaging studies demonstrated the pharmacokinetic distribution and feasibility of using 68Ga-ECG and 99mTc-ECG to image mesothelioma. 68Ga-ECG and 99mTc-ECG showed an increased uptake in mesothelioma in the model tested, indicating that they are feasible to assess tumor volume. 68Ga-ECG and 99mTc-ECG may be useful for screening, diagnosing, staging, and assessing the efficacy of treatment in respect to all cancer types.
Acknowledgments
This work was supported in part by the John S. Dunn Foundation and sponsored research agreement (LS01-212) made by Cell > Point LLC at the MDACC. The animal research is supported by MD Anderson Cancer Center (CORE) Grant NIH CA-16672.
References
- 1.Buerkle A, Weber WA. Imaging of tumor glucose utilization with positron emission tomography. Cancer and Metastasis Reviews. 2008;27(4):545–554. doi: 10.1007/s10555-008-9151-x. [DOI] [PubMed] [Google Scholar]
- 2.Delbeke D, Coleman RE, Guiberteau MJ, et al. Procedure guideline for tumor imaging with 18F-FDG PET/CT 1.0. Journal of Nuclear Medicine. 2006;47(5):885–895. [PubMed] [Google Scholar]
- 3.Buse MG. Hexosamines, insulin resistance and the complications of diabetes: current status. American Journal of Physiology. 2006;290:1–15. doi: 10.1152/ajpendo.00329.2005. [DOI] [PMC free article] [PubMed] [Google Scholar]
- 4.Iyer SPN, Hart GW. Dynamic nuclear and cytoplasmic glycosylation: enzymes of O-GlcNAc cycling. Biochemistry. 2003;42(9):2493–2499. doi: 10.1021/bi020685a. [DOI] [PubMed] [Google Scholar]
- 5.Mang’era K, Vanbilloen H, Cleynhens B, et al. Synthesis and evaluation of the 99mTc-complexes of L-cysteine acetyldiglycine (a hybrid of MAG3 and L,L-EC) and of L-β-homocysteine acetyldiglycine. Nuclear Medicine and Biology. 2000;27(8):781–789. doi: 10.1016/s0969-8051(00)00162-1. [DOI] [PubMed] [Google Scholar]
- 6.Vanbilloen HP, Cleynhens BJ, Verbruggen AM. Synthesis and biological evaluation of the four isomers of technetium-99m labeled ethylenecysteamine cysteine (99mTc-ECC), the mono-acid derivative of 99mTc-L,L-ethylenedicysteine. Nuclear Medicine and Biology. 2000;27(2):207–214. doi: 10.1016/s0969-8051(99)00092-x. [DOI] [PubMed] [Google Scholar]
- 7.Yang DJ, Ilgan S, Higuchi T, et al. Noninvasive assessment of tumor hypoxia with 99mTc labeled metronidazole. Pharmaceutical Research. 1999;16(5):743–750. doi: 10.1023/a:1018836911013. [DOI] [PubMed] [Google Scholar]
- 8.Yang DJ, Azhdarinia A, Wu P, et al. In vivo and in vitro measurement of apoptosis in breast cancer cells using 99mTc-EC-annexin V. Cancer Biotherapy and Radiopharmaceuticals. 2001;16(1):73–83. doi: 10.1089/108497801750096087. [DOI] [PubMed] [Google Scholar]
- 9.Yang DJ, Fogler WE, Bryant JL, et al. Assessment of antiangiogenic effect using 99mTc-EC-endostatin. Cancer Biotherapy and Radiopharmaceuticals. 2002;17(2):233–246. doi: 10.1089/108497802753773856. [DOI] [PubMed] [Google Scholar]
- 10.Schechter NR, Yang DJ, Azhdarinia A, et al. Assessment of epidermal growth factor receptor with 99mTc-ethylenedicysteine-C225 monoclonal antibody. Anti-Cancer Drugs. 2003;14(1):49–56. doi: 10.1097/00001813-200301000-00007. [DOI] [PubMed] [Google Scholar]
- 11.Yang DJ, Kim CG, Schechter NR, et al. Imaging with 99mTc ECDG targeted at the multifunctional glucose transport system: feasibility study with rodents. Radiology. 2003;226(2):465–473. doi: 10.1148/radiol.2262011811. [DOI] [PubMed] [Google Scholar]
- 12.Song HC, Bom HS, Cho KH, et al. Prognostication of recovery in patients with acute ischemic stroke using brain spect with 99mTc-labeled metronidazole. Stroke. 2003;34(4):982–986. doi: 10.1161/01.STR.0000062902.94892.F5. [DOI] [PubMed] [Google Scholar]
- 13.Yang DJ, Bryant J, Chang JY, et al. Assessment of cyclooxygense-2 expression with 99mTc-labeled celebrex. Anti-Cancer Drugs. 2004;15(3):255–263. doi: 10.1097/00001813-200403000-00010. [DOI] [PubMed] [Google Scholar]
- 14.Yang DJ, Yukihiro M, Oh CS, et al. Assessment of therapeutic tumor response using 99mTc-Ethylenedicysteine-Glucosamine. Cancer Biotherapy and Radiopharm. 2004;19(4):444–458. doi: 10.1089/cbr.2004.19.443. [DOI] [PubMed] [Google Scholar]
- 15.Schechter NR, Wendt RE, Yang DJ, et al. Radiation dosimetry of 99mTc-labeled C225 in patients with squamous cell carcinoma of the head and neck. Journal of Nuclear Medicine. 2004;45(10):1683–1687. [PubMed] [Google Scholar]
- 16.Yang DJ, Ozaki K, Oh CS, et al. 99mTc-EC-guanine: synthesis, biodistribution, and tumor imaging in animals. Pharmaceutical Research. 2005;22(9):1471–1479. doi: 10.1007/s11095-005-6157-8. [DOI] [PubMed] [Google Scholar]
- 17.Ito M, Yang DJ, Mawlawi O, et al. PET and Planar Imaging of Tumor Hypoxia With Labeled Metronidazole. Academic Radiology. 2006;13(5):598–609. doi: 10.1016/j.acra.2006.01.007. [DOI] [PubMed] [Google Scholar]
- 18.Gong J, Yang D, Kohanim S, Humphreys R, Broemeling L, Kurzrock R. Novel In vivo imaging shows up-regulation of death receptors by paclitaxel and correlates with enhanced antitumor effects of receptor agonist antibodies. Molecular Cancer Therapeutics. 2006;5(12):2991–3000. doi: 10.1158/1535-7163.MCT-06-0188. [DOI] [PubMed] [Google Scholar]
- 19.Kurihara H, Yang DJ, Cristofanilli M, et al. Imaging and dosimetry of 99mTc EC annexin V: preliminary clinical study targeting apoptosis in breast tumors. Applied Radiation and Isotopes. 2008;66(9):1175–1182. doi: 10.1016/j.apradiso.2008.01.012. [DOI] [PMC free article] [PubMed] [Google Scholar]
- 20.Kayser K, Böhm G, Blum S, et al. Glyco- and immunohistochemical refinement of the differential diagnosis between mesothelioma and metastatic carcinoma and survival analysis of patients. The Journal of Pathology. 2001;193(2):175–180. doi: 10.1002/1096-9896(2000)9999:9999<::AID-PATH772>3.0.CO;2-T. [DOI] [PubMed] [Google Scholar]
- 21.Rastogi S, Banerjee S, Chellappan S, Simon GR. Glut-1 antibodies induce growth arrest and apoptosis in human cancer cell lines. Cancer Letters. 2007;257(2):244–251. doi: 10.1016/j.canlet.2007.07.021. [DOI] [PubMed] [Google Scholar]
- 22.Schulz MD, Zubris KA, Wade JE, et al. Paclitaxel-loaded expansile nanoparticles in a multimodal treatment model of malignant mesothelioma. The Annals of Thoracic Surgery. 2011;92(6):2007–2013. doi: 10.1016/j.athoracsur.2011.04.106. [DOI] [PubMed] [Google Scholar]
- 23.Marshall S, Bacote V, Traxinger RR. Discovery of a metabolic pathway mediating glucose-induced desensitization of the glucose transport system: role of hexosamine in the induction of insulin resistance. Journal of Biological Chemistry. 1991;266(8):4706–4712. [PubMed] [Google Scholar]
- 24.Scheepers A, Joost HG, Schürmann A. The glucose transporter families SGLT and GLUT: molecular basis of normal and aberrant function. Journal of Parenteral and Enteral Nutrition. 2004;28(5):364–371. doi: 10.1177/0148607104028005364. [DOI] [PubMed] [Google Scholar]
- 25.Wells L, Vosseller K, Hart GW. Glycosylation of nucleocytoplasmic proteins: signal transduction and O-GlcNAc. Science. 2001;291(5512):2376–2378. doi: 10.1126/science.1058714. [DOI] [PubMed] [Google Scholar]
- 26.Schechter NR, Erwin WD, Yang DJ, et al. Radiation dosimetry and biodistribution of 99mTc-ethylene dicysteine-deoxyglucose in patients with non-small-cell lung cancer. European Journal of Nuclear Medicine and Molecular Imaging. 2009;36(10):1583–1591. doi: 10.1007/s00259-009-1135-8. [DOI] [PMC free article] [PubMed] [Google Scholar]


