Abstract
Background
Prostate cancer is the second most common cause of mortality. Gallic acid (GA) is a natural polyphenol, and we tested its in-vitro cytotoxicity after 24 h in prostate cancer LNCaP cells.
Materials and Methods
GA autoxidation was measured fluorimetrically for H2O2, and O2·− radicals by chemiluminescence. Intracellular reactive oxygen species (ROS) levels were detected with 2’,7’-dichlorodihydrofluorescein diacetate. Cytotoxicity was evaluated by crystal-violet, while apoptosis and mitochondrial membrane potential were determined by flow cytometry. Cytochrome c release was detected by enzyme-linked immunosorbent assay, and caspase-8, -9 and -3 activities were measured calorimetrically.
Results
GA autoxidation produced significant levels of H2O2 and O2·−. Increased intracellular ROS levels with GA were reduced by N-acetyl-L-cysteine (NAC) and L-glutathione (GSH). Cells were protected against GA cytotoxicity when pretreated with increasing levels of superoxide dismutase/catalase mixture, NAC, or GSH for 3 h. The number of apoptotic cells increased with GA dose. GA caused mitochondrial potential loss, cytochrome c release, and activation of caspases 3, 8 and 9.
Conclusion
The results indicate that ROS-dependent apoptotic mechanism of GA kills malignant cells effectively; it is likely that GA could be a good anticancer agent.
Keywords: Polyphenol, gallic acid, autoxidation, apoptosis, LNCaP, ROS
Prostate cancer is the second most common cause of cancer related mortality among US men and in industrialized countries (1). Even though the exact cause of prostate cancer is unknown, it is usually associated with age, cigarette smoking, and vasectomy (2), and may involve other factors such as obesity, inactivity, ethnicity nationality and race. Epidemiological findings have recently uncovered associations between dietary habits and prostate cancer. For instance, diets high in red meat, dairy, and calcium containing products, and low in fresh fruits and vegetables have been directly linked to high incidences of prostate cancer (3). On the other hand, consumption of many natural products, such as vegetables, and fruits not only reduces the prostate cancer rate, but also promotes a general state of well-being when consumed chronically (4). A well-documented example is found in the daily consumption of green tea, exemplified by the Chinese population and linked to their significantly lower levels of prostate cancer (5), as well as of lung, colon, and breast cancer compared to industrialized countries of similar size (6). This phenomenon has been attributed to the product’s major phenolic constituent (--)-epigallocatechin-3-gallate (EGCG) and a reactive oxygen species (ROS)-dependent mechanism which induces potent cytotoxicity in various cancer cell lines, while being significantly less toxic towards normal epithelial cell lines (6, 7).
We recently showed that triphala, which is one of the most popular herbal formulae in the world, exhibited specific cytotoxicity towards human prostate cancer LNCaP cells (8). While our study demonstrated that triphala contained gallic acid (GA) in abundant quantity, others showed that GA was one of the major contributors to the anticancer activity of triphala (9). Consistent with these reports, GA was shown to possess a time-and dose-dependent cytotoxic effect on the early-stage androgen-dependent prostate cancer cell line LNCaP, while exhibiting reduced toxicity towards a normal prostate epithelial (PrEC) cell line (8). GA, or its derivatives, are found naturally in grapes, wines (10), vegetables, and plant products, including rose flowers, gallnuts, sumac, and green tea (11). GA is indicated in the ‘French paradox,’ where it was observed that high wine consumption by the French population is paralleled by significantly lower diabetic conditions, cardiovascular disease, and cancer incidence compared to its neighboring European countries and the United States (12).
Since GA is structurally similar to EGCG, we hypothesize that the pro-oxidant nature of GA is the cause of its induction of apoptotic cell death in human prostate cancer LNCaP cells. To date, the exact pro-oxidant nature of GA is poorly established. Therefore, the objectives of this study were i) to investigate the pro-oxidant potential of GA, and ii) to determine ROS-dependent death in LNCaP cells treated with GA.
Materials and Methods
Chemicals
RPMI-1640 medium was purchased from the (ATCC; Manassas, VA, USA). Phenol red-free RPMI-1640 medium, fetal bovine serum, GA, hydrogen peroxide (H2O2), superoxide dismutase (SOD), catalase, N-acetyl-L-cysteine (NAC), reduced L-glutathione (GSH), and protease inhibitor cocktail were purchased from Sigma-Aldrich Inc. (St. Louis, MO, USA). Carbonyl cyanide 3-chlorophenylhydrazone (CCCP) and 5-and -6-carboxy-2’,7’-dichlorodihydrofluorescein diacetate (carboxy-H2DCFDA) were purchased from Invitrogen Molecular Probes (Eugene, OR, USA). Thermo Scientific Pierce BCA protein assay kit was obtained from Pierce Biotechnology (Rockford, IL, USA).
Cell culture
LNCaP human prostate cancer cells were purchased from the ATCC and were maintained in 75 cm2 flasks as described elsewhere (8).
Autoxidative potential of GA
The ability of GA to autoxidize spontaneously into hydrogen peroxide and superoxide reactive ROS in the medium was measured with the Amplex Red Hydrogen Peroxide/Peroxidase kit (Invitrogen Molecular Probes) and the Superoxide Anion assay kit (Sigma-Aldrich Inc.) respectively, as per the supplier’s instructions. The production of red fluorescence due to amplex red reaction with hydrogen peroxide was measured (excitation/emission=571/585 nm) in a Bio Tek Epoch microplate spectrophotometer (Winooski, VT, USA) at 0, 3, 6, 9, and 24 h. Chemiluminescence of the released superoxide free radicals from GA-treated cells (80 μg/ml) was measured using a GloMax-96 Microplate Luminometer (Promega, Madison, WI, USA).
Detection of intracellular ROS levels
Intracellular ROS (H2O2, •HO, and ONOO−) were measured with the oxidation-sensitive fluorescent probe carboxy-H2DCFDA (Invitrogen Molecular Probes). Cells were pretreated either with 10 mM NAC, or 10 mM GSH for 3 h, followed by replacement of the media with media containing GA (80 μg/ml), dimethyl sulfoxide (DMSO) (0.1%, vehicle control), or 100 μM H2O2 (positive control) and incubation for a further 3 h. The harvested cells were loaded with 5 μM carboxy-H2DCFDA dye in phosphate-buffered saline (PBS) and incubated at 37°C for 1 h in the dark. The DCF fluorescence signal was measured immediately using a Bio Tek FLx800 microplate fluorometer set at excitation and emission wavelengths of 490 and 527 nm respectively.
Cytotoxicity assay
In order to determine if GA cytotoxicity towards LNCaP cells is ROS-dependent, the cells were pretreated with SOD/catalase (100–5000 U/ml), NAC (0.3–10 mM), or GSH (0.3–20 mM) for 3 h. The medium was then replaced with phenol red-free medium containing GA (80 μg/ml) or DMSO (0.1%, vehicle control) and cells incubated for 24 h. Cytotoxicity was evaluated by dye uptake assay using crystal violet as described previously (13). The plates were read at 540 nm in a plate reader (Bio Tek Epoch microplate spectrophotometer).
Annexin V- (FITC)/ (PI) staining
At the end of 24 h incubation with GA, the cells were washed twice with ice-cold PBS, collected with 0.25% trypsin-EDTA, centrifuged and re-suspended in 1x binding buffer. GA-induced apoptosis was determined by staining with the annexin V-FITC/PI apoptosis detection kit I (BD Pharmingen, San Diego, CA, USA) according to the manufacturer’s instructions. The cells were immediately analyzed with a FACSCalibur flow cytometer (Becton Dickinson, San Jose, CA, USA). CellQuest Pro software (Becton Dickinson) was used for acquisition and analysis of the data.
Assessment of mitochondrial membrane potential (ΔΨm)
The loss of mitochondrial membrane potential (ΔΨm) was determined with the fluorescent potentiometric JC-1 dye (Invitrogen Molecular Probes) according to the manufacturer’s instructions. Carbonyl cyanide 3-chlorophenylhydrazone (CCCP, 50 μM) was used as a positive control. At the end of treatment, cells were washed twice with ice-cold PBS, collected in 0.25% trypsin-EDTA, centrifuged, and then re-suspended in PBS at 1x10⁶ cells/ml. Subsequently, 10 μl of JC-1 dye was added and the cell suspension was incubated in an atmosphere of humidified air with 5% CO2 at 37°C for 30 min. Cells were pelleted to remove excess dye, re-suspended in 500 μl of PBS, and immediately analyzed via FACSCalibur flow cytometer. CellQuest Pro software was used for acquisition and analysis of the data.
Measurement of cytochrome c release
After GA treatment, cells were washed twice with ice-cold PBS, collected with 0.25% trypsin-EDTA, and centrifuged. Cells were then lysed on ice in cell extraction buffer supplemented with protease inhibitor cocktail for 30 min at 2x10⁶ cells/ml and then subjected to two freeze-thaw cycles and centrifugation at 12,000 rpm for 15 min. The BCA protein assay was then conducted on the supernatants containing the mitochondria-free cytosolic protein fraction. Release of cytochrome c from the mitochondria to the cytosol was measured in 5 μg of protein (antigen source) by means of a solid phase sandwich enzyme linked-immunosorbent assay (ELISA) as per the kit instructions (Invitrogen Camarillo, CA, USA).
Measurement of caspase enzyme activities
Proteolytic activities of caspase-3, -8, and -9 enzymes in LNCaP cells were measured using colorimetric protease assays (Invitrogen Molecular Probes) according to the manufacturer’s instructions. At the end of the 24 h incubation, the cells were subjected to two freeze-thaw cycles, followed by centrifugation at 12,000 rpm for 15 min. The protein content in the supernatants was determined by BCA protein assay. A total of 50 μg of protein was incubated with 5 μl of DEVD-pNA, IETD-pNA, or LEHD-pNA, or (200 μM) substrate in 50 μl of reaction buffer at 37°C for 2 h in the dark. The optical density of the reaction mixture was then quantitated at a wavelength of 405 nm using a Bio Tek Epoch microplate spectrophotometer.
Statistical analysis
Results are presented as the mean±standard deviation (SD). The data were analyzed for significance by one-way analysis of variance (ANOVA) and compared by Bonferroni's multiple comparison test using GraphPad Prism Software, version 5.00 (San Diego, CA, USA). A test value of p<0.05 was considered significant.
Results
Spontaneous autoxidation of GA
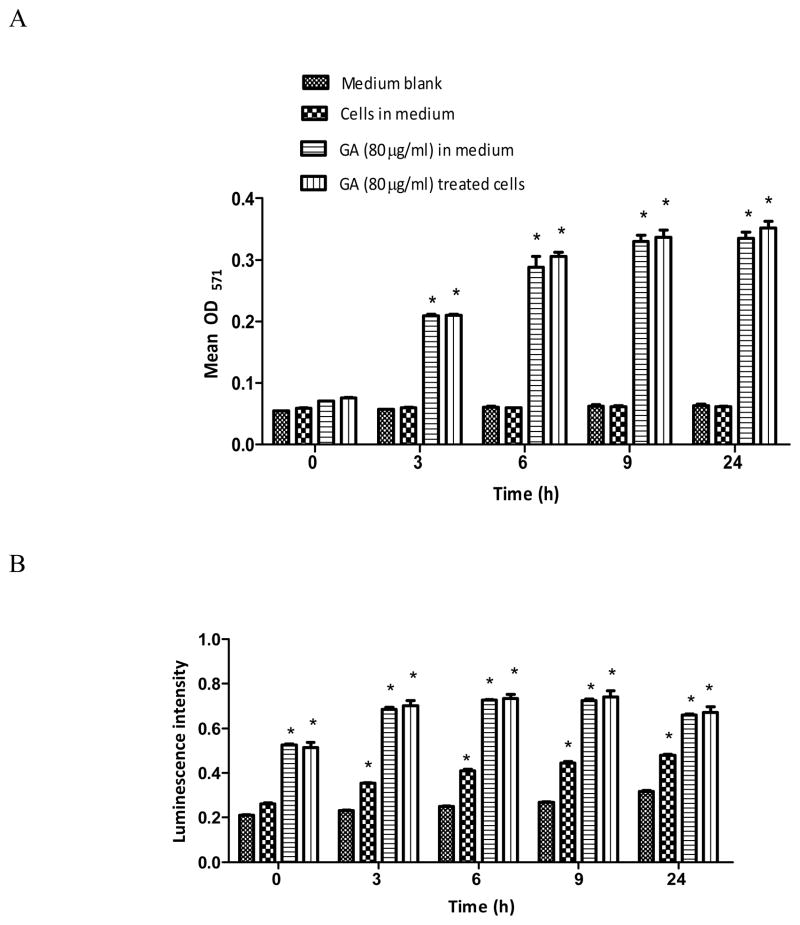
Generation of H2O2 or O2 ·− radicals due to autoxidation of GA in the medium was assessed in the presence or absence of cells at 0, 3, 6, 9, and 24 h. The basal H2O2 levels in the medium blank or medium with cells remained the same at all time points (Figure 1A). Addition of GA to these two groups significantly (p<0.05) increased the levels of H2O2 as a function of time from 3 h onwards. However, the levels of H2O2 and O2·− radicals in these groups remained almost the same throughout (Figure 1A and B). In the case of O2·− radicals, it was observed that the levels in the medium-blank did not increase significantly over time (Figure 1B). On the other hand, the O2·− level for medium with cells increased significantly (p<0.05) with time. Addition of GA either to the medium-blank and to medium with cells caused a significant (p<0.05) increase within 5–10 min and was indicated by an instantaneous blue-grey color change; however, the O2·− levels in these two groups remained the same at all time points thereafter (Figure 1B).
Figure 1.
Generation of hydrogen peroxide (A) and superoxide free radical (B) by autoxidation of gallic acid (GA). GA (80 μg/ml) and Amplex Red/HRP (A) or Luminol (B) reagent was incubated in phenol red- and FBS-free RPMI-1640 experimental media in the presence or absence of LNCaP cells for 0, 3, 6, 9, and 24 h. Results represent mean optical density at 571 nm (A) or luminescence intensity (B) (±SD) from three independent experiments. *Significantly different (p<0.05) from the medium blank or untreated cells.
Intracellular ROS production by GA
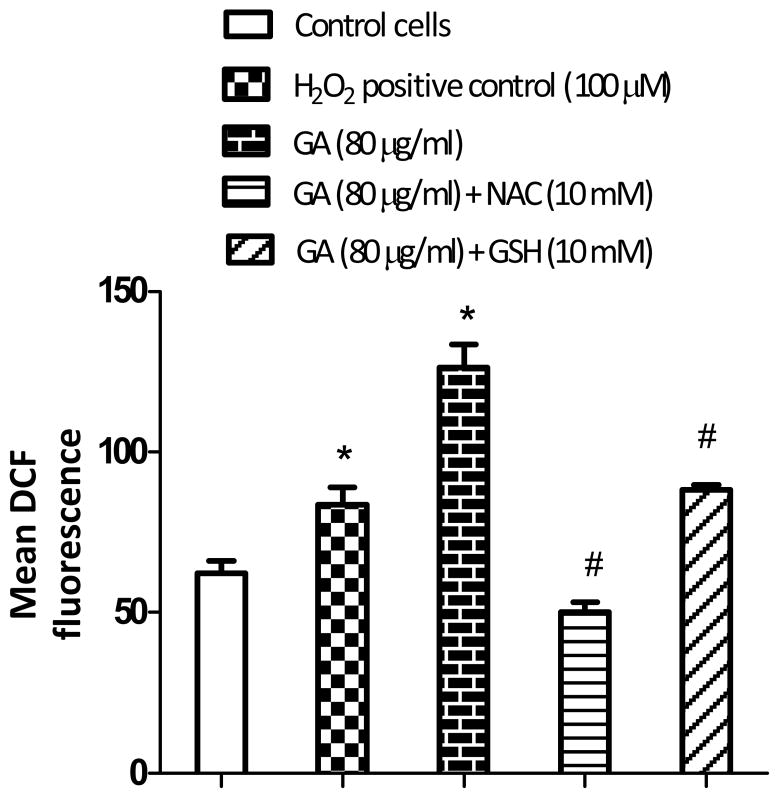
When cells were treated with GA at 80 μg/ml for 3 h, it resulted in significantly (p<0.05) higher levels of ROS production (Figure 2) compared to the control. However, in cells pretreated with 10 mM NAC or 10 mM GSH for 3 h, followed by GA treatment for an additional 3 h, the ROS levels decreased markedly. The decrease in the ROS level was found to be greater with NAC than GSH pretreatment. The results clearly indicate that GA induces intracellular ROS in LNCaP cells.
Figure 2.
Effect of non-enzymatic antioxidants, (NAC) and (GSH), on gallic acid (GA-induced ROS in LNCaP cells. Cells were pretreated either with 10 mM NAC or 10 mM GSH for 3 h, followed by replacement of medium containing GA (80 μg/ml) for another 3 h. Cells were then incubated with 5 μM carboxy-2’,7’-dichlorodihydrofluorescein diacetate for 1 h, prior to measurement of DCF by fluorometry. Results represent the mean DCF fluorescence (±SD) from three independent experiments. Significantly different at p<0.05 from *the untreated control, and #GA-treated cells.
ROS-dependent cell death
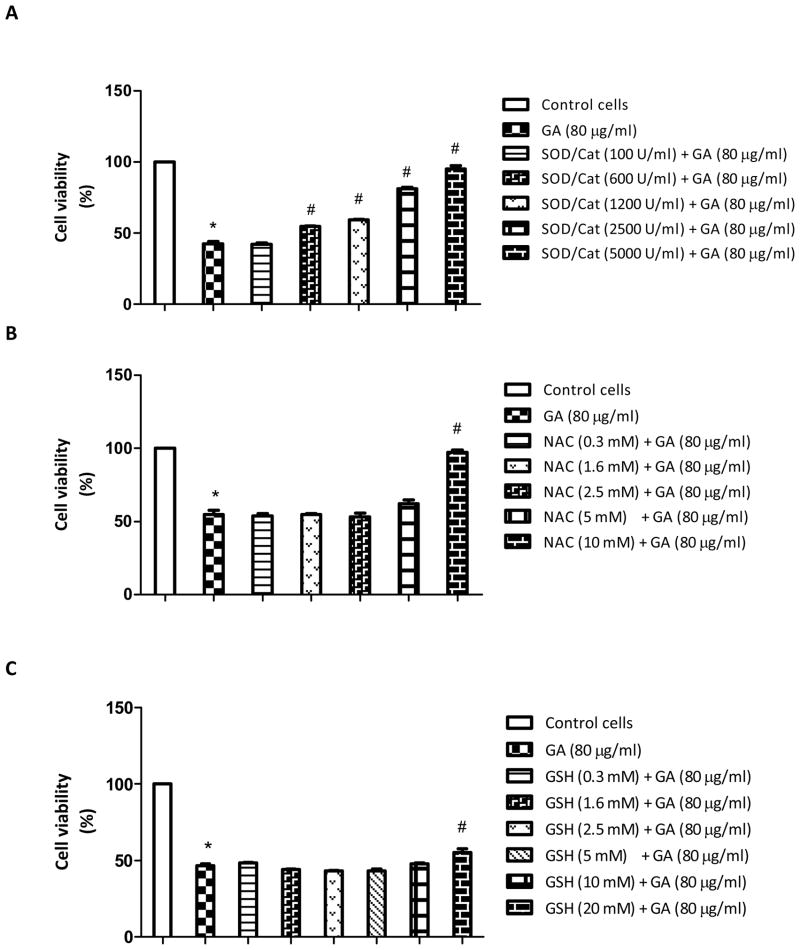
Treatment of cells with GA at 80 μg/ml for 24 h caused more than 50% cell death (p<0.05). However, GA did not induce cytotoxicity when the LNCaP cells were pretreated with increasing concentrations of SOD/catalase for 3 h (Figure 3A). The cell viability at 5000U/ml of SOD/catalase was not significantly different from that of the untreated control. Since SOD and catalase are antioxidant enzymes involved in quenching the free radicals in cells, these results clearly suggest that free radicals are the cause of cell death with GA treatment. In order to investigate further if non-enzyme antioxidant compounds render similar protection, we pretreated the cells with NAC (0.3-10 mM) or GSH (0.3–20 mM) for 3 h, followed by GA treatment for 24 h. It was found that NAC between 0.3 to 5 mM did not cause significant protection, but at 10 mM, it restored to a level similar to that of the control cell viability (Figure 3B). On the other hand, GSH up to 10 mM dose did not protect the cells significantly (Figure 3C); however, at 20 mM dose, GSH caused a marginal increase in the cell viability. These results clearly indicate that SOD/catalase combination has a significant protective role against GA-induced cell death at higher doses compared to GSH.
Figure 3.
Effect of enzymatic antioxidants, (SOD) and (catalase) (A), non-enzymatic antioxidant (NAC) (B), and non-enzymatic antioxidant (GSH) (C) on gallic acid (GA)-induced cytotoxicity in LNCaP cells. Cells were pretreated with either a 100–5000 U/ml SOD/catalase mixture, 0.3–10 mM NAC, or 0.3–10 mM GSH for 3 h, followed by treatment with GA (80 μg/ml) for 24 h. Results represent the means ±SD from three independent experiments. Significantly different at p<0.05 from *the untreated control, and #GA- treated cells.
Induction of apoptosis by GA
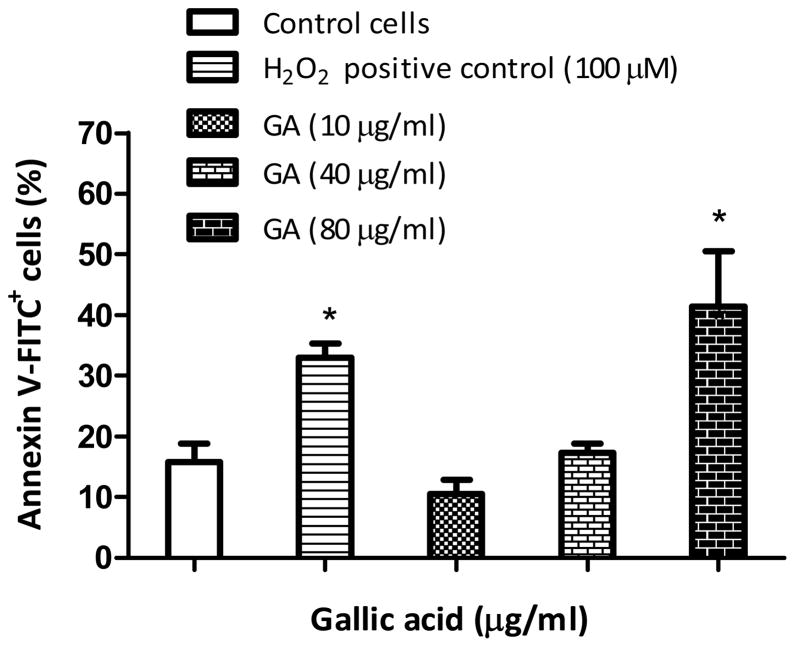
GA at 10 or 40 μg/ml did not trigger apoptosis of the cells at 24 h (p>0.05). However at 80 μg/ml, GA produced significant (p<0.05) numbers of early apoptotic cells, with a 2.7-fold increase in annexin V-FITC+ cells as compared to the untreated control (Figure 4). The results clearly suggest that apoptosis is a dose-dependent phenomena in LNCaP cells.
Figure 4.
Gallic acid (GA)-induced apoptosis in LNCaP cells. Cells were treated with GA (10-80 μg/ml) or 100 μM H2O2 (positive control) for 24 h and then incubated with annexin V-FITC/PI for 30 min and immediately analyzed by flow cytometry. Results represent mean percentages of annexin V-FITC+ cells (±SD) from three independent experiments. *Significantly different at p<0.05 from the untreated control.
Alteration of mitochondrial membrane potential (ΔΨm)
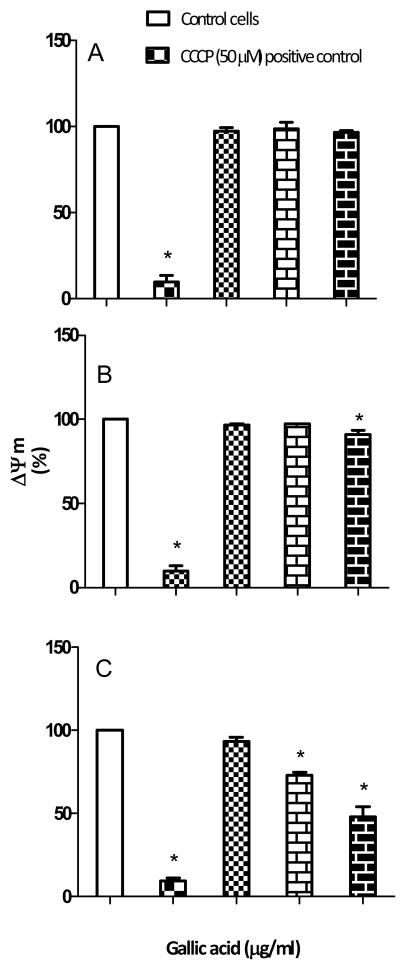
The effect of GA on mitochondrial membrane potential was investigated at 6, 12 and 24 h. It was observed that there was no significant (p>0.05) depolarization of membrane potential with GA treatment at 6 and 12 h (Figure 5A and B). However at 24 h, GA at 40 and 80 μg/ml caused a significant (p<0.05) decrease in mitochondrial membrane potential compared to the control (Figure 5C). The data suggest that the collapse of mitochondrial membrane potential by GA is both time and dose dependent.
Figure 5.
Effect of gallic acid (GA) on mitochondrial membrane potential (ΔΨm) in LNCaP cells. Cells were treated with GA (10, 40 and 80 μg/ml) or 50 μM carbonyl cyanide 3-chlorophenylhydrazone (CCCP)(positive control) for 6 h (A), 12 h (B), and 24 h (C), and then incubated with JC-1 dye for 30 min and immediately analyzed by flow cytometry. Results represent the mean (±SD) from three independent experiments (untreated control ΔΨm = 100%). *Significantly different at p<0.05 from the untreated control.
Cytochrome c release from mitochondria
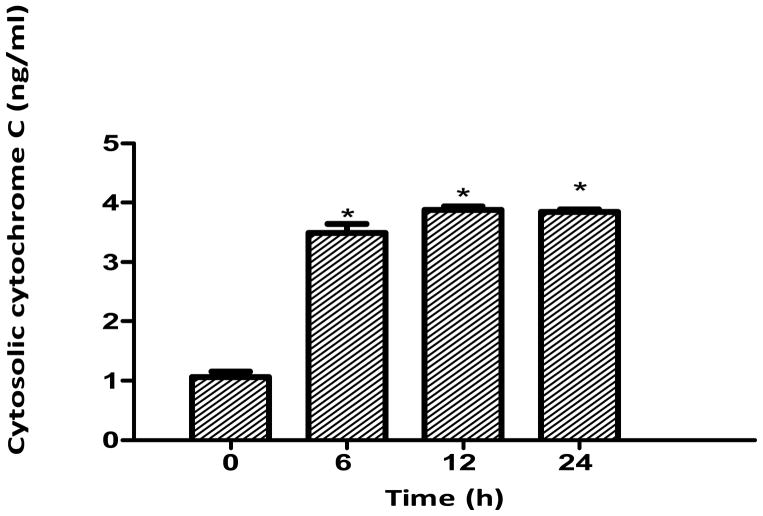
Treatments at 0, 6, 12 and 24 h indicated that GA (80 μg/ml) caused significant (p<0.05) release of cytochrome c from the mitochondria of LNCaP cells compared to the control as early as 6 h (Figure 6). The amount released was found to be 3.4 ng/ml at 6 h of treatment. Increasing the treatment period caused a more significant release of cytochrome c from the mitochondria into the cytosol.
Figure 6.
Cytochrome c release from the mitochondria in gallic acid (GA)-treated LNCaP cells. Cells were treated with GA (80 μg/ml) for 6-24 h and 5 μg of mitochondria-free cytosolic protein fraction was analyzed for cytochrome c by ELISA. Results represent the mean concentration (±SD) from three independent experiments. *Significantly different at p<0.05 from the control (0 h).
Activation of caspase enzymes
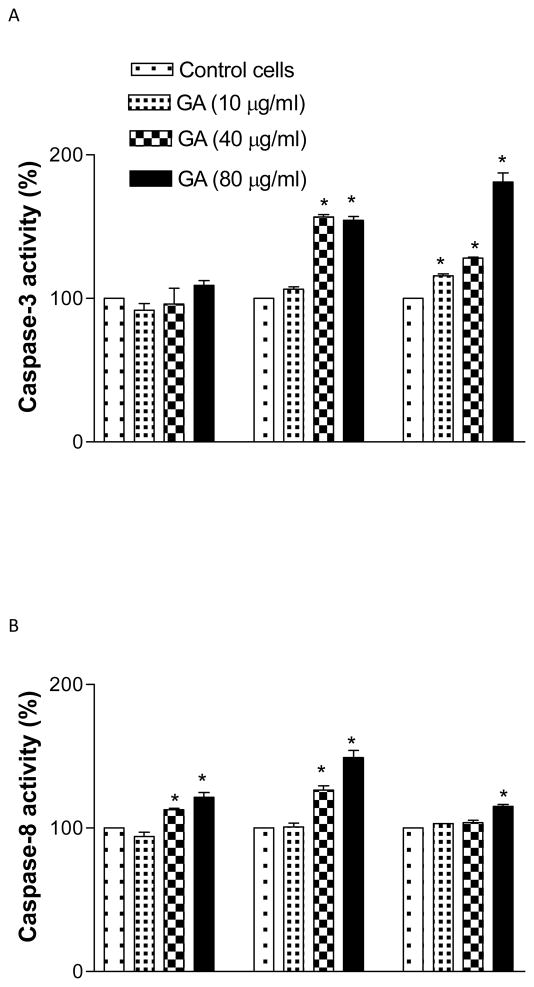
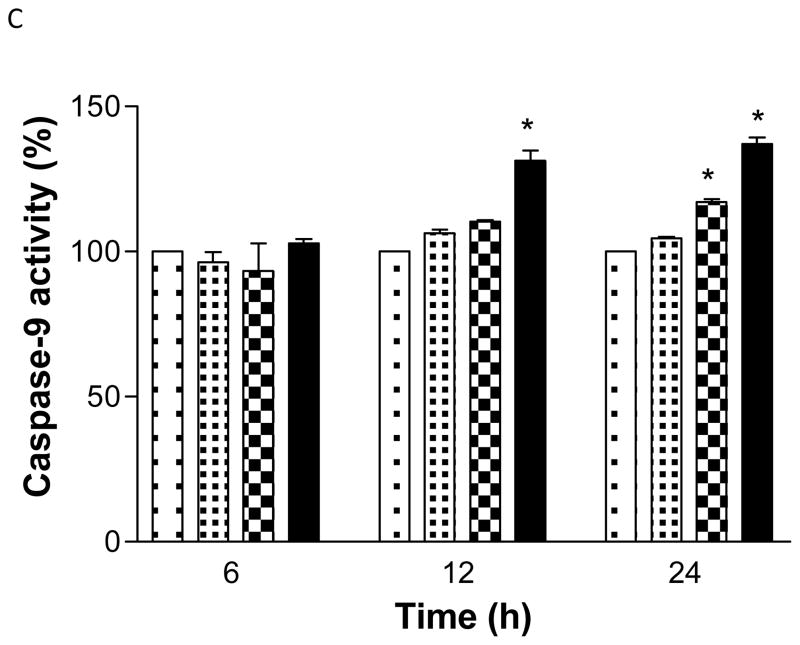
GA at 40 or 80 μg/ml activated the caspase-8 activity at 6 and 12 h significantly (p<0.05) compared to the control. However at 24 h, its activity decreased markedly (Figure 7A). Furthermore, GA was also seen to increase the activities of caspase-9 and 3 enzymes significantly (p<0.05), in both a dose and time dependent manner compared to the control (F7B, C). The results clearly demonstrate that GA activates different caspases in LNCaP cells.
Figure 7.
Gallic acid (GA)-induced caspase-3 (A), -8 (B), and -9 (C), proteolytic activity in LNCaP cells. Cells were treated with GA (10-80 μg/ml) for 6-24 h and 50 μg of protein was incubated with either IETD (Ile-Glu-Thr-Asp)-pNA, LEHD (Leu-Glu-His-Asp)-pNA, or DEVD (Asp-Glu-Val-Asp)-pNA substrate for 2 h and the OD405 was measured by spectrophotometry. Results represent the mean (±SD) from three independent experiments.*Significantly different at p<0.05 from the untreated control.
Discussion
Current treatment for localized or early stage androgen-dependent prostate cancer is based on surgical or pharmacological castration with luteinizing hormone-releasing hormone analogs used in combination with nonsteroidal anti-androgens (flutamide, bicalutamide, or nilutamide) (14–16). However, within 18–24 months, prostate tumors beyond stage T2c usually relapse and become resistant through a variety of mechanisms (14). Compounds that activate the apoptotic machinery in these cells through molecular targets other than the androgen receptor are currently a highly desirable commodity in the arena of localized disease treatment (14–18). Several studies have demonstrated that transformed cells maintain persistently higher levels of oxidative stress compared to normal cells (19, 20). This differential oxidative stress may be exploited to induce apoptosis in tumor cells selectively (17, 21–23). In the present study, we explored the feasibility of this idea with GA in LNCaP cells. GA was one of the main chemicals, found in triphala herbal powder and exhibited high cytotoxicity towards LNCaP cells (8). Earlier studies showed that GA induced production of high levels of ROS in the presence of transition metals such as Fe+3 (24, 25). In the present study, we identified different ROS entities and studied the mechanism of cytotoxicity.
The time-dependant increase of H2O2 (Figure 1A) and O2·− radicals (Figure 1B) indicates that GA had undergone autoxidation upon its addition to the medium. The results for GA autoxidation are consistent with previous reports (26). The observation that the levels of H2O2 and O2·− radicals remained the same whether in the presence or absence of cells with GA treatment not only suggests that GA autoxidation occurred outside of the cells but also indicates that the oxidized products did not diffuse into the cells, otherwise, GA-treated cells would have had higher radical levels than the GA medium-alone control. In agreement with earlier studies (27), we also noticed that GA treatment caused induction of ROS in cells, which was lowered with pretreatment of cell membrane-permeable non-enzymatic antioxidants NAC and GSH (Figure 2). Pretreatment of cells with the non-permeable enzymatic antioxidant SOD/catalase mixture also reduced the ROS production, which was reflected by the increased cell viability with GA exposure (Figure 3). Since ROS is an inclusive term that refers to free radicals and other reactive oxygen-derived non-radical species (28, 29), the restoration of cell viability with antioxidants clearly indicates that ROS are the primary cause of cell death with GA treatment in our study.
Several drugs induce various modes of cell death. For instance, some chemicals cause necrotic cell death while others induce apoptosis. Drugs that trigger apoptotic cell death in tumor tissues are highly preferred in cancer chemotherapy (16). Apoptosis, characterized by chromatin condensation, membrane blebbing, etc. occurs when the cell membrane is damaged, and can be easily identified by annexin V-FITC dye. In our study, cells treated with GA exhibited a dose-dependent increase in annexin V-FITC binding, suggesting that GA treatment triggered apoptosis in LNCaP cells (Figure 4). GA-induced apoptosis was shown earlier in various tumor cell lines (27, 30, 31). The apoptotic process can be related to mitochondrial damage by free radicals in some instances (17, 18), and our study clearly indicated that GA treatment not only caused time-and dose-dependant loss of mitochondrial membrane potential (Figure 5), but also released cytochrome c (Figure 6) into the cytosol. It is well known that activation of various pro-caspase enzymes by cytochrome c occurs in the cytosol. We observed that caspase-3, 8 and 9 were activated in both a time-and dose-dependant manner (Figure 7). Similar observations were reported for different cell culture models (30, 31).
Our study demonstrated that GA cytotoxicity towards LNCaP cells originated through an ROS-dependent apoptotic mechanism. One major benefit of GA is that its ready availability in various plants and fruits (32). Another advantage of GA is that it has favorable bioavailability at micromolar concentrations, both in its free and glucuronidated forms (33), in human blood plasma after ingestion of GA-rich products. Finally, the non-toxicity of GA is shown by its high lethal dose LD50 of 5 g/Kg body weight in rats (33). Based on these merits as well as the ROS- dependent cell death, it appears that GA could be a good candidate for anticancer activity. Further studies in animal models will test the efficacy of GA in this capacity.
Acknowledgments
This research was supported by NCRR/RCMI G12 RR03020, NIGMS/MBRS/SCORE GM08111, and HRSA SD34HP0 4018 of the US.
References
- 1.Siegel R, Ward E, Brawley O, Jemal A. Cancer statistics, 2011: The impact of eliminating socioeconomic and racial disparities on premature cancer deaths. CA Cancer J Clin. 2011;61:212–236. doi: 10.3322/caac.20121. [DOI] [PubMed] [Google Scholar]
- 2.Honda GD, Bernstein L, Ross RK, Greenland S, Gerkins V, Henderson BE. Vasectomy, cigarette smoking, and age at first sexual intercourse as risk factors for prostate cancer in middle-aged men. Br J Cancer. 1988;57:326–331. doi: 10.1038/bjc.1988.74. [DOI] [PMC free article] [PubMed] [Google Scholar]
- 3.Fleshner NE, Bagnell PS, Klotz LH, Venkateswaran V. Dietary fat and prostate cancer. J Urol. 2004;171:S19–S24. doi: 10.1097/01.ju.0000107838.33623.19. [DOI] [PubMed] [Google Scholar]
- 4.Kuo SM. Dietary flavonoids and cancer prevention: Evidence and potential mechanism. Critical Rev Oncogenesis. 1997;8:47–69. doi: 10.1615/critrevoncog.v8.i1.30. [DOI] [PubMed] [Google Scholar]
- 5.Khan N, Adhami VM, Mukhtar H. Review: green tea polyphenols in chemoprevention of prostate cancer: preclinical and clinical studies. Nutr Cancer. 2009;6:836–841. doi: 10.1080/01635580903285056. [DOI] [PMC free article] [PubMed] [Google Scholar]
- 6.Yamamoto T, Hsu S, Lewis J, Wataha J, Dickinson D, Singh B, Bollag WB, Lockwood P, Ueta E, Osaki T, Schuster G. Green tea polyphenol causes differential oxidative environments in tumor versus normal epithelial cells. J Pharmacol Exp Ther. 2003;307:230–236. doi: 10.1124/jpet.103.054676. [DOI] [PubMed] [Google Scholar]
- 7.Ishii T, Mori T, Tanaka T, Mizuno D, Yamaji R, Kumazawa S, Nakayama TM, Akagawa M. Covalent modification of proteins by green tea polyphenol (--)-epigallocatechin-3-gallate through autoxidation. Free Radic Biol Med. 2008;45:1384–1394. doi: 10.1016/j.freeradbiomed.2008.07.023. [DOI] [PubMed] [Google Scholar]
- 8.Russell LH, Mazzio E, Badisa RB, Zhu ZP, Agharahimi M, Millington DJ, Goodman CB. Differential cytotoxicity of triphala and its phenolic constituent gallic acid on human prostate cancer LNCap and normal cells. Anticancer Res. 2011;11:3739–3745. [PMC free article] [PubMed] [Google Scholar]
- 9.Kaur S, Arora S, Kaur K, Kumar S. The in vitro antimutagenic activity of – triphala an Indian herbal drug. Food Chem Toxicol. 2002;40:527–534. doi: 10.1016/s0278-6915(01)00101-6. [DOI] [PubMed] [Google Scholar]
- 10.Macheix JJ, Fleuriet A, Billot J. Changes and metabolism of phenolic compounds in fruits. In: Macheix JJ, Fleuriet A, Billot J, editors. Fruit Phenolics. Boca Raton, Florida: CRC Press, Inc; 1990. pp. 149–153. [Google Scholar]
- 11.Isemura M, Saeki K, Kimura T, Hayakawa S, Minami T, Sazuka M. Tea catechins and related polyphenols as anti-cancer agents. Biofactors. 2000;13:81–85. doi: 10.1002/biof.5520130114. [DOI] [PubMed] [Google Scholar]
- 12.Appeldoorn CCM, Bonnefoy A, Lutters BCH, Daenens K, Van Berkel TJC, Hoylaerts MF, Biessen EAL. Gallic acid antagonizes P-selectin – mediated –platelet leukocyte interactions: Implications for the French paradox. Circulation. 2005;111:106–112. doi: 10.1161/01.CIR.0000151307.10576.02. [DOI] [PubMed] [Google Scholar]
- 13.Badisa RB, Tzakou O, Couladis M, Pilarinou E. Cytotoxic activities of some Greek Labiatae herbs. Phytother Res. 2003;5:472–476. doi: 10.1002/ptr.1175. [DOI] [PubMed] [Google Scholar]
- 14.Moul JW, Anderson J, Penson DF, Klotz LH, Soloway MS, Schulman CC. Early prostate cancer: prevention, treatment modalities, and quality-of-life issues. Eur Urol. 2003;44:283–293. doi: 10.1016/s0302-2838(03)00296-3. [DOI] [PubMed] [Google Scholar]
- 15.Cohen MB, Rokhlin OW. Mechanisms of prostate cancer cell survival after inhibition of AR expression. J Cell Biochem. 2009;106:363–371. doi: 10.1002/jcb.22022. [DOI] [PubMed] [Google Scholar]
- 16.Chang SS, Kibel AS. The role of systemic cytotoxic therapy for prostate cancer. BJU International. 2008;103:8–17. doi: 10.1111/j.1464-410X.2008.08256.x. [DOI] [PubMed] [Google Scholar]
- 17.Circu ML, Aw TY. Reactive oxygen species, cellular redox systems, and apoptosis. Free Radic Biol Med. 2010;48:749–762. doi: 10.1016/j.freeradbiomed.2009.12.022. [DOI] [PMC free article] [PubMed] [Google Scholar]
- 18.Mate JM, Sanchez-Jimenez FM. Role of reactive oxygen species in apoptosis: implications for cancer therapy. Int J Biochem Cell Biol. 2000;32:157–170. doi: 10.1016/s1357-2725(99)00088-6. [DOI] [PubMed] [Google Scholar]
- 19.Carmody RJ, Cotter TG. Signalling apoptosis: a radical approach. Redox Rep. 2001;2:77–90. doi: 10.1179/135100001101536085. [DOI] [PubMed] [Google Scholar]
- 20.Ueda S, Masutani H, Nakamura H, Tanaka T, Ueno M, Yodoi J. Redox control of cell death. Antioxid Redox Signal. 2002;4:405–414. doi: 10.1089/15230860260196209. [DOI] [PubMed] [Google Scholar]
- 21.Hail N, Jr, Cortes M, Drake EN, Spallholz JE. Cancer chemoprevention: A radical perspective. Free Radic Biol Med. 2008;45:97–110. doi: 10.1016/j.freeradbiomed.2008.04.004. [DOI] [PubMed] [Google Scholar]
- 22.Pelicano H, Carney D, Huang P. ROS stress in cancer cells and therapeutic implications. Drug Resist Update. 2004;7:97–110. doi: 10.1016/j.drup.2004.01.004. [DOI] [PubMed] [Google Scholar]
- 23.Kong Q, Beel JA, Lillehei KO. A threshold concept for cancer therapy. Med Hypotheses. 2000;55:29–35. doi: 10.1054/mehy.1999.0982. [DOI] [PubMed] [Google Scholar]
- 24.Sakaguchi N, Inoue M, Ogihara Y. Reactive oxygen species and intracellular Ca2+, common signals for apoptosis induced by gallic acid. Biochem Pharmacol. 1998;55:1973–1981. doi: 10.1016/s0006-2952(98)00041-0. [DOI] [PubMed] [Google Scholar]
- 25.Gil-Longo J, Gonzalez-Vazquez C. Vascular pro-oxidant effects secondary to the autoxidation of gallic acid in rat aorta. J Nutr Biochem. 2009;34:1–6. doi: 10.1016/j.jnutbio.2009.01.003. [DOI] [PubMed] [Google Scholar]
- 26.Nikolic G, Veselinovic A, Mitic Z, Zivanovic S. HPLC DAD study of gallic acid autoxidation in alkaline aqueous solutions and the influence of Mg (II) ion. Sci J Faculty Med Niš. 2011;4:219–24. [Google Scholar]
- 27.Chuang CY, Liu HC, Wu LC, Chen CY, Chang JT, Hsu SL. Gallic acid induces apoptosis of lung fibroblasts via a reactive oxygen species-dependent ataxia telangiectasia mutated-p53 activation pathway. J Agric Food Chem. 2010;58:2943–2951. doi: 10.1021/jf9043265. [DOI] [PubMed] [Google Scholar]
- 28.Valko M, Leibfritz D, Moncol JM, Cronin TD, Mazur M, Telser J. Free radicals and antioxidants in normal physiological functions and human disease. Int J Biochem Cell Biol. 2007;39 :44–84. doi: 10.1016/j.biocel.2006.07.001. [DOI] [PubMed] [Google Scholar]
- 29.Valko M, Rhodes CJ, Moncol J, Izakovic M, Mazur M. Free radicals, metals and antioxidants in oxidative stress-induced cancer. Chem Biol Interact. 2006;160:1–40. doi: 10.1016/j.cbi.2005.12.009. [DOI] [PubMed] [Google Scholar]
- 30.Maurya DK, Nandakumar N, Devasagayam TPA. Anticancer proterty of gallica cid in A549, a human lung adenocarcinoma cell line, and possible mechanism. J Clin Biochem Nutr. 2011;48 :85–90. doi: 10.3164/jcbn.11-004FR. [DOI] [PMC free article] [PubMed] [Google Scholar]
- 31.Ji BC, Hsu WH, Yang JS, Hsia TC, Lu CC, Chiang JH. Gallic acid induces apoptosis via caspase-3 and mitochondrion-dependent pathways in vitro and suppresses lung xenograft tumor growth in vivo. J Agric Food Chem. 2009;57:7596–7604. doi: 10.1021/jf901308p. [DOI] [PubMed] [Google Scholar]
- 32.Niemetz R, Gross GG. Enzymology of gallotannin and ellagitannin biosynthesis. Phytochemistry. 2005;66:2001–2011. doi: 10.1016/j.phytochem.2005.01.009. [DOI] [PubMed] [Google Scholar]
- 33.Shahrzad S, Aoyagi K, Winter A, Koyama A, Bitsch I. Pharmacokinetics of gallic acid and its relative bioavailability from tea in healthy humans. J Nutr. 2001;131:1207–1210. doi: 10.1093/jn/131.4.1207. [DOI] [PubMed] [Google Scholar]


