Abstract
Objective:
To determine the association between altered thyroid hormones and insulin resistance (IR).
Materials and Methods:
Eight euthyroid (EU), eight hypothyroid (HO), and eight hyperthyroid (HR) patients with no past medical history were studied in this cross-sectional study at the Care Institute of Medical Sciences, Ahmedabad, India, The fasting blood sample were analyzed for thyroid stimulating hormone (TSH), lipid profile, insulin, and glucose. Homeostatic model assessment (HOMA) was calculated for assessing IR.
Results:
HOMA values were significantly higher in HR and HO groups as compared to the EU group (P < 0.05). Insulin levels were also found to be significantly increased in HR and HO groups as compared to the EU group (P < 0.05). Cholesterol, triglycerides (TG), and low density lipoprotein (LDL) were significantly raised in HO as compared to EU and HR groups (P < 0.05) whereas high density lipoprotein levels (HDL) were lower. HOMA and insulin were found to be positively correlated with TSH in HO and negatively in HR.
Conclusion:
Thyroid disorder, including both hypo- and hyper have been associated with IR due to various mechanisms such as altered insulin secretion and lipid levels. IR was comparable in patients with both HO and HR. Although HO and HR constitute an IR state, more studies need to be done in order to clarify the underlying pathogenic mechanism. Thus, an altered thyroid state can lead to IR leading to glucose-related disorder such as diabetes dyslipidemia.
Keywords: Hypothyroidism, hyperthyroidism, insulin resistance
INTRODUCTION
Thyroid hormones (TH) play an important role in regulating energy balance, metabolism of glucose, and lipids.[1] While TH oppose the action of insulin and stimulate the hepatic gluconeogenesis and glycogenolysis they up-regulate the expression of genes such as glucose transporter type-4 (GLUT--4) and phosphoglycerate kinase, involved in glucose transport and glycolysis, respectively, thus acting synergistically with insulin facilitating glucose disposal and utilization in peripheral tissues.[2–5] The prevalence of thyroid disease in patients with diabetes is significantly higher than that in the general population.[6] This indicates a possible interplay between thyroid status and insulin sensitivity. Homeostatic model assessment (HOMA) is a method for assessing β-cell function and insulin resistance (IR) from basal (fasting) glucose and insulin or C-peptide concentrations. The homeostasis model assessment (HOMA) for IR (HOMA-IR) derives estimates of insulin sensitivity from the mathematical modeling of fasting plasma glucose and insulin concentrations.[7] Complex interplay between thyroid function and IR has been implicated in diabetic dyslipidemia.[8] In the light of the existing reports, we decided to evaluate the correlation between IR and altered thyroid state clinically and to assess β-cell function and IR by HOMA-IR.
MATERIALS AND METHODS
The study was conducted in the Care Institute of Medical Sciences, Ahmedabad, India. The patients visiting the thyroid clinic were screened and eight patients each suffering from hypothyroidism (HO) and hyperthyroidism (HR) was enrolled in the study after prior consent (Ethics Approval No. I–113). The inclusion criteria adopted were: age 18–45 years, newly diagnosed and untreated cases for HR or HO. Patients suffering from diabetes, having previous history of thyroid disorder other medications that alter thyroid functions and lipid levels led to exclusion from the study. Pregnancy and lactating women also accounted for exclusion from the study. Blood samples for the estimation of all the parameters were collected from the patients after an overnight fast. The thyroid stimulating hormone profile (TSH) was estimated using ultra-sensitive sandwich chemiluminescence immuno assay and insulin levels were estimated using solid phase radio immuno assay using commercially available kits. The lipid profile and sugar levels were analyzed on Micro Labs Bioanlyaser (300) using commercially available kits. IR was estimated using homeostasis model assessment (HOMA-IR) from fasting serum glucose and insulin using the Oxford HOMA calculator (http://www.dtu.ox.ac.uk/homa/index.html). Normal range for TSH was (0.3–5.5) μIU/ml. Patients with high TSH and low TSH were designated to be HO and HR, respectively. Patients with normal TSH were considered euthyroid (EU). The normal range for fasting insulin was 2.6–24.9 μIU/ml.
Statistical analysis
Baseline characteristics of the study participants were expressed in Mean ± SEM and percentage. One way ANOVA followed by the Newman–Keuls multiple comparison test was used to analyze differences in baseline characteristics between the study groups and the control group. The association between the various parameters in different groups was evaluated using Pearson's correlation coefficient. P < 0.05 was considered statistically significant. Statistical analysis was performed using Graph Pad Prism version 5.04 software.
RESULTS
TSH levels were high in HO (31.5 + 17.51) and low in HR (0.023 + 0.009) groups as compared to the EU group (1.9 + 0.19). Insulin levels were significantly higher in the HR group (29.37 + 8.48) as compared to the HO group (12.11 + 2.2) and the EU group (3.711 + 0.22). BMI were significantly high in the HO group (24.34 + 1.03) and were significantly low in the HR (21 + 2.16) group as compared to the EU group (22.64 + 1.53). Mean HOMA IR in controls were (0.43 + 0.07). HOMA-IR was higher in the HR group (3.45 + 2.51) vs. the HO group (1.9 + 0.60) as well as in both HR and HO groups as compared to controls (0.43 + 0.07) [Table 1 and Figure 1].
Table 1.
Base line characteristic and biochemical parameters of different study groups
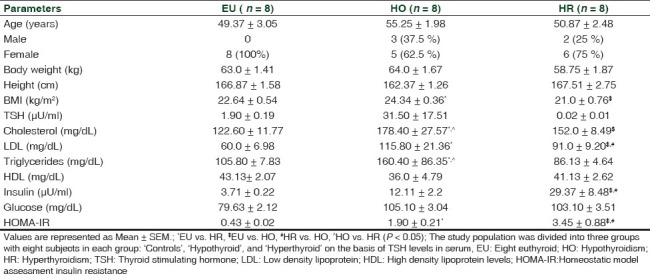
Figure 1.
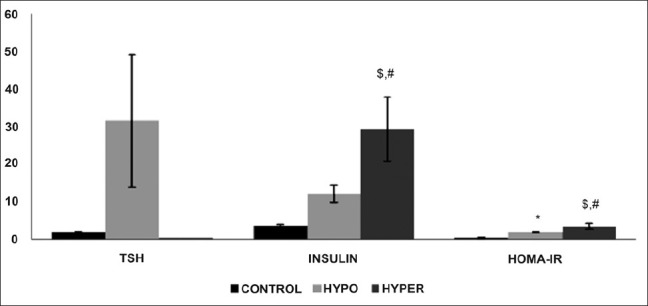
Effect of altered thyroid state on TSH, insulin HOMA-IR levels in study patients. Values are represented as mean + SEM. *EU vs. HR, $EU vs. HO, #HR vs. HO (P < 0.05)
The triglycerides levels were significantly higher in the HO group (160.4 + 86.35) as compared to the HR group (86.13 + 4.64) and EU group (105.8 + 7.83), whereas the total cholesterol and LDL levels were significantly higher in the HO group (178.4 + 27.57) vs. the HR group (152 + 8.487) as well as in both HR and HO groups as compared to the EU group (122.6 + 11.77). High density lipoprotein levels (HDL) were decreased in both HO and HR groups as compared to EU [Table 1 and Figure 2].
Figure 2.
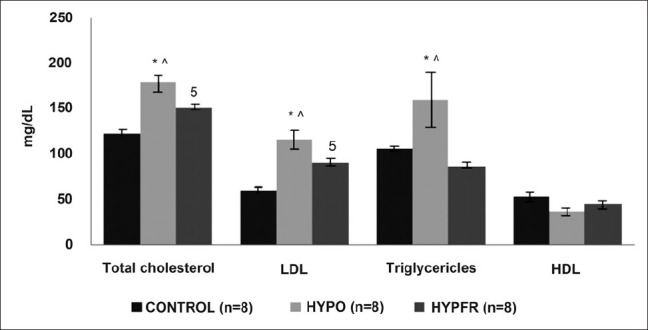
Effect of altered thyroid state on the lipid profile in study population. Values are represented as Mean + SEM. *EU vs. HR, $EU vs. HO, #HR vs. HO, ∧HO vs. HR (P < 0.05)
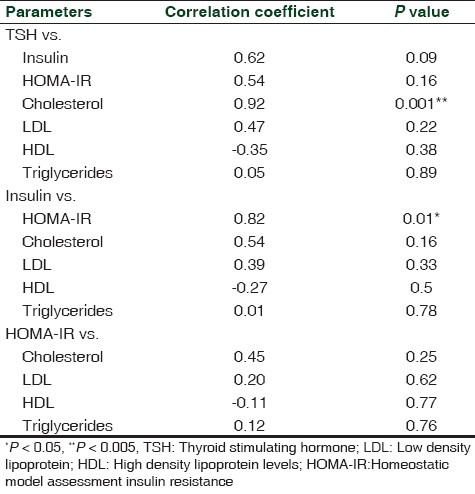
The Pearson's correlation coefficient for the relationships between serum TSH and HOMA IR as well as TSH and lipid parameters HO are shown in Table 2. Our clinical study showed that TSH levels were positively correlated with insulin and HOMA IR in patients with HO (r = 0.62, P = 0.09; r = 0.54, P = 0.16, respectively). The serum TSH levels significantly positively correlated with total cholesterol (r = 0.92, P < 0.005), while positively correlated with LDL and triglycerides levels, and negatively with the HDL level in the HO group (r = 0.47, P = 0.22; r = 0.05, P = 0.89; r = –0.35, P = 0.38, respectively). The serum insulin levels were significantly positively correlated with HOMA-IR (r = 0.82, P < 0.05), and positively correlated total cholesterol, LDL, and triglycerides levels while negatively correlated with HDL levels (r = 0.54, P = 0.16; r = 0.39, P = 0.33; r = 0.01, P = 0.78; r = –0.27, P = 0.5, respectively). Similarly, HOMA IR was also positively associated with TC, LDL and triglycerides levels while negatively correlated with HDL levels (r = 0.45, P = 0.25; r = 0.20, P = 0.62; r = 0.12, P = 0.76; r = –0.11, P = 0.77).
Table 2.
Correlation between different parameters in hypothyroid patients
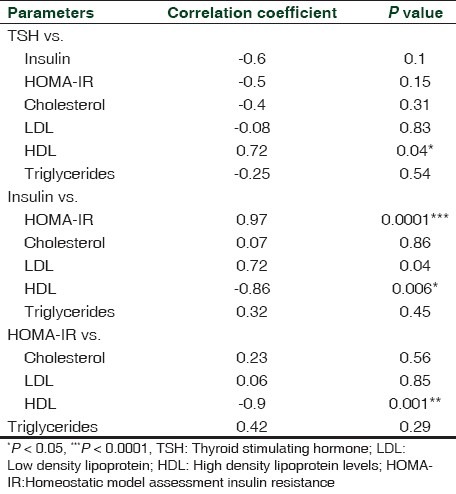
The Pearson's correlation coefficient for the relationships between serum TSH and HOMA IR as well as TSH and lipid parameters in HR patients are shown in Table 3. Our clinical study showed that TSH levels were negatively correlated with insulin and HOMA IR in patients with HR (r = –0.6, P = 0.1; r = –0.5, P = 0.15, respectively). The serum TSH levels were negatively correlated with total cholesterol, LDL, and triglycerides levels, and significantly positively with the HDL level in HR subjects ( r = –0.4, P = 0.31; r = –0.08, P = 0.83; r = –0.25, P = 0.54; r = 0.72, P = 0.04, respectively). The serum insulin levels were significantly positively correlated with HOMA-IR (r = 0.97, P < 0.0001), and positively correlated total cholesterol, LDL and triglycerides levels while significantly negatively correlated with HDL levels (r = 0.07, P = 0.86; r = 0.72, P = 0.04; r = 0.32, P = 0.45; r = –0.86, P = 0.006, respectively). Similarly, HOMA IR was also positively associated with TC, LDL, and triglycerides levels while significantly negatively correlated with HDL levels (r = 0.23, P = 0.56; r = 0.06, P = 0.85; r = 0.42, P = 0.29; r = –0.9, P < 0.005).
Table 3.
Correlation between different parameters in hyperthyroid patients
DISCUSSION
In this study we have addressed the possible linkage among TSH, IR, and serum concentrations of lipids in both HO and HR population. Thyroid disease is much more prevalent in women than men. Women are five to eight times more likely to develop HO and eight to 10 times more likely to develop HR.[9] Thyroid disease can increase the risk of cardiovascular disease, infertility, and osteoporosis.
In recent times tremendous interest has been raised in the influence of TH action on insulin levels. Our study illustrates the complex interplay between thyroid hormonal status and insulin levels in the pathogenesis of IR. In both, HO and HR insulin levels were found to be higher.
Cholesterol, TG, are LDL were significantly raised in HO as compared to EU and HR whereas the HDL level was lower. This is in consistence with the well-known association of HO with the lipid profile.[10] The main pathophysiological basis underlying glucose intolerance, dyslipidemia, abdominal obesity, and hypertension has been attributed to IR.[11]
In both hyper- as well as hypothyroid groups, there was significant increase in LDL levels. The amount of insulin specifically bound and the number of insulin receptors per cell were inversely correlated with the LDL level. The number of insulin receptors and the amount of insulin bound in the tested subjects with increased LDL were correspondingly low[12] which could further lead to the IR state.
Considering the insulin and glucose factor in the development of IR glucose metabolism after glucose loading was found to be decreased in both hypo- as well as hyperthyroid groups as compared to the control group. This may be due to either impaired insulin stimulated glucose disposal or decreased insulin-stimulated glucose transport in monocytes due to impaired translocation of GLUT4 glucose transporters on the plasma membrane as observed in the previous studies in humans.[13,14]
IR is a cardinal feature of type 2 diabetes mellitus and increased risk of dyslipidemia along with relatively frequently found mild thyroid dysfunction. IR is assessed by the calculation of HOMAIR. HOMA of β-cell function and IR is a method for assessing β-cell function and IR from basal glucose and insulin or C-peptide concentrations.[15] The relationship between glucose and insulin in the basal state reflects the balance between hepatic glucose output and insulin secretion, which is maintained by a feedback loop between the liver and β-cells.[16] The use of HOMA to estimate insulin sensitivity and β-cell function helps to compare β-cell function and insulin sensitivity in subjects with abnormal glucose tolerance. HOMA and insulin were found to be positively correlated with TSH in HO and negatively in HR suggesting that even subtle increase or decrease in the thyroid levels can lead to IR.
CONCLUSION
Thyroid disorder, including both hypo- and hyper have been associated with IR due to various mechanism such as altered insulin secretion and lipid levels. Although hypo- and hyperthyroidism constitute an IR state, more studies need to be done in order to clarify the underlying pathogenic mechanism. Thus an altered thyroid state can lead to IR leading to glucose-related disorder such as diabetes dyslipidemia.
Footnotes
Source of Support: Nil
Conflict of Interest: None declared.
REFERENCES
- 1.Chubb SA, Davis WA, Davis TM. Interactions among thyroid function, insulin sensitivity, and serum lipid concentrations: The Fremantle diabetes study. J Clin Endocrinol Metab. 2005;90:5317–20. doi: 10.1210/jc.2005-0298. [DOI] [PubMed] [Google Scholar]
- 2.Raboudi N, Arem R, Jones RH, Chap Z, Pena J, Chou J, et al. Fasting and postabsorptive hepatic glucose and insulin metabolism in hyperthyroidism. Am J Physiol. 1989;256:E159–66. doi: 10.1152/ajpendo.1989.256.1.E159. [DOI] [PubMed] [Google Scholar]
- 3.Weinstein SP, O’Boyle E, Fisher M, Haber RS. Regulation of GLUT2 glucose transporter expression in liver by thyroid hormone: Evidence for hormonal regulation of the hepatic glucose transport system. Endocrinol. 1994;135:649–54. doi: 10.1210/endo.135.2.8033812. [DOI] [PubMed] [Google Scholar]
- 4.Viguerie N, Millet L, Avizou S, Vidal H, Larrouy D, Langin D, et al. Regulation of human adipocyte gene expression by thyroid hormone. J Clin Endocrinol Metab. 2002;87:630–4. doi: 10.1210/jcem.87.2.8200. [DOI] [PubMed] [Google Scholar]
- 5.Clement K, Viguerie N, Diehn M, Alizadeh A, Barbe P, Thalamas C, et al. In vivo regulation of human skeletal muscle gene expression by thyroid hormone. Genome Res. 2002;12:281–91. doi: 10.1101/gr.207702. [DOI] [PMC free article] [PubMed] [Google Scholar]
- 6.Canaris GJ, Manowitz NR, Mayor G, Ridgway EC. The Colorado thyroid disease prevalence study. Arch Intern Med. 2000;160:526–34. doi: 10.1001/archinte.160.4.526. [DOI] [PubMed] [Google Scholar]
- 7.Singh BM, Goswami B, Mallika V. Association Between Insulin Resistance and Hypothyroidism in Females Attending a Tertiary Care Hospital. Indian J Clin Biochem. 2010;25:141–5. doi: 10.1007/s12291-010-0026-x. [DOI] [PMC free article] [PubMed] [Google Scholar]
- 8.Chubb SA, Davis WA, Inman Z, Davis TM. Prevalence and progression of subclinical hypothyroidism in women with type 2 diabetes: The Fremantle Diabetes Study. Clin Endocrinol. 2005;62:480–6. doi: 10.1111/j.1365-2265.2005.02246.x. [DOI] [PubMed] [Google Scholar]
- 9.Sisk J. Thyroid Disease in Women-Diagnostic Conundrum. Today's Dietitian. The Magazine for nutritional professionals. 2004;6:42. [Google Scholar]
- 10.Tayal D, Goswami B, Gupta VK, Mallika V. Evaluation of lipid profile in hypothyroid patients. Our experience. Thyroid Res Pract. 2008;5:43–7. [Google Scholar]
- 11.Bakker SJ, Ter Maaten JC, Popp-Snijders C, Slaets JP, Heine RJ, Gans RO, et al. The relationship between thyrotropin and low density lipoprotein cholesterol is modified by insulin sensitivity in healthy euthyroid subjects. J Clin Endocrinol Metab. 2001;86:1206–11. doi: 10.1210/jcem.86.3.7324. [DOI] [PubMed] [Google Scholar]
- 12.Sanghvi A, Virji MA, Warty V, Dimasi MJ. Differential suppression of lymphocyte cholesterol synthesis by low density lipoprotein and erythrocyte insulin receptors in normolipidemic subjects. Atherosclerosis. 1983;49:307–18. doi: 10.1016/0021-9150(83)90141-7. [DOI] [PubMed] [Google Scholar]
- 13.Maratou E, Hadjidakis DJ, Peppa M, Alevizaki M, Tsegka K, Lambadiari V, et al. Studies of insulin resistance in patients with clinical and subclinical hyperthyroidism. Eur J Endocrinol. 2010;163:625–30. doi: 10.1530/EJE-10-0246. [DOI] [PubMed] [Google Scholar]
- 14.Maratou E, Hadjidakis DJ, Kollias A, Tsegka K, Peppa M, Alevizaki M, et al. Studies of insulin resistance in patients with clinical and subclinical hypothyroidism. Eur J Endocrinol. 2009;160:785–90. doi: 10.1530/EJE-08-0797. [DOI] [PubMed] [Google Scholar]
- 15.Wallace TM, Levy JC, Matthews DR. Use and Abuse of HOMA Modeling. Diabetes Care. 2004;27:1487–95. doi: 10.2337/diacare.27.6.1487. [DOI] [PubMed] [Google Scholar]
- 16.Turner RC, Holman RR, Matthews D, Hockaday TD, Peto J. Insulin deficiency and insulin resistance interaction in diabetes: Estimation of their relative contribution by feedback analysis from basal plasma insulin and glucose concentrations. Metabolism. 1979;28:1086–96. doi: 10.1016/0026-0495(79)90146-x. [DOI] [PubMed] [Google Scholar]


