Abstract
This technical report provides detailed information on the rationale for using a common computer spreadsheet program (Microsoft Excel®) to calculate various forms of interobserver agreement for both continuous and discontinuous data sets. In addition, we provide a brief tutorial on how to use an Excel spreadsheet to automatically compute traditional total count, partial agreement-within-intervals, exact agreement, trial-by-trial, interval-by-interval, scored-interval, unscored-interval, total duration, and mean duration-per-interval interobserver agreement algorithms. We conclude with a discussion of how practitioners may integrate this tool into their clinical work.
Keywords: computer software, interobserver agreement, Microsoft Excel, technology

The notion that practicing behavior analysts should collect and report reliability or interobserver agreement (IOA) in behavioral assessments is evident in the Behavior Analyst Certification Board's (BACB) assertion that behavior analysts be competent in the use of “various methods of evaluating the outcomes of measurement procedures, such as inter-observer agreement, accuracy, and reliability” (BACB, 2005). Moreover, Vollmer, Sloman, and St. Peter Pipkin (2008) contend that the exclusion of such data substantially limits any interpretation of efficacy of a behavior change procedure. As such, a prerequisite to claims of validity in any study involving behavioral assessment should be the inclusion of reliability data (Friman, 2009). Given these considerations, it is not surprising that a recent review of Journal of Applied Behavior Analysis (JABA) articles from 1995–2005 (Mudford, Taylor, & Martin, 2009) found that 100% of the articles reporting continuously recorded dependent variables included IOA calculations. These data, along with previously published accounts of reliability procedures in JABA (Kelly, 1977), suggest that the inclusion of IOA is indeed a hallmark—if not a standard—of behavioral assessment.
Despite general expectations that applied behavior analysts know the various calculations of reliability statistics (BACB, 1995) and report IOA in their behavioral assessments (Kelly, 1977; Mudford et al., 2009), competing professional responsibilities may preclude appropriate analyses of IOA in clinical settings. Beyond the hurdles of competing responsibilities, Vollmer et al. (2008) outline several other barriers to the accurate calculation of reliability. Such barriers include (a) insufficient training on measurement protocols, (b) complexity of the procedure/analysis, and/or, (c) failure to generalize these data collection/analysis skills from instructional situations. To assist in overcoming these barriers, we describe an automated tool for calculating various IOA statistics that is compatible with Excel 2010 (a commonly used spreadsheet software program available to most computer users; hereafter referred to simply as Excel). The Excel calculator referenced throughout the remainder of this article may be downloaded from Behavior Analysis in Practice's Supplemental Materials web-page (http://www.abainternational.org/Journals/bap_supplements.asp). When specific references to the calculator are made, the reader is encouraged to access the calculator to view these components of the tool.
Advantages of Using the Automated Calculator
Since Spearman and Brown first reported ways to quantify reliability between data sources in 1910, researchers have refined ways to quantitatively report the association between independent measures (see Brennan, 2001). Today's researchers are fortunate to have many statistical software packages (e.g., SPSS, STATA) available that can instantly compute a variety of reliability measures, such as Cronbach's alpha or Pearson's product-moment correlation coefficient. Although such statistics may be beneficial for classical test score theory or traditional views of reliability of psychological scales, these statistics do not lend themselves well to evaluating data from single-subject experimental designs. Moreover, the statistics software referenced above do not include the behavior analytic standard algorithms necessary for computing reliability of single-subject data, such as interval-by-interval or mean-duration-per-occurrence statistics. As such, the use of Excel is advantageous for behavior analysts, because this program is widely available and easily designed for user-defined formulas and customized analyses. Most relevant to the present discussion is the notion that well-designed spreadsheets may reduce the effort of computing data and improve the accuracy of analyses by users unfamiliar with statistics or computer programming. The IOA calculator described herein will provide an accessible, accurate, and easy to use Excel tool for practicing behavior analysts.
Accessibility. That Excel is easily accessible across users should not be underestimated by practicing behavior analysts. Behavior analysts often serve a role on interdisciplinary teams, typically consisting of allied health professionals, home providers, and parents. Thus, sharing data across sites is often necessary. In a 2003 survey of college students, Stephens found that 90% of the students owned a home computer, with 70% of the students indicating experience with using Excel software. Considering the date of the study, as well as our observation that many allied health professionals have training beyond the bachelor's level of education, it is reasonable to assume that most members of a multidisciplinary team will have access to Excel, and likely have some experience with its use. Yet another advantage is that for individuals who may not already own Excel, the costs associated with purchasing this software are significantly less than advanced statistical packages (Warner & Meehan, 2001). Moreover, individuals with institutional affiliations may be able to purchase Excel at reduced rates, or may already have access to Excel due to the use of agency-provided software and/or computers. In the case of our IOA calculator, we chose to program the tool using Excel to promote the exchange of datasets and enhance the ability to share files with colleagues and/or caregivers based upon the discussions cited above. Finally, the Excel file type permits many users the ability to obtain the calculator, either through sharing of the file or via download, without the need for advanced or expensive software packages.
Accuracy and ease of use. Although we could not find any empirical reports indicating that computations performed with calculators or computer programs are indeed more accurate and efficient than completing these by hand, it is reasonable to assume that analytical errors are reduced when the process is automated. Dixon et al. (2009) report that the use of a detailed task analysis for using Excel 2007 resulted in more accurate and faster creation of single-case design figures than a more dated task analysis published by Carr and Burkholder (1998). These data suggest that, if provided with detailed instructions, Excel skills can improve when using this program for behavior analytic purposes. Research from outside behavior analysis indicates that high school (Christensen & Stephens, 2003; Neurath & Stephens, 2006) and college (Stephens, 2003; Warner & Meehan, 2009) students alike find Excel to be a useful tool in scientific courses, and prefer using this software to alternatives. Although not structured as formal social validity assessments, these studies lend support to the opinion that Excel is indeed user-friendly and desired when mathematical analyses are needed.
Powell, Baker, and Larson's (2008) review of the literature on common spreadsheet errors indicate a number of antecedent interventions that could mitigate the chances that users of our calculator will produce data entry errors. Specifically, Powell et al. point out that common spreadsheet errors may be organized into either qualitative or quantitative error categories. To reduce the likelihood of both types of errors, we opted to (a) save each tool as an independent tab (i.e., worksheet) within the Excel workbook, (b) “lock” text within the spreadsheets so that terms and labels are not mistakenly edited, (c) hide spreadsheet information such as computation algorithms so that users do not accidentally edit information that is linked to quantitative analyses, and (d) avoided having multiple calculators or IOA algorithms within any one worksheet to dissuade “fishing” for higher IOA statistics.
Selecting an Appropriate IOA Statistic
Because a large proportion of articles published in the field's flagship journal, Journal of Applied Behavior Analysis, rely upon simple total count/duration or interval-by-interval measures of reliability (see Mudford et al., 2009), it may be surprising to some readers that numerous formulae exist from which the behavior analyst can choose to conduct an IOA analysis. Due to the preeminent status the field has placed on Cooper, Heron, and Heward's Applied Behavior Analysis 2007 textbook, along with our own professional experience that this book features the most comprehensive discussion of the various IOA algorithms used in our field, our discussion of IOA procedures below is based primarily upon Chapter 5 of that text. Thus, readers interested in this topic are strongly encouraged to consult Cooper et al.'s textbook. We will, however, reference other literature when warranted. For more information on the practical aspects of IOA data collection (e.g., how often to collect such data, how to interpret and use these data, acceptable levels of IOA), the reader is advised to consult Vollmer et al. (2008), also published in Behavior Analysis in Practice.
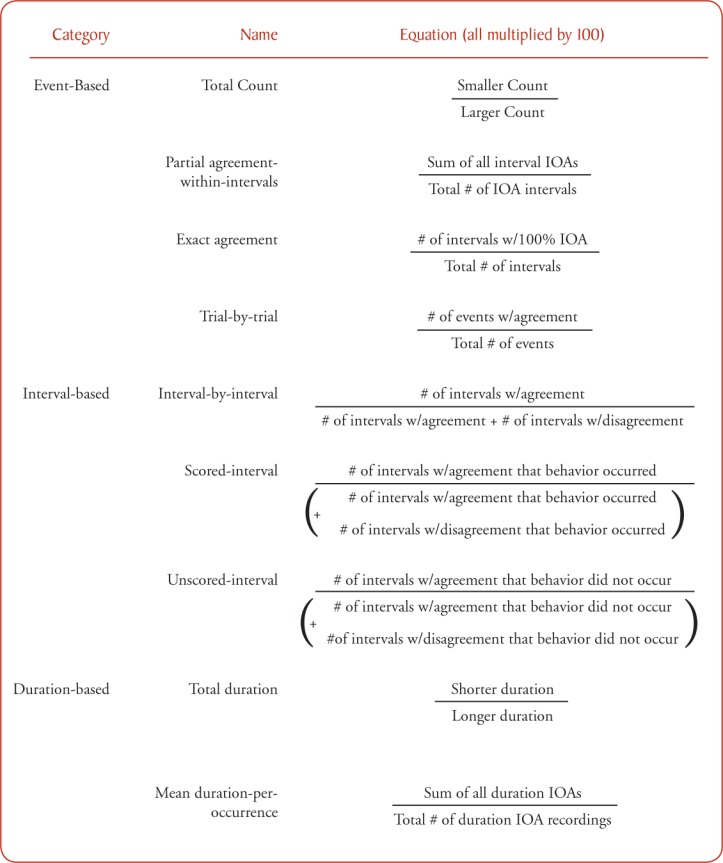
Three broad categories of reliability metrics will be discussed throughout the remainder of this article: (a) event-based, (b) interval-based, and (c) duration-based. Event-based measures may be considered any form of IOA based upon data collected using event recording or frequency counts during observations. Interval-based measures derive from data collected within interval recordings (e.g., partial- or whole-interval recordings) or as part of a time-sampling procedure. Finally, duration-based algorithms are used when data are derived from timings (e.g., latencies, durations, inter-response times). Interested readers can consult each of the three tables in this manuscript for relative strengths of each algorithm and can view the mathematical form of each algorithm in Appendix A. Nevertheless, the user should always consult the research literature for precise information on when, why, and how to use the algorithms, given the nuanced aspects of their data. Note that the calculator spreadsheet, an example of a completed calculator spreadsheet with a brief discussion of the IOA analyses, is available on Behavior Analysis in Practice's Supplemental Materials webpage (http://www.abainternational.org/Journals/bap_supplements.asp). We direct the interested reader to more thorough discussions of IOA algorithms and information on how to decide upon a proper metric in pages 114 through 120 of Cooper et al. (2007).
Choosing an Event-Based Algorithm
Common among all event-based IOA algorithms is the analysis of agreement on frequency counts and event recordings. These measures consist of (a) total count, (b) partial agreement-within-intervals, (c) exact agreement, and (d) trial-by-trial IOA algorithms. Following a brief overview of each event-based algorithm, Table 1 summarizes the strengths of each of the four event-based algorithms for behavior analytic considerations of reliability. As a running example for event-based IOA, suppose a research team collects frequency data for a target response across 15 1-m observations (see Figure 1).
Table 1.
Strengths Associated With Use of Event-Based IOA Algorithms
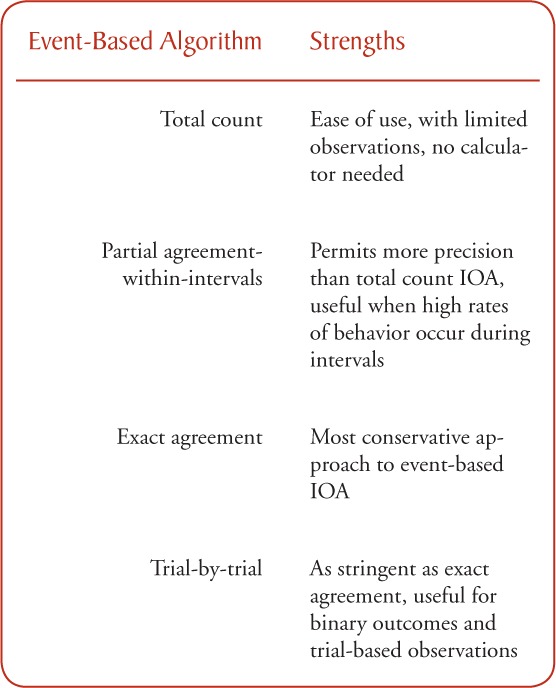
Figure 1.
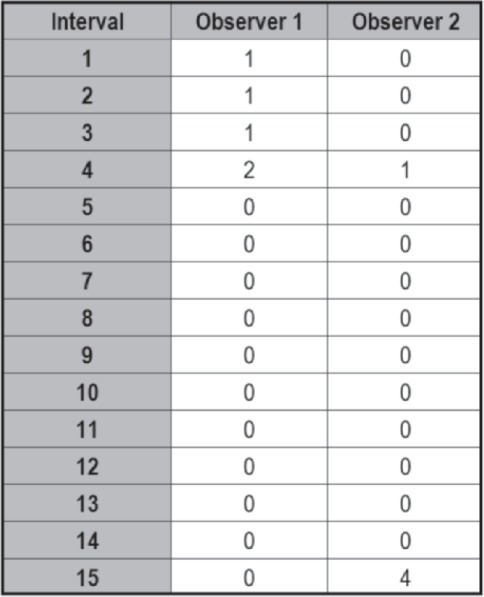
Sample data stream for event-based IOA obtained from two independent observers across a 15-min observation.
Total count IOA. The total count IOA algorithm is the most simple way to assess IOA with event-based measures. Total count IOA simply denotes the percentage of agreement between two observers' frequency/event recordings for an entire observation, and is calculated by dividing the smaller total count observed (from one observer, relative to the other) by the larger total count (from the other observer).
This is not a very stringent agreement procedure because a total count IOA of 100% could result from two observers recording entirely different instances of target responses within this same 15-m observation. In the example data stream presented in Figure 1, Observer 1 records three instances of the target response during the first 3m (one each minute) of her observation, two instances during minute 4, and misses all other instances for the remaining 12 m. During the same hypothetical observation, Observer 2 missed the three instances during minutes 1–3, records one instance of the target response during minute 4, but records four instances during minute 15. Although these are wholly different events, the resultant total count IOA would still equal 100%.
Partial agreement-within-intervals IOA. To circumvent the described disadvantage associated with using the total count IOA algorithm, the partial agreement-within-intervals approach (sometimes referred to as “mean count-per-interval” or “block-by-block”) breaks the observation period down into small intervals, and then examines agreement within each interval. Thus, this increases the accuracy of the agreement measure by reducing the likelihood that total counts were derived from differing events of the target responses within the observation. By breaking the example observation from Figure 1 down into smaller time increments/intervals (15 1-m intervals), the partial agreement-within-intervals approach calculates the IOA per interval and divides by the total number of intervals. In this case, IOA would be 50% (or .5) for interval 4, 100% (or 1.0) for intervals 5 through 14 (both agreed that 0 target responses occurred each of those intervals), but 0% for intervals 1 through 3, as well as interval 15. Thus, the partial agreement-within-intervals approach would be derived by summing the IOA values (in this case, 10.5) by the total number of intervals (15), which gives a more precise and lower IOA percent (70%) than the 100% value obtained using the total count algorithm.
Exact agreement IOA. It is evident that the partial agreement-within-intervals approach is more stringent than total count as a measure of agreement between two observers. Nevertheless, the most conservative approach to IOA would be to discount any discrepancies as a total lack of agreement during such intervals, counting any discrepancy as zero. Exact agreement is such an approach. Using this measure, only exact agreements during an interval result in that interval being scored as 100% (or 1.0). Using our running example, exact agreements would be obtained for intervals 5–14, or 10 of the 15 intervals. Dividing 10 by the total number of intervals (15) results in IOA of 66.7%—an agreement score slightly lower than the partial agreement-within-intervals approach.
Trial-by-trial IOA. Astute readers will note that the aforementioned event-based IOA algorithms are adequate for free-operant responses, those responses that can occur any time and are not anchored to occasioning events, but these measures do not explicitly account for trial-based responding in which binary outcomes are measured (e.g., occurrence/non-occurrence, yes/no, on-task/off-task). Thus, trial-by-trial IOA measures the number of trials with agreement divided by the total number of trials. This metric is as stringent as the exact agreement approach.
Choosing an Interval-Based IOA Algorithm
Interval-based IOA algorithms assess the agreement between two observers' interval-based data (including time samples). These measures consist of (a) interval-by-interval, (b) scored-interval, and (c) unscored-interval IOA algorithms. Following a brief overview of each interval-based algorithm, Table 2 summarizes the strengths of each of the three interval-based algorithms. As a running example of interval-based IOA, consider the hypothetical data stream depicted in Figure 2, in which two independent observers record the occurrence and non-occurrence of a target response across seven consecutive intervals. In the first and seventh intervals, the observers disagree on the occurrence. However, both observers agree that a response did not occur during the second, third, and fourth intervals. Finally, both observers also agree that at least one response did occur during the fifth and sixth intervals.
Table 2.
Strengths Associated With Use of Interval-Based IOA Algorithms
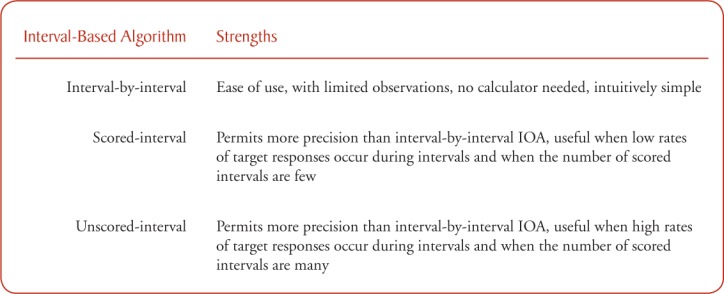
Figure 2.
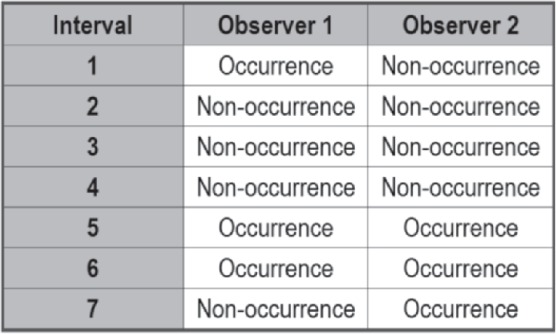
Sample data stream for interval-based IOA obtained from two independent observers recording the occurrence and non-occurrence of a target response across seven intervals.
Interval-by-interval IOA. In short, the interval-by-interval method assesses the proportion of intervals in which both observers agreed on whether the target response occurred. Note that this includes agreement on both the presence and absence of the target response. This is calculated by adding the total number of agreed upon intervals by the sum of the number of agreed and disagreed upon intervals. As one might expect, this approach often results in high agreement statistics. As Cooper et al. (2007) report, this is especially true when partial-interval recordings are used. In the example data in Figure 2, the observers disagree on the first and seventh intervals, resulting in an interval-by-interval agreement score of 71.4% (5/7).
Scored-interval IOA. One approach to enhancing the accuracy of two observers' agreement in interval recording is to simply restrict the agreement analyses to instances in which at least one of the observers recorded a target response in an interval. Intervals in which neither observer reported a target response are excluded from the calculation to provide a more stringent agreement statistic. Cooper et al. (2007) suggest that scored-interval IOA (also referred to in research literature as “occurrence” agreement) is most advantageous when target responses occur at low rates. In the example data in Figure 2, the second, third, and fourth intervals are ignored for calculation purpose because neither observed scored a response in those intervals. Thus, the IOA statistic is calculated from the first, fifth, sixth, and seventh intervals only. Because there was only agreement on half the intervals (the fifth and sixth intervals), the agreement score is 50% (2/4).
Unscored-interval IOA. Unscored-interval IOA (also referred to in research literature as “nonoccurrence” agreement) IOA algorithm is also more stringent than simple interval-by-interval approaches by only considering intervals in which at least one observer records the absence of the target response. The rationale for the unscored-interval IOA is similar to that for scored-interval IOA, with the exception that this metric is best for high rates responding (Cooper et al., 2007). In the example data in Figure 2, the fifth and sixth intervals are ignored for calculation purpose because both observers scored a response in those intervals. Thus, the IOA statistic is calculated from the remaining five intervals. Because there was only agreement on three of the five the intervals (the second, third, and fourth intervals), the agreement score is 60%.
Choosing a Duration-Based IOA Algorithm
Duration-based IOA algorithms assess the agreement between two observers' timing data. These measures consist of (a) total duration and (b) mean-duration-by-occurrence. Table 3 summarizes the strengths of both algorithms. As a running example of duration-based IOA, consider the hypothetical data stream depicted in Figure 3, in which two independent observers recorded durations of a target response across four occurrences.
Table 3.
Strengths Associated With Use of Duration-Based IOA Algorithms

Figure 3.
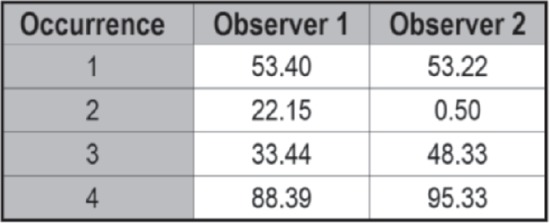
Sample data stream for duration-based IOA obtained from two independent observers across four occurrences of a target response.
Total duration IOA. Similar to the total count IOA for event-based data, total duration IOA provide a relatively insensitive measure of observers' agreement. Total duration IOA aggregates all timings into one summed duration for each observer, and is then computed by dividing the smaller duration by the larger duration. Thus, the more timings, the more opportunities there are for discrepant data to be masked by this metric. As depicted in Figure 3, the two observers' recorded durations for the second, third, and fourth occurrences of the response are substantially discrepant. However, each observers' sums equal the others,' resulting in total duration IOA of 100%.
Mean-duration-per-occurrence IOA. When the number of timings is high, it is important to limit the aggregation of data to detect possible discrepancies in two observers' duration data. The mean-duration-per-occurrence IOA algorithm achieves this by determining an IOA score for each timing, and then dividing by the total number of timings in which both observers collected data. Note that this approach resembles that of the partial agreement-within-intervals approach described above. In the example from Figure 3, there were 99.7, 2.3, 69.2, and 92.7% agreement levels for intervals 1 through 4, respectively. The average of these four levels of agreement results in a mean-duration-per-occurrence agreement score of 66%—a much more conservative estimate than that of the total duration IOA statistic.
Using the Calculator
Prerequisites
To use the calculator, we recommend Excel 2010 (see http://office.microsoft.com/en-us/excel/). System requirements for installing and using Excel 2010 include: (a) a processor of 500 MHz or higher, (b) at least 256 MB RAM, (c) 2 GB of available hard disk space, and (d) a monitor with 1,024 x 576 or higher resolution. For information on operating systems required for Excel 2010 or more detailed system requirements, see Microsoft's website (http://technet.microsoft.com/en-us/library/ee624351.aspx#section6).
To access the calculator, direct your Internet browser to Behavior Analysis in Practice's Supplemental Materials webpage (http://www.abainternational.org/Journals/bap_supplements.asp). Click on the calculator, and download to your preferred location.
Inputting Data
Each of the various IOA algorithms can be accessed by clicking on the respective tabs across the bottom of the calculator. Tabs are grouped by algorithm type, beginning with total count on the left and duration-based algorithms located on the far right. In each tab, the calculator is designed such that the primary observers' data should be entered into column B, with the second independent observers' data entered into column C. For both columns B and C, there are 500 rows for data entry. To enter data, simply click on the desired cell, and use the keyboard or number pad to enter the observed data (e.g., number of responses observed, duration observed). For interval-by-interval, scored-interval and unscored-interval, cells are arranged for either occurrence or non-occurrence data entry. To enter data into these cells, simply click on the desired cell to access a dropdown menu. From the dropdown menu, select either “Occurrence” or “Non-occurrence.” For instances in which an observation occurred but no target response was observed, the user should input a “0,” and not leave the cell blank; the zero values are crucial to the analyses. Specifically, the spreadsheet is designed to only compute IOA calculations if both cells in a row feature data (i.e., they are not blank). Thus, the spreadsheet will not calculate IOA if only one observers' data have been entered into a row. Finally, the user will note that we do not advise copying and pasting data from one spreadsheet to another, as doing so will impact the accuracy of the results and/or return an error message. As a general rule of thumb, users should only use the most relevant IOA statistic given the nuances of their data collection system and the attributes of the data set, thereby nullifying any need to copy and paste the data across spreadsheet tabs. For assistance in selecting an appropriate IOA statistic, the reader is encouraged to consult Vollmer et al. (2008) or Cooper et al. (2007).
Data Analysis
The primary advantage of the calculator is that data analysis is automated as data are entered. When no data or only one observer's data have been entered, the statistic will be displayed as “NA,” implying that the calculation is not applicable. However, as a second observer's data are entered, the value will automatically change as the algorithm computes the designated statistic. The user will notice that only the white cells in columns B and C are accessible (i.e., unlocked). We have locked the remaining cells in each worksheet to prevent accidental alteration of the algorithms and calculation steps used to perform the computations. Users interested in unlocking the spreadsheet may do so by clicking UNPROTECT SHEET on the REVIEW tab on the spreadsheet. For Apple computer users, sheets may be unprotected by clicking on TOOLS on the Excel toolbar, and selecting PROTECTION and clicking UNPROTECT SHEET. Cells containing the calculations are hidden, but may be unhidden once the sheet is unlocked.
Summary
This article provides instructions for and access to a Microsoft Excel calculator to compute IOA statistics for both continuous and discontinuous data sets using standard algorithms recognized in the field of behavior analysis. Users are encouraged to save a blank template of this calculator to an appropriate location on their hard drive. As users begin to input data for various projects, they are encouraged to frequently save the calculator with the analyzed data in a different location with a file name specifying the project (e.g., “John Smith DRO Procedure IOA Data”) in an effort to prevent accidental data loss. Although this calculator has been field tested with older versions of Excel (specifically, 2003 and 2007), the user should note that versions of Excel older than 2003 may encounter unforeseen glitches—should such glitches occur, the user is encouraged to contact the corresponding author for workaround suggestions and techniques.
We are optimistic that the provision of this IOA calculator will encourage researchers and practitioners alike to explore different modes of IOA calculations. In addition, we hope this tool will promote the frequent and ongoing assessment of the reliability of academic and/or clinical behavior change.
Through the automation of such analyses, behavior analysts can be confident that their reliability data have been computed using algorithms identified as standards within the behavior analytic field. Notwithstanding these apparent benefits, we acknowledge that we have not empirically investigated our supposition that these procedures are indeed more efficient than hand calculations.1 Likewise, we have not formally assessed the preference of behavior analysts for this automated calculator over hand computations. Users should also be aware that there are inexpensive—and sometimes free—data collection software packages that perform IOA analyses automatically without the need of data transcription. Finally, we caution the user from relying upon this tool in lieu of fully understanding the rationale or algorithms behind these reliability calculations.
Appendix.
Mathematical Representation of Each IOA Algorithm
Footnotes
Derek D. Reed, Department of Applied Behavioral Science, University of Kansas; Richard L. Azulay, Canton Public Schools, Canton, MA.
Action Editor: John Borrero
1Note that this calculator was tested using the example IOA data presented in Chapter 5 (Improving and Assessing the Quality of Behavioral Measurement; pp. 102–124) of Cooper, Heron, and Heward (2007). For all algorithms, there was 100% agreement between the derived IOA values using the calculator described in this article with those reported in Cooper et al.
References
- Behavior Analyst Certification Board. BCBA® & BCaBA® Behavior Analyst Task List – Third edition. 2005, Fall. Retrieved from http://www.bacb.com/Downloadfiles/TaskList/207-3rdEd-TaskList.pdf.
- Brennan R. L. An essay on the history and future of reliability from the perspective of replications. Journal of Education Measurement. 2001;38:295–317. [Google Scholar]
- Carr J. E, Burkholder E. O. Creating single-subject design graphs with Microsoft Excel. Journal of Applied Behavior Analysis. 1998;31:245–251. doi: 10.1901/jaba.2009.42-277. [DOI] [PMC free article] [PubMed] [Google Scholar]
- Christensen A. R, Stephens L. J. Microsoft Excel as a supplement in a high school statistics course. International Journal of Mathematical Education in Science and Technology. 2003;36:881–885. [Google Scholar]
- Cooper J. O, Heron T. E, Heward W. L. Improving and assessing the quality of behavioral measurement. In: Cooper J. O, Heron T. E, Heward W. L, editors. Applied behavior analysis. 2nd ed. Upper Saddle River, NJ: Prentice Hall; 2007. pp. 102–124. [Google Scholar]
- Dixon M. R, Jackson J. W, Small S. L, Horner-King M. J, Lik N. M. K, Garcia Y, Rosales R. Creating single-subject design graphs in Microsoft Excel 2007. Journal of Applied Behavior Analysis. 2009;42:277–293. doi: 10.1901/jaba.2009.42-277. [DOI] [PMC free article] [PubMed] [Google Scholar]
- Friman P. C. Behavior assessment. In: Barlow D. H, Nock M. K, Hersen M, editors. Single case experimental designs: Strategies for studying behavior change. 3rd ed. Boston, MA: Pearson; 2009. pp. 99–134. [Google Scholar]
- Kelly M. B. A review of the observational data-collection and reliability procedures reported in the Journal of Applied Behavior Analysis. Journal of Applied Behavior Analysis. 1977;10:97–101. doi: 10.1901/jaba.1977.10-97. [DOI] [PMC free article] [PubMed] [Google Scholar]
- Mudford O. C, Taylor S. A, Martin N. T. Continuous recording and interobserver agreement algorithms reported in the Journal of Applied Behavior Analysis (1995–2005) Journal of Applied Behavior Analysis. 2009;42:165–169. doi: 10.1901/jaba.2009.42-165. [DOI] [PMC free article] [PubMed] [Google Scholar]
- Neurath R. A, Stephens L. J. The effect of using Microsoft Excel in a high school algebra class. International Journal of Mathematical Education in Science and Technology. 2006;37:721–756. [Google Scholar]
- Powell S. G, Baker K. R, Lawson B. A critical review of the literature on spreadsheet errors. Decision Support Systems. 2008;46:128–138. [Google Scholar]
- Stephens L. J. Microsoft Excel as a supplement to intermediate algebra. International Journal of Mathematical Education in Science and Technology. 2003;34:575–579. [Google Scholar]
- Vollmer T. R, Sloman K. N, St. Peter Pipkin C. Practical implications of data reliability and treatment integrity monitoring. Behavior Analysis in Practice. 2008;1:4–11. doi: 10.1007/BF03391722. [DOI] [PMC free article] [PubMed] [Google Scholar]
- Warner C. B, Meehan A. M. Microsoft Excel as a tool for teaching basic statistics. Teaching of Psychology. 2001;28:295–298. [Google Scholar]


