Abstract
OBJECTIVES
Our goal was to prospectively compare the accuracy of real-time three-dimensional (3D) color Doppler vena contracta (VC) area and two-dimensional (2D) VC diameter in an in vitro model and in the clinical assessment of mitral regurgitation (MR) severity.
BACKGROUND
Real-time 3D color Doppler allows direct measurement of VC area and may be more accurate for assessment of MR than the conventional VC diameter measurement by 2D color Doppler.
METHODS
Using a circulatory loop with an incorporated imaging chamber, various pulsatile flow rates of MR were driven through 4 differently sized orifices. In a clinical study of patients with at least mild MR, regurgitation severity was assessed quantitatively using Doppler-derived effective regurgitant orifice area (EROA), and semiquantitatively as recommended by the American Society of Echocardiography. We describe a step-by-step process to accurately identify the 3D-VC area and compare that measure against known orifice areas (in vitro study) and EROA (clinical study).
RESULTS
In vitro, 3D-VC area demonstrated the strongest correlation with known orifice area (r = 0.92, p < 0.001), whereas 2D-VC diameter had a weak correlation with orifice area (r = 0.56, p = 0.01). In a clinical study of 61 patients, 3D-VC area correlated with Doppler-derived EROA (r = 0.85, p < 0.001); the relation was stronger than for 2D-VC diameter (r = 0.67, p < 0.001). The advantage of 3D-VC area over 2D-VC diameter was more pronounced in eccentric jets (r = 0.87, p < 0.001 vs. r = 0.6, p < 0.001, respectively) and in moderate-to-severe or severe MR (r = 0.80, p < 0.001 vs. r = 0.18, p = 0.4, respectively).
CONCLUSIONS
Measurement of VC area is feasible with real-time 3D color Doppler and provides a simple parameter that accurately reflects MR severity, particularly in eccentric and clinically significant MR where geometric assumptions may be challenging.
Keywords: mitral valve, regurgitation, color Doppler, 3D echocardiography, vena contracta
In valvular regurgitation, the initial size of a jet as it emerges from the regurgitant orifice (vena contracta [VC]) increases directly with the size of the regurgitant orifice (1,2) and is relatively independent of driving pressure and flow rate (3,4). Although VC diameter has been used as an index of severity of mitral regurgitation (MR), it has several limitations, mostly arising from the different shapes and geometry of the regurgitant orifice observed with various pathologies of the mitral valve.
Real-time three-dimensional (3D) color Doppler (CD) imaging currently allows visualization of a regurgitant jet from any plane. Thus, the VC cross-sectional area may be readily identified. This single measure—not dependent on an assumption of regular shape—may be a more accurate estimate of effective regurgitant orifice area (EROA). In this study, we sought to compare the validity of assessing MR severity with two-dimensional (2D)-VC diameter and 3D-VC area in a pulsatile model of MR using regurgitant flow orifices of defined shape and area. In a clinical study of patients with at least mild MR, we also compared 2D-VC diameter and 3D-VC area against quantitative Doppler estimates of EROA.
METHODS
In vitro model
We used a pulsatile circulatory loop developed in our laboratory and previously described in detail (5,6). In brief, pulsatile flow was driven into a regurgitant loop incorporating an imaging chamber partitioned by a divider plate containing a geometric orifice. The orifices tested to assess VC were of various shapes and increasing size to closely model clinical MR. In all, we assessed 8 different pulsatile regurgitant volumes at 60 beats/ min through each of 4 rigid orifices differing in size and shape as a 0.15-cm2 circle, 0.39-cm2 circle, 0.35-cm2 slot, and 0.4-cm2 arc. Regurgitant volumes ranged between 10 to 80 ml/beat.
A 2D color Doppler transducer (2 to 4 MHz, Sonos 7500, Philips Medical Systems, Bothell, Washington) and hand-held 3D-CD transducer (X4, Philips Medical Systems) were used to assess trans-orifice flow from an apical-equivalent (AP) view parallel to regurgitant flow and from a parasternal-equivalent (PS) view perpendicular to flow. Two-dimensional and 3D color Doppler signals were optimized to distinguish the VC zone from the proximal flow convergence zone and a rapidly expanding jet. Images were acquired using the zoom mode. Using an average of 3 samples, measurements of VC diameter were performed offline (Digisonics, Houston, Texas) while blinded to flow measurements and regurgitant orifice characteristics.
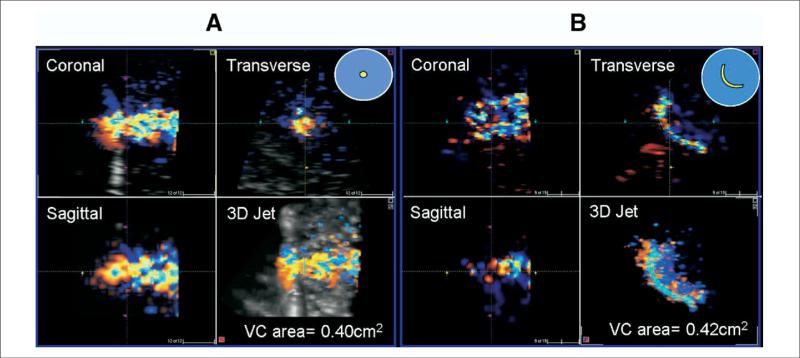
Using a custom software program (TomTec, Unterschleissheim, Germany), the VC area was identified by rotation of the 3D dataset to bisect the long axis of the regurgitant color jet in 2 orthogonal planes. The VC area was defined as the smallest cross-sectional area of the regurgitant jet, distal to the regurgitant orifice. An average of 3 measurements was obtained from the frame with the largest identified VC area (Fig. 1). VC area measurements were performed blinded to all other data.
Figure 1. 3D Reconstruction and Measurement of VC Area Through Circular and Arc-Shaped Rigid Orifices.
Panels A (circular orifice) and B (arc-shaped orifice) depict the long axis of flow in the sagittal and coronal view, with vena contracta (VC) short-axis area shown in the transverse view, and three-dimensional (3D) jet in the lower right panels. For each orifice shape used in the in vitro model, the transverse view demonstrates that the shape of the VC area is defined by the shape of orifice.
Clinical study
Patients referred for transthoracic echocardiography that demonstrated at least mild MR were approached for study participation. Patients were excluded for atrial fibrillation or more than mild aortic regurgitation. The research protocol was approved by the institutional review board, and all participants provided written consent. Participants underwent a 3D-CD study of mitral valve function immediately after a complete 2D and Doppler echocardiogram. The EROA was quantitated from pulsed Doppler as: (EROA = [mitral stroke volume – aortic stroke volume]/MR time velocity integral) (7,8). MR severity was also semi-quantitated using the integrative approach recommended by the American Society of Echocardiography (9) as mild (grade 1), mild to moderate (grade 2), moderate to severe (grade 3), and severe (grade 4).
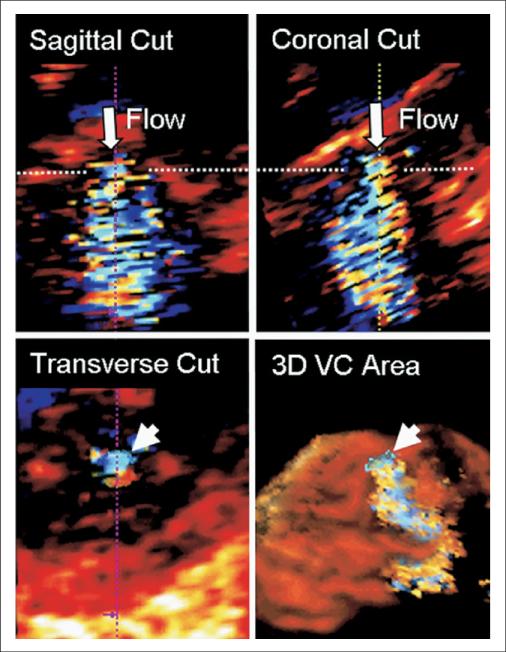
From the 2D echocardiogram, all MR jets were categorized as either eccentric or central. Valve pathology was assessed by consensus of 2 experienced echocardiographers and classified as functional, prolapse, or other. With a breath hold in expiration, 3D Doppler was acquired with 7 electrocardiogram-triggered sequential volumes creating a full volume scan of 60° × 60°, from both the PS and AP imaging windows. Three-dimensional-VC area was assessed as described in the preceding text for the in vitro study (Fig. 2). 2D-VC diameter was assessed from the PS view. To evaluate the impact of regurgitant orifice shape, a sphericity index was derived from the 3D-VC in short axis as the largest VC diameter was divided by the smallest VC diameter.
Figure 2. Measurement of VC Area in Patients.
Step 1: rotation and cropping of the 3D dataset to bisect the long axis of regurgitant flow in 2 orthogonal planes (sagittal and coronal orientation). This important step ensured that the subsequent VC area determination would be a true short-axis measurement. Step 2: identification of the frame with the largest VC zone (defined as the smallest cross-sectional area of the regurgitant jet, distal to the regurgitant orifice). Step 3: the color border of the VC short-axis area was manually traced as depicted in the transverse image. Measured VC area (arrowhead) is shown in relation to expanding 3D regurgitant jet. The Online Video shows rotation of the 3D jet and VC area. Abbreviations as in Figure 1.
Observer variability
The effect of interobserver variability was assessed by random selection of 10 in vitro and 10 clinical assessments for VC area measurement by a second blinded observer. Agreement was expressed as a correlation, absolute mean difference ± SD and percent mean difference ± SD between the measurements.
Statistics
Hemodynamic characteristics and summary echocardiographic data were summarized as mean ± SD (range). Pearson correlation coefficient was used to assess the relation between 2D-VC diameter and 3D-VC area with known regurgitant orifice area (in vitro model, 2D-VC diameter and 3D-VC area were log-transformed for homogeneous variances among 4 orifice sizes) and Doppler-derived EROA (clinical study). The Steiger's Z-test for “correlated correlations” within a population was used to test the correlation coefficient difference. Simple linear regression models were used to assess the relationship of 2D-VC diameter and 3D-VC area with EROA. Paired Student t test or Mann-Whitney rank-sum test was used to test for differences between 3D-VC area measures from the PS window and the AP window (version 3.0.1, Sigma-Stat, San Jose, California). A p value <0.05 was considered statistically significant.
RESULTS
In vitro
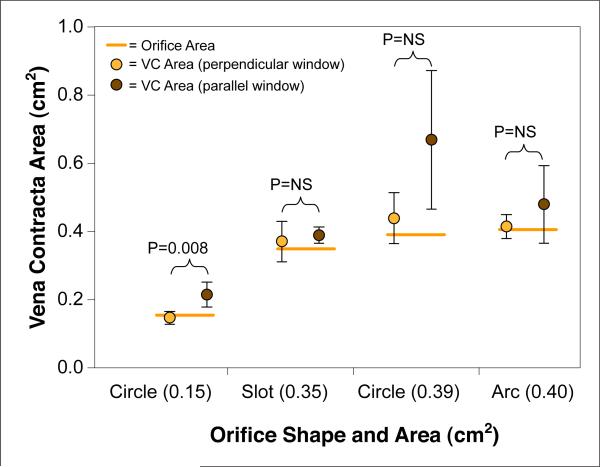
The circulatory loop created consistent pulsatile trans-orifice flow rates within the clinical range of MR (11 to 84 ml/beat). 2D-CD frame rate ranged from 11 to 18 Hz depending on depth and sector angle width, while 3D color Doppler frame rate ranged between 12 and 17 Hz. 3D VC-PS area demonstrated the strongest correlation with orifice area (r = 0.92, p < 0.001), followed by 3D VC-AP area (r = 0.72, p < 0.001). The correlation coefficients are significantly different (p < 0.001). Overall determination of VC area by 3D tracked well the geometric orifice area, irrespective of shape, but was better from the “parasternal” window equivalent (p < 0.05) (Fig. 3). In contrast, 2D-VC diameter demonstrated a weak correlation with known orifice area (r = 0.56, p = 0.01). The correlation between orifice area and 3D VC-PS area was stronger than the correlation with 2D-VC diameter (p for correlation coefficient difference <0.001). As expected for a fixed orifice, there was no significant correlation between VC area and flow rate (p = NS).
Figure 3. Relationship Between True Orifice Area and VC Area.
Vena contracta (VC) area assessed from an imaging window either parallel (apical equivalent) or perpendicular (parasternal equivalent) to the long axis of flow in the in vitro model. For individual orifice shapes, the VC area measurements were different (p < 0.05) for only the smallest circle orifice. This statistical difference is likely related to the small variance of those small area measurements. Combining all orifice shapes, VC area assessed from the image window perpendicular to flow was more accurate and statistically different (p < 0.05) from the VC area assessed from the parallel imaging window. Orange bar indicates the actual area for each orifice.
Patient population
Sixty-five patients were evaluated of whom 61 (65 ± 15 years, 27 women) had adequate studies for MR quantitation. Hemodynamic characteristics and echocardiographic measurements are shown in Table 1. Mitral valve pathology was functional in 44%, leaflet prolapse with or without flail in 35%, or other etiology in 21%. MR severity was grade 1 in 25%, grade 2 in 36%, grade 3 in 14%, and grade 4 in 25% of patients. Quantitative parameters of MR severity are shown in Table 1. Two-dimensional CD was acquired at a frame rate of 16 Hz (range 14 to 17 Hz) at scan depth 15 cm (range 10 to 18 cm) for the PS window, and 17 Hz (range 13 to 22 Hz) at scan depth 16 cm (range 12 to 22 cm) for the AP window. Three-dimensional CD mean frame rate and scan depth were not different for the AP and PS image windows (13 ± 1 Hz, mean scan depth 15 cm). After training and 3 to 5 practice studies, the average time to measure the VC area by 3D-CD was 3.9 ± 1.5 min.
Table 1.
Hemodynamic Characteristics and Summary Echocardiographic Data in 61 Patients With MR
| Parameter | Mean ± SD (Range) |
|---|---|
| Age (yrs) | 66 ± 15 (23–105) |
| Hemodynamics | |
| Systolic BP (mm Hg) | 129 ± 20 (90–189) |
| Diastolic BP (mm Hg) | 73 ± 13 (49–115) |
| Heart rate (beats/min) | 76 ± 15 (51–110) |
| 2D/Doppler echocardiography | |
| LV end-diastolic volume (ml) | 174 ± 66 (69–340) |
| Ejection fraction (%) | 47 ± 18 (12–90) |
| Regurgitant volume (ml) | 37 ± 27 (1–109) |
| Regurgitant fraction (%) | 39 ± 17 (6–72) |
| VC diameter, parasternal (cm) | 0.6 ± 0.2 (0.2–1.1) |
| EROA (cm2) | 0.29 ± 0.24 (0.04–1.1) |
| 3D/Doppler echocardiography | |
| VC area, parasternal (cm2) | 0.29 ± 0.18 (0.05–0.79) |
| VC area, apical (cm2) | 0.32 ± 0.17 (0.10–0.93) |
| Measurement time (min) | 3.9 ± 1.5 (2–13) |
BP = blood pressure; EROA = effective regurgitant orifice area; LV = left ventricular; MR = mitral regurgitation; VC = vena contracta; 2D = two-dimensional; 3D = three-dimensional.
Relation of 3D-VC area and 2D-VC diameter to regurgitant orifice area
3D-VC area in the patient population was 0.29 ± 0.24 cm2 from the PS window and 0.32 ± 0.17 cm2 from the AP window (p = NS). There was good correlation between 3D-VC area derived from the 2 imaging windows (r = 0.88, p < 0.001), without over- or underestimation bias. For the remainder of this study, we report comparisons based on 3D-VC area assessed from the PS window.
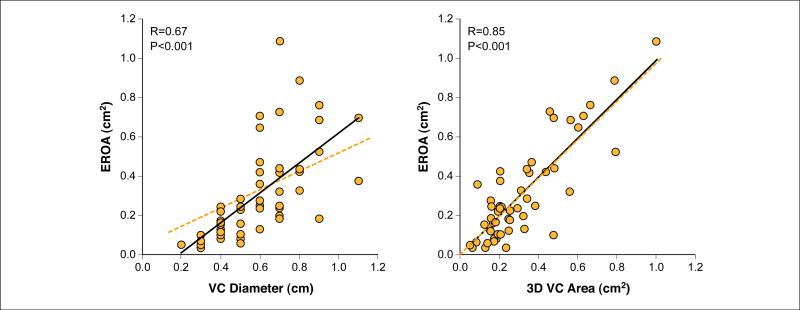
3D-VC area and 2D-VC diameter correlated significantly with EROA (derived by volumetric Doppler method) (r = 0.85, p < 0.001; r = 0.67, p < 0.001, respectively), but the correlation was stronger for 3D-VC area than that for 2D-VC diameter (p for correlation coefficient difference = 0.01) (Fig. 4). The relation between 2D-VC diameter and EROA was moderate, with increased scatter of measures in the range of clinically significant MR (9). Using a nonlinear correlation model, the relation between VC diameter and EROA did not improve (R2 = 0.45 vs. R2 = 0.46 for linear and nonlinear models, respectively). In contrast, the stronger relation observed between 3D-derived VC area and EROA had a linear regression equation close the line of identity (Fig. 4).
Figure 4. Relationship Between EROA and 3D-VC Area and 2D-VC Diameter.
Relation between effective regurgitant orifice area (EROA) derived by the volumetric Doppler method and two-dimensional (2D)-VC diameter (left) and 3D-VC area (right). For the comparison of EROA and 2D-VC diameter, the dotted orange line depicts the projected correlation (based on current American Society of Echocardiography guidelines for the quantification of regurgitation severity). Using a nonlinear correlation model, the relation between VC diameter and EROA did not improve (R2 = 0.45 linear model vs. R2 = 0.46 nonlinear model). In contrast, the stronger relation observed between 3D-VC area and EROA had a linear regression equation close the line of identity (also shown as a dotted orange line). Abbreviations as in Figure 1.
Effect of MR jet direction and severity on accuracy of VC measurements
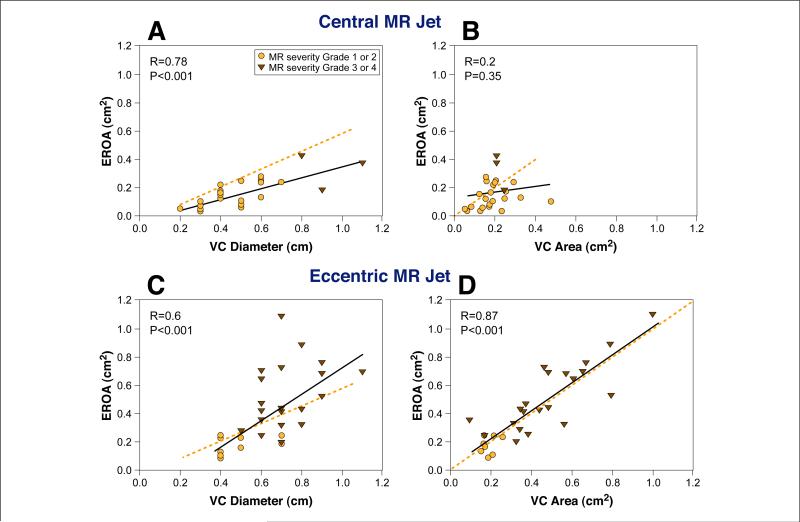
The regurgitant MR jet was central in 51% and eccentric in 49%. Of patients with a central jet, functional MR was the most common etiology (63%) and was mostly mild (MR grade 1 or 2 in 90%). MR severity was more variable in patients with eccentric MR (MR grade 1 or 2 in 32%). Figure 5 shows the relation of 2D-VC diameter and 3D-VC area to EROA based on regurgitant jet direction. In patients with central MR, the 2D method demonstrated a good relation to EROA (r = 0.78, p < 0.001) but consistent overestimation, whereas the 3D method demonstrated a poor relation to EROA (r = 0.2, p = 0.35), without consistent over- or underestimation; the above relation involving a narrow range of MR severity (mild degrees). The p value for the correlation coefficient difference is <0.01. In patients with eccentric jets, both 3D-VC area and 2D-VC diameter demonstrated good correlations with Doppler-derived EROA (r = 0.87, p < 0.001; r = 0.61, p < 0.001, respectively); however, that of 3D-VC area was stronger (p for correlation coefficient difference <0.01) (Fig. 5).
Figure 5. Relationship Between EROA and 2D-VC Area and 3D-VC Area in Central and Eccentric MR Jets.
Upper panels depict the relation of VC diameter (A) and VC area (B) to effective regurgitant orifice area (EROA) for patients with a central mitral regurgitation (MR) jet. Lower panels depict the relation of VC diameter (C) and VC area (D) to EROA for patients with an eccentric MR jet. Dotted orange lines as in Figure 4. The relation between EROA and two-dimensional (2D)-VC area was best for central MR (A). In contrast, the relation between EROA and 3D-VC area was best for eccentric MR (D).
The accuracy of 2D and 3D-VC measurements in relation to the severity of MR is shown in Figure 6. In patients with MR grades 1 and 2, the relation of 2D-VC to EROA was stronger than for 3D-VC (r = 0.68 vs. r = 0.2; p for correlation coefficient difference = 0.02). In patients with significant MR (grades 3 and 4), the 2D-VC method had a poor relation to EROA whereas the 3D-VC method demonstrated a strong correlation to EROA (r = 0.18 vs. r = 0.80, p for correlation coefficient difference <0.01, for the 2D and 3D method, respectively) (Fig. 6).
Figure 6. MR Severity Affects 2D and 3D Method Accuracy.
Upper panels depict the relation of 2D-VC diameter to EROA (A) and 3D-VC area to EROA (B) for MR severity grades 1 and 2. Lower panels depict the same relation in patients with MR severity grades 3 or 4. Dotted orange lines as in Figure 4. The relation between EROA and 2D-VC area was best for mild and mild-to-moderate MR (A). In contrast, the relation between EROA and 3D-VC area was best for moderate-to-severe and severe MR (D). Abbreviations as in Figures 1 and 5.
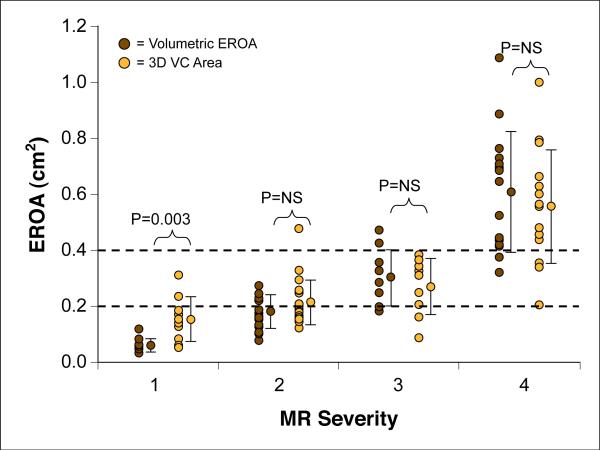
Comparison of 3D-VC area and Doppler-derived volumetric EROA in differentiating various grades of MR severity according to integrative American Society of Echocardiography criteria is shown in Figure 7. 3D-VC values were similar to those derived by volumetric EROA, with the exception of mild MR (in which quantitation is usually not needed [9]), and differentiated well among grades of more significant MR, similar to EROA derivation.
Figure 7. Comparison of EROA and 3D-VC Area for Differentiation of MR Severity Grade.
MR severity (grades 1 to 4) as defined by a comprehensive evaluation of qualitative and quantitative echocardiographic parameters as recommended by the American Society of Echocardiography. Note the effective differentiation of grades 2, 3, or 4 MR by either Doppler-derived EROA or VC area measurement. Dotted orange lines depict the threshold EROA values recommended by the American Society of Echocardiography to define mild (EROA <0.2 cm2) and severe (EROA ≥0.4 cm2) MR. Abbreviations as in Figures 1 and 5.
VC sphericity and its effect on accuracy of VC measurements
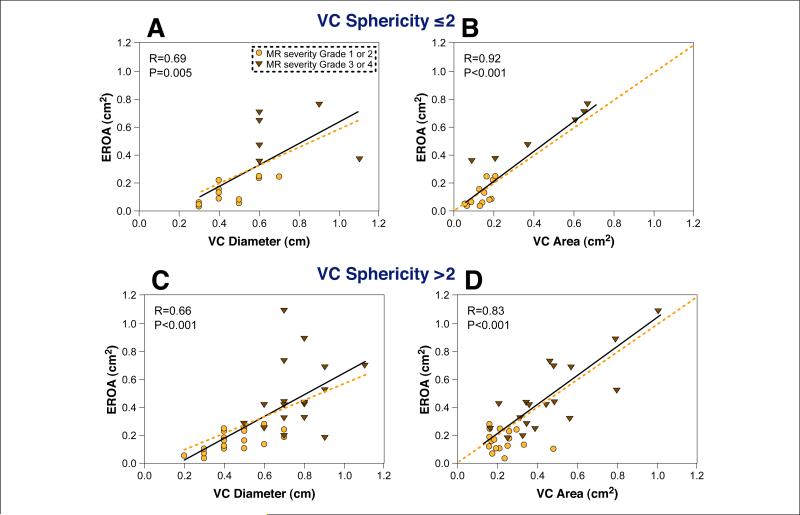
Only 7 of 61 patients had a circular VC area (sphericity index = 1). There was no difference in sphericity index among various MR etiologies (3.01 for mitral prolapse, 3.06 for functional MR, 3.3 for other etiologies). Furthermore, there was no significant correlation between severity of MR assessed by volumetric EROA and the sphericity index. Figure 8 depicts the effect of VC sphericity on the accuracy of 2D and 3D estimates of MR severity. In patients with a sphericity index <2 (n = 15), the relation of VC diameter to EROA was modest (r = 0.69, p < 0.01) and was better for 3D-VC area (r = 0.92, p < 0.001) (p for correlation coefficient difference = 0.04). For patients with sphericity index ≥2 (n = 45), the 2D-VC relation to EROA was only modest (r = 0.66, p < 0.001) and increased significantly with 3D-VC area (r = 0.83, p < 0.001) (p for correlation coefficient difference = 0.04) (Fig. 8).
Figure 8. VC Sphericity Affects 2D and 3D Method Accuracy.
To evaluate the impact of regurgitant orifice shape, a VC sphericity index was derived from a single 3D-VC area measure by dividing the largest VC diameter by the smallest VC diameter. Upper panels depict the relation of 2D-VC diameter to EROA (A) and 3D-VC area to EROA (B) for sphericity index ≤2 (circular or elliptical VC shape); lower panels depict the same relations for a sphericity index >2 (irregular VC shape). Dotted orange lines as in Figure 4. Abbreviations as in Figures 1 and 5.
Observer variability
Interobserver agreement of VC area for the in vitro model was good: mean absolute difference of 0.03 ± 0.02 cm2, mean percent difference 11 ± 12%, and a correlation coefficient of r = 0.94 (p < 0.001). In patients, the interobserver agreement for VC area measurement was good: mean absolute difference of 0.05 ± 0.02 cm2, mean percent difference 16 ± 8%, and a correlation coefficient of r = 0.96 (p < 0.001).
DISCUSSION
In this study, we assessed the validity of 3D-CD echocardiography to directly measure the area of the VC as an index of MR severity. The main findings are that: 1) in a pulsatile model of MR, 3D-VC area correlates well with known orifice area regardless of orifice size and shape, and better than 2D-VC diameter; and 2) in the clinical setting, 3D-VC area measurement is feasible and relatively quick to perform, and demonstrates a better relation to Doppler-derived EROA than the classic 2D-VC diameter in patients with clinically significant MR, including the challenging subgroup with eccentric regurgitation.
VC area as a parameter of MR severity
Previous studies have demonstrated that the size of the regurgitant jet, as it emerges from the orifice, bears a consistent relation to the size of the orifice itself (10–12). However, the regurgitant mitral orifice is often irregularly shaped, therefore making it difficult to estimate its area accurately using 1 or 2 diameter measurements. In our in vitro study, we demonstrate that the orifice shape directly affects the shape of the proximal regurgitant jet. As shown in Figure 1, the shape of the 3D-VC area clearly reflects the shape of the rigid orifice. As such, the relation between a single VC diameter and actual regurgitant severity is poor when the regurgitant orifice shape is highly irregular. This limitation is important since the regurgitant orifice is commonly asymmetric (89% of cases) as shown in this clinical study. In support of this observation, the 3D-VC area demonstrated a better relation to EROA than 2D-VC diameter over a wide range of sphericity index.
Previous studies have reported the use of technically difficult and time intensive 3D reconstruction technology to assess 3D-VC area (10,13). More recent clinical studies have employed real-time 3D-CD to characterize the VC area using biplane diameter dimensions and a geometric shape assumption (14) or compared directly measured 3D-VC short-axis area against 2D Doppler jet area (15) or a semiquantitative angiographic severity grade (16). To our knowledge, the present study is the first reported method to directly measure the cross-sectional area of the VC from a hand-held 3D-CD dataset and to describe both the in vitro validation and clinical experience with this novel technique.
An advantage of 3D-VC area as an index of MR severity is its accuracy in clinically significant MR and in the challenging situation of eccentric MR jets. 3D-VC area measurement requires identification of the long axis of flow in 2 orthogonal images, then identification of VC cross-sectional area. Hall et al. (2) had demonstrated that 2 orthogonal long-axis planes are needed to accurately define the actual VC region. Although 2D and 3D Doppler imaging windows are similar, the 3D-CD dataset can be analyzed in any plane to facilitate accurate identification of the true long and short axis of flow.
Factors affecting accuracy of 3D-VC area measurement
From our in vitro study, it is clear that VC area measured from the “parasternal” imaging window provided a more accurate estimate of actual office area compared with that measured from an “apical” window, parallel to flow. Since 3D-CD sector size was fixed, and frame rate was similar, the observed difference in VC area measurement is likely related to the fact that the “parasternal” imaging window provided superior axial resolution of the ultrasound beam, whereas the AP window, parallel to flow, was more dependent upon the lesser lateral resolution of ultrasound, resulting in a small overestimation of VC area. In the clinical study, there was no significant difference between measurements from either window. This finding is likely related to the large proportion of patients with eccentric jets (49%) with an intermediate axis of flow. In short, both imaging windows may have been equally disadvantaged in their attempt to optimize the principle of best axial resolution in roughly one-half of our patients.
For the patients with central mild MR, there was a poor relation between 3D-VC area and EROA, in contrast to 2D-VC diameter measurement. This may be partly attributed to clustering of data over a narrow range of severity (in this case, mild MR). Furthermore, accurate 3D-VC area measurements of these small, central jets may have been hampered by technical limitations, including image pixilation. Although mild MR is readily assessed and does not need quantitation in the clinical setting, enhanced software and 3D image resolution would improve the quantitation of mild MR in the future. Nevertheless, in eccentric and clinically significant MR in which quantitation is needed and assumptions about jet direction and orifice geometry may be challenging, the 3D-VC area accurately reflects MR severity, better than the simple measurement of VC diameter, and is similar to the derivation of EROA by volumetric Doppler.
Study limitations
For the clinical study, we chose the Doppler-derived EROA as the independent reference standard as this method has been well validated by our group and others (2,8,11,17). EROA represents the mean orifice area over the systolic period whereas 3D-VC area and 2D-VC diameter are instantaneous measurements. In patients with functional MR or mitral prolapse, which is associated with biphasic regurgitant flow pattern and late systolic regurgitation, respectively (18,19), this fundamental distinction in event timing may be important, and probably accounts for some of the discrepancy noted between measurements. In addi tion, we acknowledge that lower 3D-CD frame rate may be a significant limitation in the assessment of rapidly dynamic flow events. Other technical limitations such as image quantitation during playback, pixilation, and processing time are likely to improve with computing and software advances.
CONCLUSIONS
Measurement of VC area is feasible with real-time 3D and provides a simple parameter that accurately reflects MR severity, particularly in eccentric and clinically significant MR in which geometric assumptions may be challenging.
Supplementary Material
Acknowledgments
The authors are grateful to Dr. Y. Nose for his support of the in vitro model development, and Mrs. Samantha Mason for her expert help in preparation of the manuscript.
ABBREVIATIONS AND ACRONYMS
- 2D
two-dimensional
- 3D
three-dimensional
- AP
apical (or apical equivalent)
- CD
color Doppler
- EROA
effective regurgitant orifice area
- MR
mitral regurgitation
- PS
parasternal (or parasternal equivalent)
- VC
vena contracta
Footnotes
Presented, in part, at the annual Scientific Sessions of the American Society of Echocardiography, Baltimore, Maryland, June, 2006, and the American Heart Association, Orlando, Florida, November, 2007.
REFERENCES
- 1.Fehske W, Omran H, Manz M, Kohler J, Hagendorff A, Luderitz B. Color-coded Doppler imaging of the vena contracta as a basis for quantification of pure mitral regurgitation. Am J Cardiol. 1994;73:268–74. doi: 10.1016/0002-9149(94)90232-1. [DOI] [PubMed] [Google Scholar]
- 2.Hall SA, Brickner ME, Willett DL, Irani WN, Afridi I, Grayburn PA. Assessment of mitral regurgitation severity by Doppler color flow mapping of the vena contracta. Circulation. 1997;95:636–42. doi: 10.1161/01.cir.95.3.636. [DOI] [PubMed] [Google Scholar]
- 3.Baumgartner H, Schima H, Kuhn P. Value and limitations of proximal jet dimensions for the quantitation of valvular regurgitation: an in vitro study using Doppler flow imaging. J Am Soc Echocardiogr. 1991;4:57–66. doi: 10.1016/s0894-7317(14)80161-2. [DOI] [PubMed] [Google Scholar]
- 4.Mele D, Vandervoort P, Palacios I, et al. Proximal jet size by Doppler color flow mapping predicts severity of mitral regurgitation. Clinical studies. Circulation. 1995;91:746–54. doi: 10.1161/01.cir.91.3.746. [DOI] [PubMed] [Google Scholar]
- 5.Little SH, Igo SR, Pirat B, et al. In vitro validation of real-time three-dimensional color Doppler echocardiography for direct measurement of proximal isovelocity surface area in mitral regurgitation. Am J Cardiol. 2007;99:1440–7. doi: 10.1016/j.amjcard.2006.12.079. [DOI] [PMC free article] [PubMed] [Google Scholar]
- 6.Little SH, Igo SR, McCulloch M, Hartley CJ, Nose Y, Zoghbi WA. Three-dimensional ultrasound imaging model of mitral valve regurgitation: design and evaluation. Ultrasound Med Biol. 2008;34:647–54. doi: 10.1016/j.ultrasmedbio.2007.08.009. [DOI] [PMC free article] [PubMed] [Google Scholar]
- 7.Enriquez-Sarano M, Seward JB, Bailey KR, Tajik AJ. Effective regurgitant orifice area: a noninvasive Doppler development of an old hemodynamic concept. J Am Coll Cardiol. 1994;23:443–51. doi: 10.1016/0735-1097(94)90432-4. [DOI] [PubMed] [Google Scholar]
- 8.Quinones MA, Otto CM, Stoddard M, Waggoner A, Zoghbi WA. Recommendations for quantification of Doppler echocardiography: a report from the Doppler Quantification Task Force of the Nomenclature and Standards Committee of the American Society of Echocardiography. J Am Soc Echocardiogr. 2002;15:167–84. doi: 10.1067/mje.2002.120202. [DOI] [PubMed] [Google Scholar]
- 9.Zoghbi WA, Enriquez-Sarano M, Foster E, et al. Recommendations for evaluation of the severity of native valvular regurgitation with two-dimensional and Doppler echocardiography. J Am Soc Echocardiogr. 2003;16:777–802. doi: 10.1016/S0894-7317(03)00335-3. [DOI] [PubMed] [Google Scholar]
- 10.Guo Z, Boughner DR, Dietrich JM, et al. Quantitative assessment of in vitro jets based on three-dimensional color Doppler reconstruction. Ultrasound Med Biol. 2001;27:235–43. doi: 10.1016/s0301-5629(00)00337-9. [DOI] [PubMed] [Google Scholar]
- 11.Lesniak-Sobelga A, Olszowska M, Pienazek P, Podolec P, Tracz W. Vena contracta width as a simple method of assessing mitral valve regurgitation. Comparison with Doppler quantitative methods. J Heart Valve Dis. 2004;13:608–14. [PubMed] [Google Scholar]
- 12.Zhou X, Jones M, Shiota T, Yamada I, Teien D, Sahn DJ. Vena contracta imaged by Doppler color flow mapping predicts the severity of eccentric mitral regurgitation better than color jet area: a chronic animal study. J Am Coll Cardiol. 1997;30:1393–8. doi: 10.1016/s0735-1097(97)00304-5. [DOI] [PubMed] [Google Scholar]
- 13.Mori Y, Shiota T, Jones M, et al. Three-dimensional reconstruction of the color Doppler-imaged vena contracta for quantifying aortic regurgitation: studies in a chronic animal model. Circulation. 1999;99:1611–7. doi: 10.1161/01.cir.99.12.1611. [DOI] [PubMed] [Google Scholar]
- 14.Sugeng L, Weinert L, Lang RM. Real-time 3-dimensional color Doppler flow of mitral and tricuspid regurgitation: feasibility and initial quantitative comparison with 2-dimensional methods. J Am Soc Echocardiogr. 2007;20:1050–7. doi: 10.1016/j.echo.2007.01.032. [DOI] [PubMed] [Google Scholar]
- 15.Velayudhan DE, Brown TM, Nanda NC, et al. Quantification of tricuspid regurgitation by live three-dimensional transthoracic echocardiographic measurements of vena contracta area. Echocardiography. 2006;23:793–800. doi: 10.1111/j.1540-8175.2006.00314.x. [DOI] [PubMed] [Google Scholar]
- 16.Khanna D, Vengala S, Miller AP, et al. Quantification of mitral regurgitation by live three-dimensional transthoracic echocardiographic measurements of vena contracta area. Echocardiography. 2004;21:737–43. doi: 10.1111/j.0742-2822.2004.40027.x. [DOI] [PubMed] [Google Scholar]
- 17.Enriquez-Sarano M, Bailey KR, Seward JB, Tajik AJ, Krohn MJ, Mays JM. Quantitative Doppler assessment of valvular regurgitation. Circulation. 1993;87:841–8. doi: 10.1161/01.cir.87.3.841. [DOI] [PubMed] [Google Scholar]
- 18.Levine RA, Schwammenthal E. Ischemic mitral regurgitation on the threshold of a solution: from paradoxes to unifying concepts. Circulation. 2005;112:745–58. doi: 10.1161/CIRCULATIONAHA.104.486720. [DOI] [PubMed] [Google Scholar]
- 19.Rosario LB, Stevenson LW, Solomon SD, Lee RT, Reimold SC. The mechanism of decrease in dynamic mitral regurgitation during heart failure treatment: importance of reduction in the regurgitant orifice size. J Am Coll Cardiol. 1998;32:1819–24. doi: 10.1016/s0735-1097(98)00461-6. [DOI] [PubMed] [Google Scholar]
Associated Data
This section collects any data citations, data availability statements, or supplementary materials included in this article.


