

Abstract
OBJECTIVE
To examine demographic, socioeconomic, and biological risk factors for all-cause, cardiovascular, and noncardiovascular mortality in patients with type 2 diabetes over 8 years and to construct mortality prediction equations.
RESEARCH DESIGN AND METHODS
Beginning in 2000, survey and medical record information was obtained from 8,334 participants in Translating Research Into Action for Diabetes (TRIAD), a multicenter prospective observational study of diabetes care in managed care. The National Death Index was searched annually to obtain data on deaths over an 8-year follow-up period (2000–2007). Predictors examined included age, sex, race, education, income, smoking, age at diagnosis of diabetes, duration and treatment of diabetes, BMI, complications, comorbidities, and medication use.
RESULTS
There were 1,616 (19%) deaths over the 8-year period. In the most parsimonious equation, the predictors of all-cause mortality included older age, male sex, white race, lower income, smoking, insulin treatment, nephropathy, history of dyslipidemia, higher LDL cholesterol, angina/myocardial infarction/other coronary disease/coronary angioplasty/bypass, congestive heart failure, aspirin, β-blocker, and diuretic use, and higher Charlson Index.
CONCLUSIONS
Risk of death can be predicted in people with type 2 diabetes using simple demographic, socioeconomic, and biological risk factors with fair reliability. Such prediction equations are essential for computer simulation models of diabetes progression and may, with further validation, be useful for patient management.
In 2007, diabetes was the seventh leading cause of death in the U.S. with >71,000 death certificates listing diabetes as the underlying cause of death (1,2). Diabetes is reported as the underlying cause of death on 10–15% of death certificates of decedents with diabetes and is reported anywhere on the death certificate for 40% of decedents with diabetes (3–5). Since a diagnosis of diabetes cannot be ascertained from death certificates, the best way to examine mortality in people with diabetes is to use a prospective observational cohort design and follow diabetic participants until death. Unfortunately, few such studies have been undertaken in nationally representative populations of people with diabetes. Although many investigators have assessed risk factors for cardiovascular mortality, there are few published prediction models. Such models are needed to construct computer models to simulate the progression of diabetes, and may, with further validation, be useful for clinical decision making.
Translating Research Into Action for Diabetes (TRIAD), which began in 1999, was a prospective observational study of people with diabetes enrolled in managed care health plans in the U.S. The primary objective of TRIAD was to study how health plan, provider, and patient characteristics impact the processes and outcomes of diabetes care. TRIAD enrolled ∼12,000 diabetic patients from eight geographically distinct regions in the U.S. We previously reported on the demographic, socioeconomic, and biological risk factors for 4-year mortality in the TRIAD population (6). Since our study was published, two studies have reported prediction equations for mortality in patients with type 2 diabetes. One was performed in Chinese patients living in Hong Kong (7). The other was limited to patients initially prescribed a single oral hypoglycemic agent (8).
The objective of this study was to assess longer-term mortality in a large, diverse, U.S. population with type 2 diabetes and to create prediction equations for all-cause, cardiovascular, and noncardiovascular mortality among people with clinically diagnosed type 2 diabetes.
RESEARCH DESIGN AND METHODS
Study population
TRIAD has been described elsewhere (7). TRIAD studied a random sample of adults with diabetes enrolled in 10 health plans in eight states (Hawaii, California, Texas, Indiana, Michigan, New York, New Jersey, and Pennsylvania) that served ∼180,000 patients with diabetes. Patients were eligible to participate if they were at least 18 years old, lived in the community, were not pregnant, had diabetes for at least 1 year, spoke either English or Spanish, were continuously enrolled in the health plan for at least 18 months, used at least one service during that time, and could give informed consent. Institutional review boards at each participating site approved the study.
In 2000–2001, we administered a survey by computer-assisted telephone interview or in writing by mail. In addition, centrally trained reviewers used standardized data collection methods to abstract medical records. Each year, we obtained information on TRIAD decedents using National Death Index (NDI) Plus searches (8). Deaths were verified by matching name, date of birth, sex, and social security number of the decedent with data supplied by the NDI. The sensitivity of NDI has been shown to range from 87 to 98% (9). Different combinations of identifiers excluding social security number (available for ∼52% of participants) correctly identify 83–92% of decedents and 92–99% of living individuals, making NDI an accurate means of ascertaining vital status even without social security numbers (10).
Vital status was determined for all TRIAD participants (n = 11,927) through 31 December 2007. We included TRIAD participants who had both survey and medical record review data (n = 8,820) and excluded those with type 1 diabetes defined as age at diagnosis of diabetes <30 years and treatment with insulin only (n = 486), leaving a final study population of 8,334. We excluded from the stratified analyses one decedent who had “N/A” listed as the underlying cause of death. Values for variables from the patient survey that had <15% missing, including age, sex, race/ethnicity, education, income, duration of diabetes, BMI, and smoking were imputed using single imputation with the transcan function in S-PLUS (edition 6.1; Insightful, Seattle, WA).
Outcome measure and covariates
We used the underlying cause of death ICD-10 code on the NDI file to group causes of death. The categories were as follows: diabetes (E10–E14), cardiovascular disease (I00–99), cancer (C00–97), renal failure (N17–19), infection (A00–B99, J10–18), external (injury-related) causes (V00–Y89), and all other codes. We investigated all-cause, cardiovascular (ICD-10 codes I00–I99 for underlying cause of death), and noncardiovascular mortality (all other ICD-10 codes for underlying cause of death). Time to follow-up was calculated as interview date to date of death or date censored (31 December 2007).
We assessed demographic covariates including age, sex, race/ethnicity, education, and income. We also assessed age at diagnosis of diabetes, duration of diabetes, treatment of diabetes, and BMI. We assessed clinical variables including smoking, systolic blood pressure, LDL cholesterol, hemoglobin A1C, microalbuminuria, and Charlson Index measured at baseline. The Charlson Index weights various comorbid conditions (including dementia, cardiovascular disease, chronic obstructive pulmonary disease, peptic ulcer disease, liver disease, connective tissue disease, and cancer) by the strength of their associations with mortality and was used to quantify comorbidity burden (11,12). We assessed history of hypertension, dyslipidemia, transient ischemia attack (TIA), stroke, carotid endarterectomy, angina, myocardial infarction, other coronary heart disease, coronary angioplasty, coronary bypass, congestive heart failure, peripheral vascular disease, peripheral vascular surgery, retinopathy, nephropathy, and diabetic peripheral neuropathy. We also assessed use of aspirin, diuretic, ACE inhibitor, angiotensin receptor blocker (ARB), β-blocker, calcium channel blocker, other antihypertensive, statin, or other anticholesterol medications at baseline.
Statistical analyses
We described the percent distribution of categorical variables and the mean ± SD of continuous variables. Unadjusted hazard rate ratios (HRs) were constructed using each variable singularly in three separate Cox proportional hazards models predicting all-cause, cardiovascular, and noncardiovascular mortality. Each separate model specified the total alive population as the reference category.
To simultaneously adjust for covariates predicting mortality, we constructed fully adjusted Cox proportional hazards models. Again, all-cause mortality, cardiovascular mortality, and noncardiovascular mortality, defined by underlying cause of death, were modeled separately, using the total alive population as the reference category. We excluded age at diagnosis of diabetes and duration of diabetes from the list of potential predictors because of their high degree of collinearity with age. Continuous variables were stratified into categories to allow for interpretation of patterns and to avoid violating the multiplicative model’s linearity assumption. The Cox proportional hazards models also included a stratum statement for health plan/provider group cluster to account for the clustered study design and the correlation among participants within health plans and provider groups.
To obtain the most parsimonious model (defined as the best prediction model with the least number of variables), we used stepwise Cox proportional hazards models to model all-cause, cardiovascular, and noncardiovascular mortality separately, again with each compared with the total alive population. Variables that were significant at P < 0.05 were entered and remained in the model. No variables were excluded from entry into the models; however, for some variables that we had previously categorized (age, BMI, and Charlson Index), we now entered them into the models as continuous variables. The significance of the variables in each of the models was assessed by the Wald χ2 test, and we present the estimated HRs and 95% CIs. We then used logistic regression to determine the parameter estimates for the 8-year prediction equations (the last column of Tables 1, 2, and 3). We tested for overfitting using the method of Harrell et al. (13). A shrinkage estimate of <0.85 would suggest overfitting (13). The fit of the equations was assessed by the −2 log-likelihood test and the Hosmer-Lemeshow goodness of fit χ2 test. We also assessed the discrimination of the equations, defined as their ability to correctly identify those who died, quantified by the concordance index (i.e., the c-statistic) (13). Our final three prediction equations provide estimates of a subject’s likelihood of dying over 8 years expressed as a probability between 0 and 1.0.
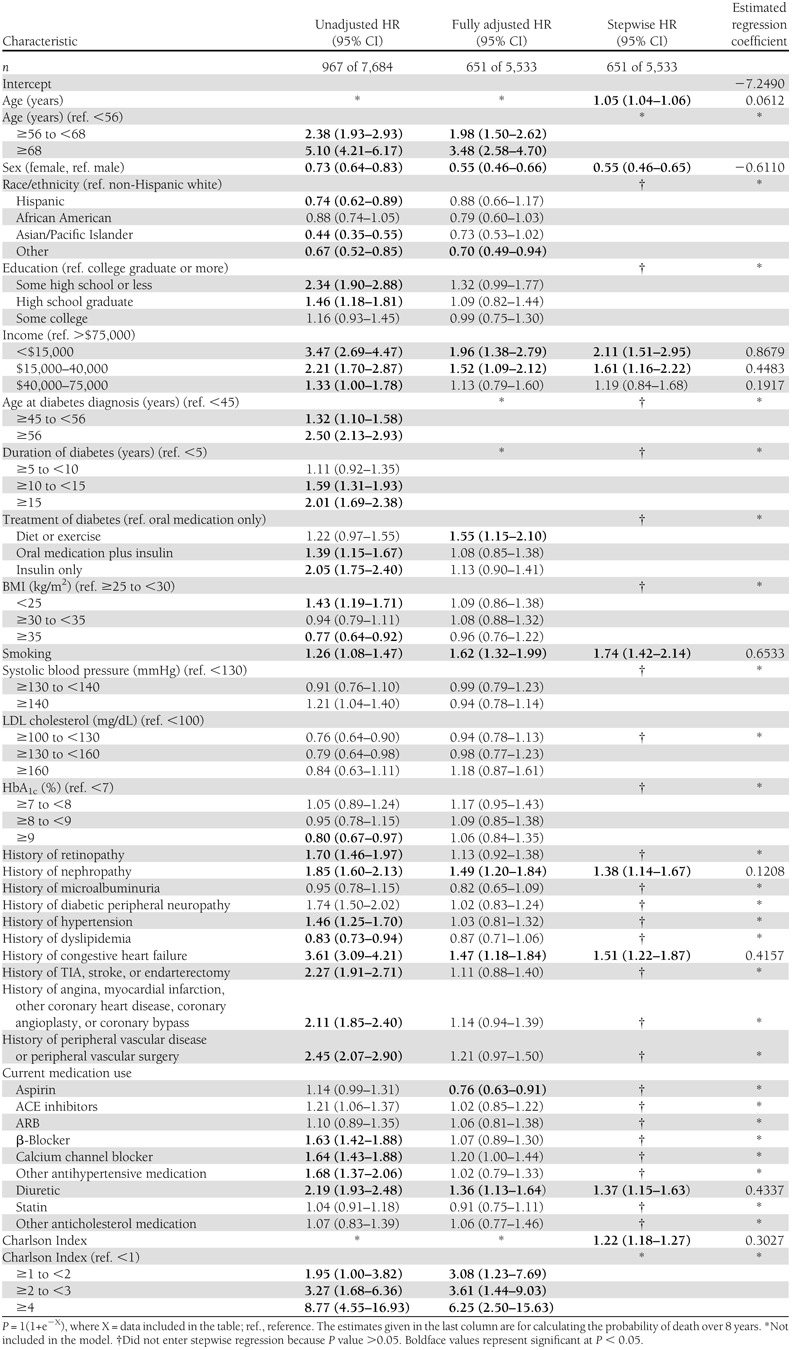
Table 1.
Unadjusted, fully adjusted, and stepwise Cox proportional hazards regression models and final equations predicting all-cause mortality in the TRIAD population adjusted for health plan/provider group cluster (N = 8,334), 2000–2007

Table 2.
Unadjusted, fully adjusted, and stepwise Cox proportional hazards regression models and final equations predicting cardiovascular mortality in the TRIAD population adjusted for health plan/provider group cluster (N = 8,334), 2000–2007

Table 3.
Unadjusted, fully adjusted, and stepwise Cox proportional hazards regression models and final equations predicting noncardiovascular mortality in the TRIAD population adjusted for health plan/provider group cluster (N = 8,334), 2000–2007
We also conducted 10-fold cross-validation of the prediction models. We randomly partitioned the data into 10 equal segments and extracted one 10% segment before the prediction model was fitted. The model was fitted with the remaining 90% of the data and we calculated sensitivity, specificity, and positive predictive value (PPV) for the 10% subsample. This process was repeated 10 times until each segment of the data was used. We report average sensitivity, specificity, and PPV for each prediction model. All analyses were performed using SAS version 9.2 (SAS Institute, Cary, NC).
RESULTS
Of the 8,334 individuals included in our analyses, 1,616 (19%) died before 1 January 2008. The average length of follow-up was 6.2 years. One percent of decedents were 25–44 years of age, 22% 45–64 years of age, 65% 65–84 years of age, and 12% ≥85 years of age. Fifty-three percent of decedents were men. Fifty percent were non-Hispanic white, 15% Hispanic, 18% African American, 9% Asian/Pacific Islander, and 8% of other race/ethnicity (Supplementary Appendix). The underlying causes of death were listed as cardiovascular for 40% of decedents and noncardiovascular for 60% of decedents. The latter causes of death included cancer (21%), other (16%), diabetes (13%), infection (5%), renal failure (3%), and external (injury-related) causes (2%). In all, 1,107 (69% of the total) had a cardiovascular cause listed in either part I or part II of the death certificate (ICD-1 codes I00–99), and 31% had no cardiovascular causes listed anywhere on the death certificate.
The first column of Table 1 presents the unadjusted HRs for all-cause mortality. The first columns of Tables 2 and 3 present the unadjusted HRs for cardiovascular mortality and noncardiovascular mortality. In unadjusted analyses of all three outcomes, we found 21 variables that were significantly associated with higher risk of mortality. They can be categorized as demographic, anthropometric, diabetes, microvascular, macrovascular, medication, and comorbidity related.
The second columns present the fully adjusted multivariate Cox proportional hazards models for all-cause (Table 1), cardiovascular (Table 2), and noncardiovascular mortality (Table 3). For all-cause and cardiovascular mortality, many of the variables significant in unadjusted analyses remained statistically significant in the fully adjusted models. Current smoking and higher LDL cholesterol became significant in both fully adjusted models. For noncardiovascular mortality, fewer than half of the variables remained significant in the fully adjusted model.
The third column presents the most parsimonious models predicting all-cause (Table 1), cardiovascular (Table 2), and noncardiovascular mortality (Table 3). Although we allowed 31 variables to enter each model, there were only 15 variables that remained in the all-cause mortality model, 16 in the cardiovascular mortality model, and 8 in the noncardiovascular mortality model. The variables that best predict all-cause mortality are older age, male sex, non-Hispanic white race, lower income, treatment with insulin with or without oral medication (vs. oral medication only), current smoking, higher LDL cholesterol, history of nephropathy, history of angina, myocardial infarction, other coronary heart disease, coronary angioplasty, or coronary bypass, history of congestive heart failure, use of diuretics or β-blockers, and higher Charlson Index (Table 1). The −2 log-likelihood test was 1311 (P < 0.0001) with 24 degrees of freedom. The max-rescaled R2 was 0.30 and the Hosmer-Lemeshow goodness-of-fit test was 10.29 (P = 0.24) with eight degrees of freedom. There were six variables that contributed at least 1% to the explained variance of the prediction equations. These were older age, higher Charlson Index, male sex, lower income, smoking, and history of congestive heart failure (partial R2 = 0.093, 0.032, 0.021, 0.015, 0.011, and 0.011, respectively). The c-statistic was 0.815, and the shrinkage of the model was 0.99. Based on the classification table derived from the logistic regression and ROC curve analysis for the all-cause mortality equation, the probability level that maximized sensitivity and specificity was 0.185, yielding a sensitivity of 73%, a specificity of 73%, and a PPV of 38%. Using 10-fold cross-validation, average sensitivity was 75%, specificity was 71%, and PPV was 38%.
The variables that predict cardiovascular mortality are older age, male sex, non-Hispanic white race, lower income, treatment of diabetes with insulin (±oral medication), higher BMI, current smoking, higher LDL cholesterol, history of nephropathy, history of TIA, stroke, or endarterectomy, history of angina, myocardial infarction, other coronary heart disease, coronary angioplasty, or coronary bypass, history of peripheral vascular disease or peripheral vascular surgery, and use of diuretics, β-blockers, or other antihypertensive or cholesterol-lowering medications (Table 2). The −2 log-likelihood test was 755 (P < 0.0001) with 20 degrees of freedom. The max-rescaled R2 was 0.29 and the Hosmer-Lemeshow goodness-of-fit test was 10.28 (P = 0.25) with eight degrees of freedom. There were five variables that contributed at least 1% to the explained variance of the prediction equation. These were older age, history of congestive heart failure, smoking, male sex, and history of stroke (partial R2 = 0.120, 0.027, 0.018, 0.013, and 0.010, respectively). The c-statistic was 0.840 and shrinkage was 0.97. For the cardiovascular mortality prediction equation, the probability level that maximized sensitivity and specificity was 0.090, yielding a sensitivity of 73%, a specificity of 78%, and a PPV of 24%. Using 10-fold cross-validation, average sensitivity was 85%, specificity was 63%, and PPV was 18%.
The variables that predict noncardiovascular mortality are older age, male sex, lower income, current smoking, history of nephropathy, history of congestive heart failure, use of a diuretic, and a higher Charlson Index (Table 3). The −2 log-likelihood test was 1023 (P < 0.0001) with 10 degrees of freedom. The max-rescaled R2 was 0.24 and the Hosmer-Lemeshow goodness-of-fit test was 12.63 (P = 0.13) with eight degrees of freedom. There were seven variables that contributed at least 1% to the explained variance of the prediction equation. These were older age, higher Charlson Index, male sex, lower income, history of congestive heart failure, smoking, and use of a diuretic (partial R2 = 0.137, 0.061, 0.026, 0.025, 0.021, 0.016, and 0.014, respectively). The c-statistic was 0.797 and shrinkage was 0.98. For the noncardiovascular mortality prediction equation, the probability level that maximized sensitivity and specificity was 0.120, yielding a sensitivity of 75%, a specificity of 70%, and a PPV of 26%. Using 10-fold cross-validation, average sensitivity was 68%, specificity was 73%, and PPV was 27%.
CONCLUSIONS
We described predictors of mortality over 8 years in an insured population with diabetes that had good access to high-quality medical care. Although cardiovascular disease was the leading cause of death in this population (40%), cancer and other diabetes-related conditions, such as infections and renal failure, were also listed frequently as the underlying cause of death. In general, the predictors of 8-year mortality in fully adjusted models are similar to predictors of 4-year mortality in TRIAD, suggesting that these models are likely generalizable enough to predict future mortality risk. Socio-demographic factors including older age, male sex, white race/ethnicity, lower income, and smoking are consistently associated with mortality. Diabetes-related variables including older age at diagnosis, longer duration of diabetes, and treatment with insulin with or without oral medications are associated with mortality in unadjusted models. In fully adjusted models, only treatment with insulin with our without oral medications remains a significant risk factor for all-cause and cardiovascular mortality. As one might expect, history of nephropathy predicts all-cause, cardiovascular, and noncardiovascular mortality. Charlson Index is not associated with cardiovascular mortality, and history of macrovascular disease is not associated with noncardiovascular mortality.
To our surprise, we found that history of dyslipidemia is associated with a decreased risk of all-cause and cardiovascular mortality. We hypothesize that this might be related to our inclusion of dyslipidemia and LDL cholesterol levels and use of cholesterol-lowering medications in the models. If history of dyslipidemia is an indicator of cholesterol-lowering medication use, this would tend to attenuate the association between dyslipidemia and mortality. Confounding by indication might also explain the associations between antihypertensive medication use and cardiovascular mortality. Higher rates of mortality are observed for those using diuretics, β-blockers, and other antihypertensive medications but those medications are more likely prescribed for those with longer duration and more severe hypertension and for those with cardiovascular disease and congestive heart failure.
A previous study predicting all-cause mortality in people with diabetes was performed for 33,067 individuals included in the Cleveland Clinic electronic health record (14). This study only included patients initially prescribed a single oral hypoglycemic agent, whereas our study included all people identified as having type 2 diabetes regardless of medication use. Both studies found that older age, male sex, white race, smoking, insulin use, history of heart disease, history of heart failure, and not using aspirin predicted greater risk of death. However, our study did not assess glomerular filtration rate, oral diabetes medication class, diastolic blood pressure, HDL, triglycerides, new diagnosis of diabetes, or clopidogrel use. We include an indicator for history of diabetic nephropathy, which was significant in the most parsimonious model. Although we included BMI, HbA1c, systolic blood pressure, LDL, ACE inhibitor or ARB use, and use of lipid-lowering drugs as possible variables, none of these entered the most parsimonious models.
Our findings were also similar to the results of a study conducted in Hong Kong. In that study, older age, male sex, history of peripheral vascular disease, and insulin use were associated with higher risk of all-cause mortality (15). We allowed for a continuous measurement of HbA1c and BMI in our model but neither was significant in multivariate analyses. Our study did not investigate albumin-creatinine ratio or glomerular filtration rate, although we did include history of microalbuminuria, nephropathy, and Charlson Index, two of which were significant in the most parsimonious models. The measures of area under the curve, sensitivity, and specificity for our prediction equation were very similar to those for the equation developed in the Hong Kong study.
Our study has several limitations. First, we sought to develop prediction equations to optimally discriminate the outcome of interest (mortality). As a result, we did not seek to develop causal models. The fact that a variable enters an equation does not mean that it is causally important. Similarly, variables that do not enter an equation are not necessarily unimportant in the chain of causation. We conducted a sensitivity analysis and found that stepwise selection and backward elimination models align well. For all-cause mortality, 14 of the 17 variables were the same in the stepwise and backward elimination models. For the cardiovascular mortality model, all the significant variables were the same. For the noncardiovascular mortality model, 8 of the 13 variables were the same. It is not surprising that the noncardiovascular disease model did not align as well as the others because many different risk factors may contribute to mortality related to cancer, infections, etc.
Another limitation of our study is the use of data from people enrolled in managed care plans; our results may not be generalizable to those outside of managed care, or even those in managed care plans with different levels of access to care or quality of care. Indeed, the fact that our population had good access to high-quality care may have attenuated the impact of biological risk factors on mortality. In addition, our sample did not include people with newly diagnosed diabetes. Everyone had physician-diagnosed diabetes for at least 18 months before the survey, which might have resulted in higher mortality rates.
In conclusion, we created three prediction equations with good discrimination and high sensitivity and specificity. Although our equations need to be validated in other populations, they highlight the importance of specific demographic and biological risk factors for mortality in people with type 2 diabetes and provide a quantitative assessment of risk. These prediction equations may be incorporated into computer simulation models of disease progression. After further validation, clinicians may also use such equations to inform patients about their risk for mortality and to target the most modifiable risk factors for intervention.
Acknowledgments
This study was jointly funded by Program Announcement 04005 from the Centers for Disease Control and Prevention (Division of Diabetes Translation) and the National Institute of Diabetes and Digestive and Kidney Diseases. Support was also provided by the Biostatistics and Economic Modeling Core of the Michigan Diabetes Research and Training Center (Grant P60DK020572).
No potential conflicts of interest relevant to this article were reported.
The findings and conclusions in this report are those of the author(s) and do not necessarily represent the views of the funding agency(s).
L.N.M. researched data, contributed to discussion, and wrote, reviewed, and edited the manuscript. A.J.K., B.E.W., J.C.C., D.G.M., C.M.M., and W.H.H. researched data, contributed to discussion, and reviewed and edited the manuscript. L.N.M. is the guarantor of this work and, as such, had full access to all the data in the study and takes responsibility for the integrity of the data and the accuracy of the data analysis.
Significant contributions to this study were made by members of the TRIAD study group. The authors acknowledge the participation of their health plan partners.
Footnotes
This article contains Supplementary Data online at http://care.diabetesjournals.org/lookup/suppl/doi:10.2337/dc11-2281/-/DC1.
References
- 1.National Center for Chronic Disease Prevention and Health Promotion. 2007 National Diabetes Fact Sheet [Internet] 2007. Available from http://www.cdc.gov/diabetes/pubs/estimates07.htm Accessed 3 December 2010
- 2.National Center for Health Statistics. Leading Causes of Death [Internet], 2007. Available from http://www.cdc.gov/nchs/fastats/lcod.htm Accessed 3 December 2010
- 3.McEwen LN, Kim C, Haan M, et al. TRIAD Study Group Diabetes reporting as a cause of death: results from the Translating Research Into Action for Diabetes (TRIAD) study. Diabetes Care 2006;29:247–253 [DOI] [PubMed] [Google Scholar]
- 4.Will JC, Vinicor F, Stevenson J. Recording of diabetes on death certificates. Has it improved? J Clin Epidemiol 2001;54:239–244 [DOI] [PubMed] [Google Scholar]
- 5.Bild DE, Stevenson JM. Frequency of recording of diabetes on U.S. death certificates: analysis of the 1986 National Mortality Followback Survey. J Clin Epidemiol 1992;45:275–281 [DOI] [PubMed] [Google Scholar]
- 6.McEwen LN, Kim C, Karter AJ, et al. Risk factors for mortality among patients with diabetes: the Translating Research Into Action for Diabetes (TRIAD) study. Diabetes Care 2007;30:1736–1741 [DOI] [PubMed] [Google Scholar]
- 7.TRIAD Study Group The Translating Research Into Action for Diabetes (TRIAD) study: a multicenter study of diabetes in managed care. Diabetes Care 2002;25:386–389 [DOI] [PubMed] [Google Scholar]
- 8.Centers for Disease Control and Prevention. National Center for Health Statistics: National Death Index (NDI), NDI Plus Searches [Internet]. Available from http://www.cdc.gov/nchs/ndi.htm Accessed 2 September 2010
- 9.Cowper DC, Kubal JD, Maynard C, Hynes DM. A primer and comparative review of major US mortality databases. Ann Epidemiol 2002;12:462–468 [DOI] [PubMed] [Google Scholar]
- 10.Williams BC, Demitrack LB, Fries BE. The accuracy of the National Death Index when personal identifiers other than Social Security number are used. Am J Public Health 1992;82:1145–1147 [DOI] [PMC free article] [PubMed] [Google Scholar]
- 11.Charlson ME, Pompei P, Ales KL, MacKenzie CR. A new method of classifying prognostic comorbidity in longitudinal studies: development and validation. J Chronic Dis 1987;40:373–383 [DOI] [PubMed] [Google Scholar]
- 12.de Groot V, Beckerman H, Lankhorst GJ, Bouter LM. How to measure comorbidity. a critical review of available methods. J Clin Epidemiol 2003;56:221–229 [DOI] [PubMed] [Google Scholar]
- 13.Harrell FE, Jr, Lee KL, Mark DB. Multivariable prognostic models: issues in developing models, evaluating assumptions and adequacy, and measuring and reducing errors. Stat Med 1996;15:361–387 [DOI] [PubMed] [Google Scholar]
- 14.Wells BJ, Jain A, Arrigain S, Yu C, Rosenkrans WA, Jr, Kattan MW. Predicting 6-year mortality risk in patients with type 2 diabetes. Diabetes Care 2008;31:2301–2306 [DOI] [PMC free article] [PubMed] [Google Scholar]
- 15.Yang X, So WY, Tong PC, et al. Hong Kong Diabetes Registry Development and validation of an all-cause mortality risk score in type 2 diabetes. Arch Intern Med 2008;168:451–457 [DOI] [PubMed] [Google Scholar]