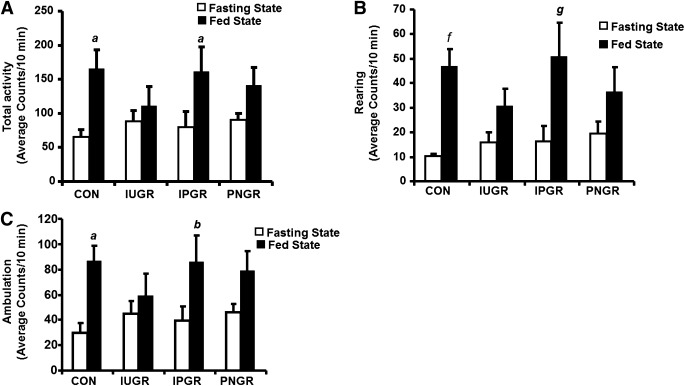
FIG. 4.
Total activity (A), rearing activity (B), and total ambulatory activity (C) are shown in IUGR, IPGR, PNGR, and CON groups during fasting and fed states averaged as counts for 10-min epochs (n = 6 in each group). Fasting vs. fed states compared within the same group: aP < 0.01, bP < 0.02, fP < 0.001, gP < 0.003.

