Type 1 diabetes (T1D) is often first recognized when signs and symptoms occur, yet the pathogenetic development of T1D usually begins years before that. Pancreatic autoantibodies commonly become elevated long before diagnosis (1). Although data indicate that the first-phase insulin response (FPIR) is also abnormal well before diagnosis (2–5), the development and progression of metabolic abnormalities had not been well characterized until the recent performance of T1D prevention trials (6–8). The unique designs of these trials provided the opportunity to perform longitudinal studies that have yielded new insights into metabolic changes that occur during the progression to T1D. This review will describe what we have learned about the metabolic natural history of T1D from the Diabetes Prevention Trial–Type 1 (DPT-1).
A description of DPT-1.
DPT-1 included two separate trials, the parenteral and oral insulin trials (6,7). The objective of both trials was to delay or prevent the occurrence of T1D by interfering with the immunologic processes that result in the disorder. The parenteral insulin trial consisted of an intervention group that received subcutaneous ultralente insulin at a dose of 0.125 units/kg twice daily and a control group that received no insulin. The intervention group was admitted annually to a unit for 4 days during which a continuous infusion of recombinant human regular insulin was administered. The oral insulin trial included an intervention group, which received a once-daily dose of 7.5 mg recombinant human insulin crystals, and a placebo control group.
In both trials, individuals were required to be nondiabetic, aged 1–45 years, and first- or second-degree relatives of T1D patients. Two phases determined further eligibility for the trials. In the screening phase, the relatives were tested for islet cell autoantibody (ICA) positivity. Those positive then participated in a risk assessment phase. This included an intravenous glucose tolerance test (IVGTT) and a 2-h oral glucose tolerance test (OGTT). Eligibility for the parenteral trial was dependent on a 5-year risk estimate of >50%. This was based on an abnormal FPIR during the IVGTT and/or glucose abnormalities during the OGTT. If the metabolic indexes were normal, there was testing for insulin autoantibodies. Those positive were considered to have a 26–50% risk estimate and were deemed eligible for the oral insulin trial. Participants in both trials were monitored with 2-h OGTTs that were performed at 6-month intervals for the diagnostic surveillance of T1D. Glucose and C-peptide measurements were obtained fasting and at 30-min intervals.
T1D was diagnosed in most by the OGTT surveillance. If an OGTT met American Diabetes Association (ADA) criteria for diabetes (fasting glucose ≥126 mg/dL and/or 2-h glucose ≥200 mg/dL), a repeat OGTT was performed unless T1D was diagnosed clinically in the interim. If the diagnosis was confirmed by a second OGTT, the date of the first diabetic OGTT was considered the date of diagnosis. Neither the parenteral nor oral insulin interventions had an overall effect. Characteristics of the DPT-1 participants are reported in Supplementary Table 1.
The surveillance for T1D in DPT-1 resulted in an earlier diagnosis than a diagnosis made clinically. A minority of those diagnosed had presenting signs and symptoms, and diabetic ketoacidosis was rare (9). Also, the C-peptide levels at diagnosis in the DPT-1 participants were higher than those of new-onset T1D patients in other studies (10–13).
Metabolic progression until 6 months before diagnosis.
The metabolic progression to T1D was studied in 22 parenteral insulin trial and 32 oral insulin trial participants who had OGTTs every 6 months from 30 months to 6 months before diagnosis (10). Glucose levels (fasting glucose, 2-h glucose, and area under the curve [AUC] glucose) in both groups tended to increase gradually during that interval (P < 0.001 for slopes of each index from 30 months to 6 months before diagnosis). The increase in glucose was such that >80% had abnormal glucose tolerance by 6 months before diagnosis. Despite the increasing glucose, there was little change in the C-peptide measures, including fasting C-peptide, peak C-peptide, and AUC C-peptide. There was only a small, but significant negative slope (P < 0.05) for the AUC C-peptide in the oral group. The lack of appreciable change of those C-peptide measures was somewhat surprising in view of the increasing glucose and prior data showing that the FPIR is frequently abnormal well before diagnosis.
Subsequent analyses of C-peptide dynamics during the OGTT have helped to explain the rather small changes in the overall C-peptide measures during progression. The 30–0-min C-peptide difference (r = 0.50 for correlation with FPIR, P < 0.001, n = 504) was used in analyses of children aged <15 years (14). Hereafter, the 30–0-min C-peptide difference will be referred to as the early C-peptide response.
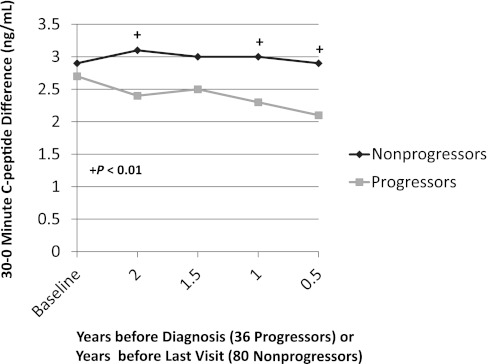
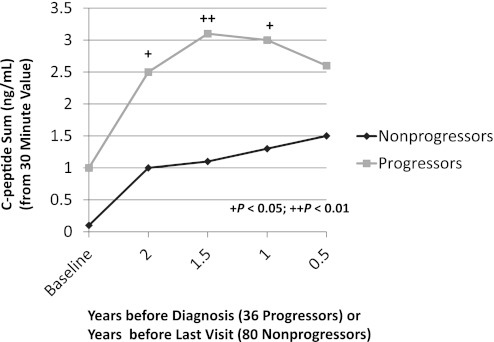
In a longitudinal analysis of 36 progressors (14) with normal glucose tolerance at baseline, there was a decreased early C-peptide response at least 2 years before the diagnosis of T1D. This was especially apparent when the progressors were compared with 80 nonprogressors (P < 0.01; Fig. 1). (The fasting and 30-min values are reported in Supplementary Table 2.) In contrast, the late C-peptide response (the sum of each of the differences of the 30-min C-peptide value from the 60-, 90-, and 120-min values) was increased (P < 0.05) 2 years before diagnosis (Fig. 2). Among the progressors, the early C-peptide response decreased from baseline to 6 months before diagnosis (P < 0.01), whereas the late C-peptide response increased in that interval (P < 0.05).
FIG. 1.
Shown is the difference in C-peptide levels from 0 to 30 min (the 30–0-min C-peptide difference) according to the times before diagnosis (36 progressors) or the times before the last visit (80 nonprogressors). The 30–0-min C-peptide difference was consistently lower in the progressors than in the nonprogressors. (Mean values are shown for the times before diagnosis or the last visit. The mean time from baseline to the last visit was 4.2 years for the nonprogressors; the mean time from baseline to diagnosis was 3.7 years for the progressors.)
FIG. 2.
Shown is the C-peptide sum after 30 min according to the times before diagnosis (36 progressors) or the times before the last visit (80 nonprogressors). The values were higher in the progressors from baseline to 0.5 years. (Mean values are shown for the times before diagnosis or the last visit. The mean time from baseline to the last visit was 4.2 years for the nonprogressors; the mean time from baseline to diagnosis was 3.7 years for the progressors.)
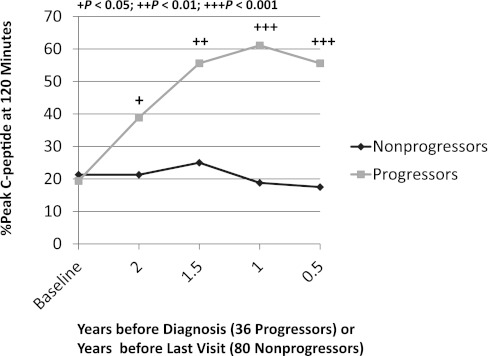
The increased late C-peptide response during the OGTT was evident in the timing of the peak C-peptide (Fig. 3) (14). The proportion of progressors whose peak C-peptide occurred at 120 min increased from 19% at baseline to 56% at 6 months before diagnosis. Also, the occurrence of the peak C-peptide at 120 min was higher in the progressors than in the nonprogressors, even 2 years before diagnosis (P < 0.05). Consistent with these findings, the timing of the peak C-peptide was more predictive of T1D (P < 0.001) than the actual peak C-peptide value (P = 0.028) (14). The basis for the enhanced late C-peptide response is unclear. It could well be a reaction to the decreased early insulin response, but the signals and mechanism for this have not been delineated.
FIG. 3.
Shown are the percentages with the peak C-peptide value at 120 min according to the times before diagnosis (36 progressors) or the times before the last visit (80 nonprogressors). The percentage of progressors with a peak C-peptide value at 120 min increased substantially as the diagnosis approached. In contrast, the nonprogressors had little change over time. (The mean time from baseline to the last visit was 4.2 years for the nonprogressors; the mean time from baseline to diagnosis was 3.7 years for the progressors.)
In an unreported analysis, the timing of the peak insulin response in progressors was studied using an estimate of the insulin secretory rate that was calculated from C-peptide levels (15). In that analysis, individuals were classified as “early” responders if the peak response occurred within the first 45 min after ingesting glucose or “late” responders if the response occurred after that time. In a previous report, only 6% of healthy controls were late responders and 45% of T1D patients were late responders (P < 0.001) (16). In applying this classification to the DPT-1 data, a greater proportion of DPT-1 progressors (40%) were also found to be late responders compared with the healthy controls (P < 0.001). The frequency of late responders was lower in nonprogressors (22%) but was still greater than that of the controls (P < 0.05). These findings corroborate the findings previously presented (14).
The partitioning of C-peptide levels according to the time after the glucose challenge explains why overall measures such as AUC C-peptide and peak C-peptide change little until 6 months before diagnosis. The delayed insulin response compensates quantitatively for the decreased early insulin response so that the overall measures do not reflect the actual extent of abnormal insulin secretion. The findings pertaining to the timing of secretion were not affected by the interventions because the same trends were apparent when those untreated were analyzed separately.
Little longitudinal information is available regarding metabolic changes before the diagnosis of T1D other than that derived from DPT-1. In another analysis of DPT-1 data (17), although appreciable proportions had normal OGTTs (24%) or normal IVGTTs (22%) 6 months before diagnosis, the results of both tests were normal in only 3%. In a longitudinal study (18), 57 siblings of T1D patients were monitored with serial IVGTTs. When the 17 who developed T1D (median preclinical period of 29 months) were compared with the 40 nonprogressors, FPIR values were lower at baseline and remained lower in the progressors throughout the study period. The glucose elimination rate decreased as tests were repeated over time. In a study of autoantibody-positive children (19), hemoglobin A1c levels increased during the progression to T1D, and increments within the normal range were predictive of the diagnosis. Data from other studies also suggest that impaired insulin secretion (2–5) and glucose abnormalities (20–22) can occur years before the onset of T1D.
The perionset period.
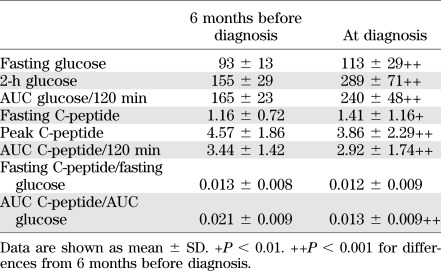
For analytic purposes, the perionset period was defined as 6 months before diagnosis to 3 months after diagnosis. In an analysis of 115 DPT-1 participants (not previously published), more marked metabolic decompensation was evident between 6 months before diagnosis and diagnosis (Table 1). Fasting, 2-h glucose, and AUC glucose levels increased substantially (P < 0.001 for all) during this period, and there was a decline in the AUC C-peptide and the peak C-peptide (P < 0.001 for both). In contrast, fasting C-peptide levels increased during the 6 months before diagnosis (P < 0.01). Because OGTTs were not routinely performed between 6 months before diagnosis and diagnosis, the DPT-1 data cannot be used to discern the actual pattern of deterioration within that period.
TABLE 1.
Glucose (mg/dL) and C-peptide (ng/mL) values of DPT-1 participants (n = 115) with OGTTs 6 months before diagnosis and at diagnosis
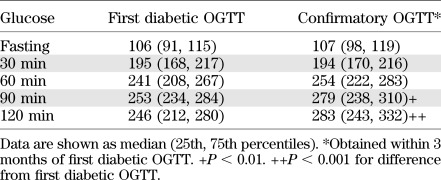
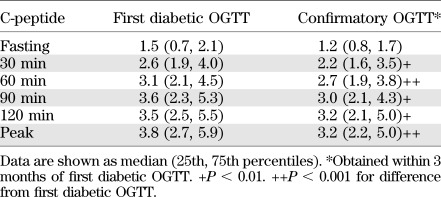
As mentioned above, when an OGTT was in the diabetic range, a second OGTT was to be performed to confirm the diagnosis. This provided the opportunity to examine the metabolic changes that occur in the period immediately after the diagnosis (23). Among the 63 subjects with a diabetic OGTT and a confirmatory diabetic OGTT within 3 months (mean ± SD interval, 5.5 ± 2.8 weeks), glucose (Table 2) and C-peptide (Table 3) levels were compared between the OGTTs. (Those in the parenteral trial intervention group were excluded due to the potential for the unauthorized use of insulin between the OGTTs.) Glucose levels were actually similar between the OGTTs in the fasting state and at 30 min. However, they tended to be higher in the second OGTT at 60 min and were significantly higher at 90 (P < 0.01) and 120 (P < 0.001) min. C-peptide levels were significantly lower in the second OGTT at all times (P < 0.01) except in the fasting state (P = 0.054).
TABLE 2.
Glucose (mg/dL) values for first diabetic and confirmatory OGTTs of DPT-1 participants (n = 63)
TABLE 3.
C-peptide (ng/mL) values for first diabetic and confirmatory OGTTs of DPT-1 participants (n = 63)
In the same study (23), the decline in overall C-peptide was more accelerated after diagnosis than within the 6 months before the diagnosis. Of the 63 who had a confirmatory OGTT, 55 also had an OGTT approximately 6 months before diagnosis. The median percentage change of the peak C-peptide from 6 months before diagnosis to diagnosis was −14.0% (P = 0.052). The decline from the first diabetic OGTT to the second diabetic OGTT was greater (−45.7%, P < 0.001), even though the interval was shorter. The overall decline from the last nondiabetic OGTT to the second diabetic OGTT (mean ± SD interval, 7.5 ± 1.3 months) was −23.8% (P < 0.001). Thus, there was already a marked decline in C-peptide levels by 3 months after diagnosis, even when the diagnosis was made by OGTT surveillance.
The basis for the more rapid metabolic decline in the perionset period is not known. However, in another analytic approach to the DPT-1 data (24), glucose was also found to increase gradually and then increase more substantially as the diagnosis approached. Because the more marked increase was just preceded by a decrease in the sensitivity of the β-cell to glucose, that insensitivity could be a trigger for the more rapid metabolic decline. Why the β-cell becomes insensitive to glucose is not clear; however, the increasing glucose itself might possibly be a contributor.
Although no other studies have monitored the same individuals metabolically from before diagnosis to after the diagnosis of T1D, changes in C-peptide levels after the clinical diagnosis of T1D have been examined. Such changes from diagnosis to 1 year after diagnosis have varied from a decline of ∼50% to no decline at all (25–30). These differences could possibly be related to differences in the populations studied, because the amount of residual C-peptide has been associated with age (31), BMI (31), autoantibody positivity (27), genetic factors (32), and the degree of glucose control (25,26).
The findings from the DPT-1 analysis of the change in C-peptide after diagnosis are not directly comparable with findings from other studies of C-peptide changes after diagnosis because diagnoses were made earlier in DPT-1. As mentioned above, C-peptide levels were higher at diagnosis in the DPT-1 cohort compared with other studies of new-onset T1D patients (10–13). However, the DPT-1 data (23) suggest the possibility that the relative rate of decline in C-peptide is greater during the perionset period (from 6 months before diagnosis to 3 months after diagnosis) than later in the course of T1D.
Excursions among states of glycemia.
Dysglycemic OGTTs (defined as fasting glucose values 100–125 mg/dL; and/or 30-, 60-, or 90-min glucose values ≥200 mg/dL; and/or 120-min glucose values 140–199 mg/dL) were common before diagnosis (33). The median fractions of dysglycemic OGTTs were 0.67 in the progressors and 0.13 in the nonprogressors (P < 0.001). The OGTTs in a sizeable number of progressors varied between the normal and dysglycemic states. Of 64 progressors who had a dysglycemic OGTT and then at least two subsequent OGTTs, 33 (52%) reverted to a normal OGTT that was followed again by a dysglycemic OGTT. Of 135 progressors who had four or more OGTTs before diagnosis (34), 30 (22%) had at least two cycles in which there was a change from a normal OGTT to a dysglycemic OGTT. These are likely to be underestimates of the true frequency of the excursions because more dysglycemia would probably have been detected had OGTTs been performed at shorter intervals.
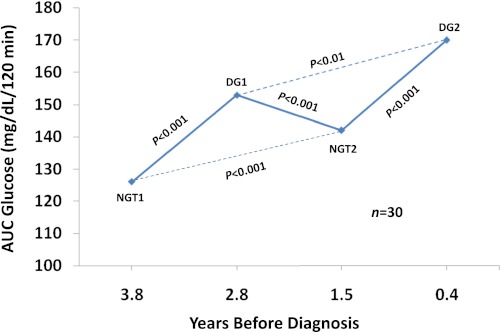
Those 30 individuals with two cycles of change from a normal OGTT to a dysglycemic OGTT were further analyzed to better understand metabolic variation within individuals during the progression to T1D (Fig. 4). Glucose levels increased significantly from the first “normal” state to the second “normal” state (P < 0.001). This increase in glucose within the normal range is consistent with DPT-1 data that showed even within that range glucose levels are predictive of T1D (P < 0.001) (35). Figure 4 also indicates that the glucose levels from the second dysglycemic OGTT were significantly higher than those from the first dysglycemic OGTT (P < 0.01). Thus, glucose levels appear to increase in a ratcheting pattern with progression to T1D.
FIG. 4.
Shown are excursions between normal glucose tolerance (NGT) and dysglycemic (DG) states in 30 progressors to T1D. Each point represents the mean AUC glucose from the OGTTs. The mean time before diagnosis is shown for the OGTTs. There were significant increases in the AUC glucose from each of the normal OGTTs to their subsequent respective dysglycemic OGTTs. There were also significant increases from the first normal OGTT to the second normal OGTT, and from the first dysglycemic OGTT to the second dysglycemic OGTT. (The dashed lines indicate differences in glucose levels after a return to the same state of glycemia.) (A high-quality color representation of this figure is available in the online issue.)
Despite the frequency with which dysglycemic OGTTs normalize, once dysglycemia occurs, the risk for subsequent T1D is high, especially in children. Among those aged <13 years whose OGTTs changed from normal at baseline to dysglycemic at the 6-month visit, the risk estimate for T1D at 5 years was 94% (33).
Changes in β-cell function were examined as a possible explanation for the wide fluctuations between the normal and dysglycemic states (34). Dysglycemic and normal OGTT pairs within individuals were selected for an analysis to examine this possibility. When the normal OGTT preceded the dysglycemic OGTT (n = 146), the early C-peptide response was significantly lower in the dysglycemic OGTT (P < 0.001). In contrast, when the dysglycemic OGTT preceded the normal OGTT (n = 70), the early C-peptide response was higher in the dysglycemic OGTT, although not significantly. In another pairing, those with a normal OGTT and a dysglycemic OGTT (n = 98) were selected so that the average time before diagnosis would be almost the same for those OGTTs (i.e., synchronized) (34). Comparisons of the dysglycemic and normal OGTTs that were synchronized showed the dysglycemic OGTTs actually had higher fasting (P < 0.05), 90-min (P < 0.05), and 120-min (P < 0.001) C-peptide values. There was no significant difference in the early C-peptide response.
Glucose variability was further assessed by studying OGTTs that fluctuated between the diabetic range and the nondiabetic range (33). The DPT-1 study design was conducive for such an analysis because OGTTs in the diabetic range required confirmatory OGTTs (see above). If diabetic range OGTTs were followed by nondiabetic range OGTTs, they were considered to be transient diabetic OGTTs. Similar to the excursions between the normal and dysglycemic OGTTs, transient diabetic range OGTTs were common with progression to T1D. In 60 progressors, a diabetic range OGTT was followed by a nondiabetic range OGTT.
Of the 60 with a transient diabetic range OGTT, the subsequent nondiabetic OGTT was performed within 3 months in 55. Interestingly, despite the higher glucose levels in the transient diabetic range OGTT, there were no significant differences in the C-peptide levels at any time. In fact, they tended to be higher in the transient diabetic range OGTT. The early C-peptide response was also similar between the transient diabetic range OGTT and the subsequent nondiabetic OGTT. Among the 55 analyzed above, 38 were eventually diagnosed with T1D by a subsequent OGTT (34). Glucose levels were higher in the OGTT at diagnosis at all times (P < 0.01) than in the transient diabetic range OGTT, whereas C-peptide values were lower at 60, 90, and 120 min (P < 0.01) in the OGTT at diagnosis. The early C-peptide response was also much lower in the OGTT at diagnosis (P < 0.01).
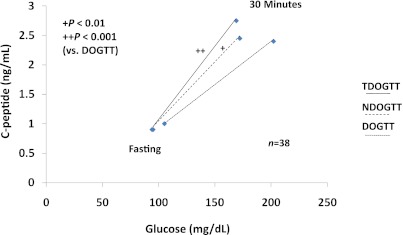
Figure 5 shows the early C-peptide response (change from 0 to 30 min) in relation to the change in glucose from 0 to 30 min in the transient diabetic range OGTT, subsequent nondiabetic range OGTT, and finally, the OGTT at diagnosis (34). The ratio of the change in C-peptide over the change in glucose from 0 to 30 min did not differ significantly between the transient diabetic range OGTT and the nondiabetic range OGTT. However, the ratio was significantly lower in the OGTT at diagnosis than in the transient diabetic range OGTT (P < 0.001) and the nondiabetic range OGTT (P < 0.01).
FIG. 5.
Shown are C-peptide responses in relation to glucose responses from 0 to 30 min in the transient diabetic range OGTT (TDOGTT), the subsequent nondiabetic range OGTT (NDOGTT) within 3 months, and the OGTT at diagnosis (DOGTT) in 38 progressors to T1D. The ratio of the C-peptide response over the glucose response from 0 to 30 min did not differ significantly between the TDOGTT and the NDOGTT, but was significantly higher in the TDOGTT and the NDOGTT than in the DOGTT. (Median values are shown.) (A high-quality color representation of this figure is available in the online issue.)
In the analyses described above, the early C-peptide response did not differ between the dysglycemic OGTT and the normal OGTT or between the transient diabetic OGTT and the nondiabetic OGTT. Because glucose variability between states of glycemia does not appear to depend on the early C-peptide response, it is possible that the glycemic fluctuations result from variability in insulin sensitivity. Changes in insulin sensitivity could lead to greater glucose variability with progression to T1D because there is a background of diminished β-cell function. It has been postulated that insulin sensitivity could be a factor in the pathogenesis of T1D (36–40). Moreover, the C-peptide patterns among those who are dysglycemic are not unlike insulin patterns of adults with impaired glucose tolerance or diabetes (41,42).
The lack of relation between the glucose excursions and the early C-peptide response contrasts with the trend of increasing glucose levels and a decreasing early C-peptide response during progression. Thus, there could be two factors that influence glucose levels with progression. Whereas diminishing β-cell function could be responsible for the long-term longitudinal increase in glucose during progression, changes in insulin sensitivity could be the basis for the more short-term glucose variability. It is of interest that remissions in newly diagnosed T1D patients appear to be related to changes in insulin sensitivity (43,44).
Metabolic progression and the development of a T1D risk score.
The DPT-1 data were used to develop the DPTRS, a risk score for the prediction of T1D (45). The components of the DPTRS [log fasting C-peptide, (glucose sum from 30 to 120 min)/100, (C-peptide sum from 30 to 120 min)/10, age, BMI] are consistent with the observations of changes in glucose and C-peptide during the progression to T1D. Thus, the use of the entirety of the glucose range for prediction, rather than the presence or absence of dysglycemia, is consistent with the increasing glucose within the normal range that occurs years before diagnosis (10,19). Also, the use of both the fasting and postchallenge C-peptide for prediction is consistent with their differing trends in the latter stages of progression. Because we observed that BMI and age were independent contributors to the prediction of T1D, they were added to the metabolic variables.
The DPTRS has now been validated in a separate autoantibody-positive cohort, the TrialNet Natural History Study (46). It was highly accurate, and the occurrence of T1D according to DPTRS intervals was very similar in the TrialNet and DPT-1 cohorts. The DPTRS should lead to a more precisely targeted and efficient selection of participants for T1D prevention trials. This will potentially result in the inclusion of larger numbers of trial participants. More importantly, the DPTRS should help reduce risk misclassification. This would reduce the number of those unnecessarily exposed to interventions with possible adverse consequences. If therapeutic interventions that delay T1D become available clinically, the DPTRS could also be useful in identifying high-risk individuals for whom treatment would be appropriate. In addition, the DPTRS could be used to help assess the efficacy of an intervention.
Clinical implications of the data.
The DPT-1 data show that metabolic deterioration begins well before the diagnosis of T1D and that it is progressive. Moreover, it is apparent that even when the diagnosis is made by OGTT surveillance, an appreciable percentage of C-peptide is already lost. Because data suggest that C-peptide preservation could contribute to a reduction in the complications of T1D (47,48), and that, as mentioned above, an early diagnosis can help to prevent diabetic ketoacidosis (9), it is important to identify those who will inevitably develop clinical T1D as early in the course of progression as possible. The DPTRS data suggest that the improved prediction of T1D could ultimately evolve into the earlier detection of the disease.
Because metabolic interventions (25,26) have reduced C-peptide loss in new-onset patients, such interventions could also possibly be efficacious in the prediabetic state. The reduction of excursions into the dysglycemic range during progression by glucose-lowering agents could conceivably help to maintain β-cell function. Insulin sensitizers might provide particular benefit in view of the possibility that variations in insulin sensitivity are a basis for the wide glucose excursions during progression.
Subject selection in DPT-1 and analytic considerations.
The DPT-1 findings are based on data derived from a selected population of ICA-positive relatives of T1D patients. Because most T1D cases are sporadic (i.e., no relatives with T1D) in the clinical setting, it is possible that the DPT-1 findings do not generalize to those individuals. However, data suggest that nonsporadic and sporadic cases are similar clinically (11,49) and that autoantibodies confer substantial risk in relatives of T1D patients (6–8) and in the general population (50).
There was also some selection for the analyses that are described. Most of the analyses were longitudinal and focused on DPT-1 participants who had several OGTTs. Thus, it is possible that the DPT-1 participants included in the analyses tended to be slower progressors who would have been more likely to have a greater number of OGTTs. However, those analyzed still represent a sizable proportion of the progressors in DPT-1. The longitudinal analyses are advantageous in that interindividual variation is not a concern.
As discussed above, most of the DPT-1 progressors were diagnosed by glucose surveillance. The analyses look backward from the date of diagnosis; thus, it is important to keep in mind that metabolic progression is described according to a time frame for those mostly diagnosed by OGTT surveillance. The picture could be different when the time frame is before a clinical diagnosis.
Summary and conclusions.
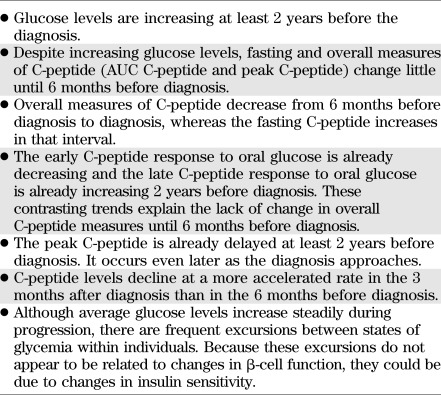
The DPT-1 data show (Table 4) that the metabolic progression to T1D commonly begins at least 2 years before diagnosis. It is characterized by increasing glucose levels with little change in overall C-peptide levels (as indicated by the AUC C-peptide and the peak C-peptide) until 6 months before diagnosis. Within 6 months of diagnosis, the levels of the overall C-peptide measures fall more markedly, and the decline accelerates even more after diagnosis. Data suggest that the more rapid decline could be related to decreased β-cell sensitivity to glucose.
TABLE 4.
Key aspects of the metabolic progression to T1D
Abnormalities in insulin secretion are evident earlier when the dynamics of the C-peptide response to oral glucose are considered. The early C-peptide response decreases and the late C-peptide response increases at least 2 years before diagnosis. Also, the timing of the peak C-peptide is delayed well before diagnosis.
Against the background of increasing glycemia over time, there are frequent wide excursions of glucose levels between states of glycemia with progression. This variability can be described as a ratcheting pattern. In contrast with the increasing glucose during progression, the glucose excursions do not appear to be related to the early C-peptide response. This suggests that changes in insulin sensitivity could play a role, especially in the context of impaired β-cell function.
The findings from the metabolic progression analyses in DPT-1 have provided a basis for the development of a T1D risk score, the DPTRS, which has been validated and shown to be highly accurate and robust within another autoantibody-positive cohort, the TrialNet Natural History Study. The DPTRS has potential utility for accurately identifying individuals at high risk for T1D who would be appropriate for participating in T1D prevention trials. If treatments become available clinically, the DPTRS could also identify high-risk individuals who might benefit from them.
ACKNOWLEDGMENTS
The sponsor of the study was the Type 1 Diabetes TrialNet Study Group. Type 1 Diabetes TrialNet Study Group is a clinical trials network funded by the National Institutes of Health (NIH) through the National Institute of Diabetes and Digestive and Kidney Diseases, the National Institute of Allergy and Infectious Diseases, and the Eunice Kennedy Shriver National Institute of Child Health and Human Development, through the cooperative agreements U01 DK-061010, U01 DK-061016, U01 DK-061034, U01 DK-061036, U01 DK-061040, U01 DK-061041, U01 DK-061042, U01 DK-061055, U01 DK-061058, U01 DK-084565, U01 DK-085453, U01 DK-085461, U01 DK-085463, U01 DK-085466, U01 DK-085499, U01 DK-085505, and U01 DK-085509, and a contract HHSN267200800019C; the National Center for Research Resources, through Clinical Translational Science Awards UL1 RR-024131, UL1 RR-024139, UL1 RR-024153, UL1 RR-024975, UL1 RR-024982, UL1 RR-025744, UL1 RR-025761, UL1 RR-025780, UL1 RR-029890, and UL1 RR-031986, and General Clinical Research Center Award M01 RR-00400; the Juvenile Diabetes Research Foundation International (JDRF); and the ADA. The contents of this article are solely the responsibility of the authors and do not necessarily represent the official views of the NIH, JDRF, or ADA.
No potential conflicts of interest relevant to this article were reported.
J.M.S. wrote the manuscript. J.S.S., K.C.H., and J.P.P. reviewed the manuscript and contributed to revisions. J.M.S. is the guarantor of this work and, as such, had full access to all the data in the study and takes responsibility for the integrity of the data and the accuracy of the data analysis.
Footnotes
This article contains Supplementary Data online at http://diabetes.diabetesjournals.org/lookup/suppl/doi:10.2337/db11-1660/-/DC1.
REFERENCES
- 1.Gorsuch AN, Spencer KM, Lister J, et al. Evidence for a long prediabetic period in type I (insulin-dependent) diabetes mellitus. Lancet 1981;2:1363–1365 [DOI] [PubMed] [Google Scholar]
- 2.Vardi P, Crisa L, Jackson RA. Predictive value of intravenous glucose tolerance test insulin secretion less than or greater than the first percentile in islet cell antibody positive relatives of type 1 (insulin-dependent) diabetic patients. Diabetologia 1991;34:93–102 [DOI] [PubMed] [Google Scholar]
- 3.Chase HP, Voss MA, Butler-Simon N, Hoops S, O’Brien D, Dobersen MJ. Diagnosis of pre-type I diabetes. J Pediatr 1987;111:807–812 [DOI] [PubMed] [Google Scholar]
- 4.Srikanta S, Ganda OP, Rabizadeh A, Soeldner JS, Eisenbarth GS. First-degree relatives of patients with type I diabetes mellitus. Islet-cell antibodies and abnormal insulin secretion. N Engl J Med 1985;313:461–464 [DOI] [PubMed] [Google Scholar]
- 5.Ginsberg-Fellner F, Witt ME, Franklin BH, et al. Triad of markers for identifying children at high risk of developing insulin-dependent diabetes mellitus. JAMA 1985;254:1469–1472 [PubMed] [Google Scholar]
- 6.Diabetes Prevention Trial-Type 1 Diabetes Study Group Effects of insulin in relatives of patients with type 1 diabetes mellitus. N Engl J Med 2002;346:1685–1691 [DOI] [PubMed] [Google Scholar]
- 7.Skyler JS, Krischer JP, Wolfsdorf J, et al. Effects of oral insulin in relatives of patients with type 1 diabetes: the Diabetes Prevention Trial--Type 1. Diabetes Care 2005;28:1068–1076 [DOI] [PubMed] [Google Scholar]
- 8.Gale EA, Bingley PJ, Emmett CL, Collier T, The European Nicotinamide Diabetes Intervention Trial (ENDIT) Group European Nicotinamide Diabetes Intervention Trial (ENDIT): a randomised controlled trial of intervention before the onset of type 1. Lancet 2004;363:925–931 [DOI] [PubMed] [Google Scholar]
- 9.Triolo TM, Chase HP, Barker JM, DPT-1 Study Group Diabetic subjects diagnosed through the Diabetes Prevention Trial-Type 1 (DPT-1) are often asymptomatic with normal A1C at diabetes onset. Diabetes Care 2009;32:769–773 [DOI] [PMC free article] [PubMed] [Google Scholar]
- 10.Sosenko J, Palmer JP, Greenbaum CJ, et al. Diabetes Prevention Trial-Type 1 Study Group. Patterns of metabolic progression to type 1 diabetes in the Diabetes Prevention Trial-Type 1. Diabetes Care 2006;29:643–649 [DOI] [PubMed] [Google Scholar]
- 11.O’Leary LA, Dorman JS, LaPorte RE, et al. Familial and sporadic insulin-dependent diabetes: evidence for heterogeneous etiologies? Diabetes Res Clin Pract 1991;14:183–190 [DOI] [PubMed] [Google Scholar]
- 12.Komulainen J, Knip M, Lounamaa R, et al. Childhood Diabetes in Finland Study Group Poor beta-cell function after the clinical manifestation of type 1 diabetes in children initially positive for islet cell specific autoantibodies. Diabet Med 1997;14:532–537 [DOI] [PubMed] [Google Scholar]
- 13.Faber OK, Binder C. B-cell function and blood glucose control in insulin dependent diabetics within the first month of insulin treatment. Diabetologia 1977;13:263–268 [DOI] [PubMed] [Google Scholar]
- 14.Sosenko JM, Palmer JP, Rafkin-Mervis L, et al. Diabetes Prevention Trial-Type 1 Study Group. Trends of earlier and later responses of C-peptide to oral glucose challenges with progression to type 1 diabetes in Diabetes Prevention Trial–Type 1 participants. Diabetes Care 2010;33:620–625 [DOI] [PMC free article] [PubMed] [Google Scholar]
- 15.Polonsky KS, Given BD, Hirsch LJ, et al. Abnormal patterns of insulin secretion in non-insulin-dependent diabetes mellitus. N Engl J Med 1988;318:1231–1239 [DOI] [PubMed] [Google Scholar]
- 16. Steele C, Hagopian WA, Gitelman S, et al. Insulin secretion in type 1 diabetes. Diabetes 2004;53:426–433 [DOI] [PubMed] [Google Scholar]
- 17.Barker JM, McFann K, Harrison LC, et al. DPT-1 Study Group Pre-type 1 diabetes dysmetabolism: maximal sensitivity achieved with both oral and intravenous glucose tolerance testing. J Pediatr 2007;150:31–36, e6 [DOI] [PMC free article] [PubMed] [Google Scholar]
- 18.Knip M, Vähäsalo P, Karjalainen J, Lounamaa R, Åkerblom HK, Childhood Diabetes in Finland Study Group Natural history of preclinical IDDM in high risk siblings. Diabetologia 1994;37:388–393 [DOI] [PubMed] [Google Scholar]
- 19.Stene LC, Barriga K, Hoffman M, et al. Normal but increasing hemoglobin A1c levels predict progression from islet autoimmunity to overt type 1 diabetes: Diabetes Autoimmunity Study in the Young (DAISY). Pediatr Diabetes 2006;7:247–253 [DOI] [PubMed] [Google Scholar]
- 20.Rosenbloom AL, Hunt SS, Rosenbloom EK, Maclaren NK. Ten-year prognosis of impaired glucose tolerance in siblings of patients with insulin-dependent diabetes. Diabetes 1982;31:385–387 [DOI] [PubMed] [Google Scholar]
- 21.Tarn AC, Smith CP, Spencer KM, Bottazzo GF, Gale EA. Type I (insulin dependent) diabetes: a disease of slow clinical onset? Br Med J (Clin Res Ed) 1987;294:342–345 [DOI] [PMC free article] [PubMed] [Google Scholar]
- 22.Beer SF, Heaton DA, Alberti KG, Pyke DA, Leslie RD. Impaired glucose tolerance precedes but does not predict insulin-dependent diabetes mellitus: a study of identical twins. Diabetologia 1990;33:497–502 [DOI] [PubMed] [Google Scholar]
- 23.Sosenko JM, Palmer JP, Rafkin-Mervis L, et al. Glucose and C-peptide changes in the perionset period of type 1 diabetes in The Diabetes Prevention Trial-Type 1. Diabetes Care 2008;31:2188–2192 [DOI] [PMC free article] [PubMed] [Google Scholar]
- 24.Ferrannini E, Mari A, Nofrate V, Sosenko JM, Skyler JS, DPT-1 Study Group Progression to diabetes in relatives of type 1 diabetic patients: mechanisms and mode of onset. Diabetes 2010;59:679–685 [DOI] [PMC free article] [PubMed] [Google Scholar]
- 25.Ludvigsson J, Heding LG, Larsson Y, Leander E. C-peptide in juvenile diabetics beyond the postinitial remission period. Relation to clinical manifestation at onset of diabetes, remission and diabetic control. Acta Paediatr Scand 1977;66:177–184 [DOI] [PubMed] [Google Scholar]
- 26.Shah SC, Malone JI, Simpson NE. A randomized trial of intensive insulin therapy in newly diagnosed insulin-dependent diabetes. N Engl J Med 1989;350:550–555 [DOI] [PubMed] [Google Scholar]
- 27.Törn C, Landin-Olsson M, Lernmark A, et al. Prognostic factors for the course of β cell function in autoimmune diabetes. J Clin Endocrinol Metab 2000;85:4619–4623 [DOI] [PubMed] [Google Scholar]
- 28.Herold KC, Hagopian W, Auger JA, et al. Anti-CD3 monoclonal antibody in new-onset type 1 diabetes mellitus. N Engl J Med 2002;346:1692–1698 [DOI] [PubMed] [Google Scholar]
- 29.Ortqvist E, Björk E, Wallensteen M, et al. Temporary preservation of β-cell function by diazoxide treatment in childhood type 1 diabetes. Diabetes Care 2004;27:2191–2197 [DOI] [PubMed] [Google Scholar]
- 30.Brown RJ, Sinaii N, Rother KI. Too much glucagon, too little insulin: time course of pancreatic islet dysfunction in new-onset type 1 diabetes. Diabetes Care 2008;31:1403–1404 [DOI] [PMC free article] [PubMed] [Google Scholar]
- 31.Greenbaum CJ, Anderson AM, Dolan LM, et al. SEARCH Study Group Preservation of beta-cell function in autoantibody-positive youth with diabetes. Diabetes Care 2009;32:1839–1844 [DOI] [PMC free article] [PubMed] [Google Scholar]
- 32.Petrone A, Spoletini M, Zampetti S, et al. The PTPN22 1858T gene variant in type 1 diabetes is associated with reduced residual β-cell function and worse metabolic control. Diabetes Care 2008;31:1214–1218 [DOI] [PubMed] [Google Scholar]
- 33.Sosenko JM, Palmer JP, Rafkin-Mervis L, et al. Diabetes Prevention Trial-Type 1 Study Group. Incident dysglycemia and progression to type 1 diabetes among participants in the Diabetes Prevention Trial-Type 1. Diabetes Care 2009;32:1603–1607 [DOI] [PMC free article] [PubMed] [Google Scholar]
- 34.Sosenko JM, Skyler JS, Krischer JP, et al. Diabetes Prevention Trial-Type 1 Diabetes Study Group. Glucose excursions between states of glycemia with progression to type 1 diabetes in the Diabetes Prevention Trial-Type 1 (DPT-1). Diabetes 2010;59:2386–2389 [DOI] [PMC free article] [PubMed] [Google Scholar]
- 35.Sosenko J, Palmer JP, Greenbaum CJ, et al. the Diabetes Prevention Trial–Type 1 Study Group. Increasing the accuracy of oral glucose tolerance testing and extending its application to individuals with normal glucose tolerance for the prediction of type 1 diabetes. Diabetes Care 2007;30:38–42 [DOI] [PubMed] [Google Scholar]
- 36.Greenbaum CJ. Insulin resistance in type 1 diabetes. Diabetes Metab Res Rev 2002;18:192–200 [DOI] [PubMed] [Google Scholar]
- 37.Xu P, Cuthbertson D, Greenbaum C, Palmer JP, Krischer JP. the Diabetes Prevention Trial–Type 1 Study Group. Role of insulin resistance in predicting progression to type 1 diabetes. Diabetes Care 2007;30:2314–2320 [DOI] [PubMed] [Google Scholar]
- 38.Fourlanos S, Narendran P, Byrnes GB, Colman PG, Harrison LC. Insulin resistance is a risk factor for progression to type 1 diabetes. Diabetologia 2004;47:1661–1667 [DOI] [PubMed] [Google Scholar]
- 39.Mrena S, Virtanen SM, Laippala P, et al. the Childhood Diabetes in Finland Study Group. Models for predicting type 1 diabetes in siblings of affected children. Diabetes Care 2006;29:662–667 [DOI] [PubMed] [Google Scholar]
- 40.Bingley PJ, Mahon JL, Gale EA. the European Nicotinamide Diabetes Intervention Trial (ENDIT) Group. Insulin resistance and progression to type 1 diabetes in the European Nicotinamide Diabetes Intervention Trial (ENDIT). Diabetes Care 2008;31:146–150 [DOI] [PubMed] [Google Scholar]
- 41.Yalow RS, Glick SM, Roth J, Berson SA. Plasma insulin and growth hormone levels in obesity and diabetes. Ann N Y Acad Sci 1965;131:357–373 [DOI] [PubMed] [Google Scholar]
- 42.Bagdade JD, Bierman EL, Porte D., Jr The significance of basal insulin levels in the evaluation of the insulin response to glucose in diabetic and nondiabetic subjects. J Clin Invest 1967;41:1549–1557 [DOI] [PMC free article] [PubMed] [Google Scholar]
- 43.Yki-Yarvinen H, Koivisto VA. Natural course of insulin resistance in type 1 diabetes. N Engl J Med 1986;315:224–230 [DOI] [PubMed] [Google Scholar]
- 44.Martin S, Pawlowski B, Greulich B, Ziegler AG, Mandrup-Poulsen T, Mahon J. Natural course of remission in IDDM during 1st year after diagnosis. Diabetes Care 1992;15:66–74 [DOI] [PubMed] [Google Scholar]
- 45.Sosenko JM, Krischer JP, Palmer JP, et al. Diabetes Prevention Trial-Type 1 Study Group. A risk score for type 1 diabetes derived from autoantibody positive participants in The Diabetes Prevention Trial-Type 1. Diabetes Care 2008;31:528–533 [DOI] [PubMed] [Google Scholar]
- 46.Sosenko JM, Skyler JS, Mahon J, et al. Type 1 Diabetes TrialNet and Diabetes Prevention Trial-Type 1 Study Groups. Validation of the Diabetes Prevention Trial-Type 1 risk score (DPTRS) in the TrialNet Natural History Study. Diabetes Care 2011;34:1785–1787 [DOI] [PMC free article] [PubMed] [Google Scholar]
- 47.Steffes MW, Sibley S, Jackson M, Thomas W. Beta-cell function and the development of diabetes-related complications in the diabetes control and complications trial. Diabetes Care 2003;26:832–836 [DOI] [PubMed] [Google Scholar]
- 48.The Diabetes Control and Complications Trial Research Group Effects of intensive therapy on residual beta-cell function in patients with type 1 diabetes in the Diabetes Control and Complications Trial. A randomized, controlled trial. Ann Intern Med 1998;128:517–523 [DOI] [PubMed] [Google Scholar]
- 49.Pociot F, Ronnigen KS, Bergholdt R, et al. Genetic susceptibility markers in Danish patients with type 1 (insulin-dependent) diabetes evidence for polygenicity in man: Danish Study Group of Diabetes in Childhood. Autoimmunity 1994;19:169–178 [DOI] [PubMed] [Google Scholar]
- 50.Siljander HT, Simell S, Hekkala A, et al. Predictive characteristics of diabetes-associated autoantibodies among children with HLA-conferred disease susceptibility in the general population. Diabetes 2009;58:2835–2842 [DOI] [PMC free article] [PubMed] [Google Scholar]


