

Abstract
A characteristic of the food-borne pathogen Listeria monocytogenes is its tolerance to the harsh conditions found both in minimally processed foods and the human gastrointestinal tract. This trait is partly under the control of the alternative sigma factor sigma B (σB). To study the mechanisms that trigger the activation of σB, and hence the development of stress tolerance, we have developed a fluorescent reporter fusion that allows the real-time activity of σB to be monitored. The reporter, designated Plmo2230::egfp, fuses the strong σB-dependent promoter from the lmo2230 gene (which encodes a putative arsenate reductase) to a gene encoding enhanced green fluorescence protein (EGFP). The reporter was integrated into the genomes of the wild-type strain L. monocytogenes EGD-e as well as two mutant derivatives lacking either sigB or rsbV. The resulting strains were used to study σB activation in response to growth phase and hyperosmotic stress. The wild-type was strongly fluorescent in stationary phase or in cultures with added NaCl and this fluorescence was abolished in both the sigB and rsbV backgrounds, consistent with the σB-dependency of the lmo2230 promoter. During sudden osmotic upshock (addition of 0.5 M NaCl during growth) a real-time increase in fluorescence was observed microscopically, reaching maximal activation after 30 min. Flow cytometry was used to study the activation of σB at a population level by hyperosmotic stress during exponential growth. A strong and proportional increase in fluorescence was observed as the salt concentration increased from 0 to 0.9 M NaCl. Interestingly, there was considerable heterogeneity within the population and a significant proportion of cells failed to induce a high level of fluorescence, suggesting that σB activation occurs stochastically in response to hyperosmotic stress. Thus the Plmo2230::egfp is a powerful tool that will allow the stress response to be better studied in this important human pathogen.
Keywords: Listeria monocytogenes, EGFP, hyperosmotic stress, lmo2230, reporter, RsbV, sigma B
Introduction
The gram positive bacterium Listeria monocytogenes is a facultative intracellular pathogen that is found widely in the environment (reviewed by Barbuddhe, 2009).1 As a foodborne pathogen L. monocytogenes is able to survive and multiply in food during processing and/or storage. Key virulence factors are controlled by the positive regulatory factor A (PrfA) and also by the alternative RNA polymerase sigma factor SigB (σB).2-4 σB is involved in the initiation of transcription by recognizing σB promoter sequences and allowing the expression of a specific set of genes (σB regulon) when the appropriate conditions are encountered. A variety of stress and virulence-related phenotypes are associated with loss of the sigB gene, indicating that σB plays an important role both during infections and under stressful conditions (reviewed by O’Byrne, 2008).5 After the full genome sequence of L. monocytogenes became available6 a number of studies identified components of the σB regulon by looking at genes differentially expressed in L. monocytogenes wild-type and corresponding sigB mutants using proteomic approaches7,8 or gene microarray technology.9-12
The mechanism responsible for sensing stress that leads to the activation of σB has not been fully characterized in L. monocytogenes. However, the signal transduction system controlling σB activity in Bacillus subtilis, has been well studied (reviewed by Hecker, 2007).13 A high level of conservation between the sigB operons in B. subtilis and L. monocytogenes suggests a shared mechanism of post-translational regulation of σB activity. In B. subtilis this mechanism involves partner switching of an anti sigma factor called RsbW between σB and anti-anti sigma factor called RsbV; when RsbW is sequestered by RsbV, σB is free to participate in transcription. In order to test this model and to develop an understanding of how σB is controlled in L. monocytogenes, molecular tools for measuring the activity status of σB in this pathogen are required. Therefore in the present study we aimed to develop an effective reporter for measuring σB activity in L. monocytogenes, which would then allow important questions to be addressed about the conditions that trigger the activation of σB and how this activity is modulated.
A number of transcriptional reporter systems based on bioluminescence and enzymatic assays have been used to study the regulation of transcription and the investigation of promoter activity in L. monocytogenes.14-16 However, the commonly used lacZ, gus or lux reporters are limited by the need for specific cofactors or exogenous substrates. In addition to these considerations we sought a system that could be detectable with multiple methods and not adversely affected by the measurement techniques or growth conditions. Fluorescent reporter systems containing green fluorescent protein (GFP), first described in Aequorea, jellyfish are extensively utilized in a wide range of other organisms including bacteria.17 As measurement of GFP activity in prokaryotes was reported to be affected reversibly by protein oxidation, the pH value of the medium and temperature,18 several chromophore variants of wild-type GFP (wtGFP) have been developed for use as a reporters under a wide range of conditions.19 For a reporter of σB activity the enhanced green fluorescent protein (EGFP) variant was selected, since it demonstrates 35-fold higher fluorescence and is more stable in terms of irreversible quenching and photo-bleaching, making the detection threshold of EGFP much lower than wtGFP.20,21 EGFP has a single, strong red shifted excitation peak at 488 nm which corresponds to the line of FITC optics and line of argon ion lasers used in many flow cytometers. In addition, elimination of the UV excitation enables utilization of EGFP in living cells under less harmful conditions due to lower energies involved in visualization. EGFP folding and chromophore formation is also faster22 and its structure was reported to be stable over osmolarity and temperature ranges.23
One of the key factors in considering a successful reporter of σB activity in L. monocytogenes is the choice of an effective σB-dependent promoter. In the pioneering in vitro studies of sporulation in B. subtilis Haldenwang and Losick (1979)24 used the ctc gene in their transcription assays, which led to the discovery of one of the first bacterial alternative sigma factor, σB. Since then ctc has become the first-choice reporter gene for σB activity studies in B. subtilis, where it has been used to investigate a whole range of different stress stimuli.25-27 The ctc gene, described as being positively regulated by σB in L. monocytogenes,11 was also used in a transcriptomic approach to investigate blue and red light activation of σB in L. monocytogenes.28 The study demonstrated that in a ΔsigB mutant there was still substantial ctc transcript levels, suggesting that in L. monocytogenes ctc transcription is not fully dependent on σB. The sigB gene itself is known to be autoregulated3,29 and has previously been used in L. monocytogenes as a reporter for the role of σB in biofilm formation.30 However, the proposed regulation of transcription of eight-gene sigB operon based on B. subtilis and a transcriptomic study of L. monocytogenes suggest that sigB might also be transcribed in σB-independent manner from the σA promoter located upstream from rsbR and yielding the transcript for the whole operon including rsbRSTU followed by rsbV, rsbW, sigB and rsbX29 or within a 10 gene operon starting upstream from lmo0887.12
Our recently published work evaluated transcript levels of sigB and other σB-dependent genes as a reporter of σB activity.31 Out of four σB-dependent genes investigated (sigB, opuCA, lmo2085, lmo2230), expression of lmo2230, which encodes a putative arsenate reductase, was strongly σB-dependent and demonstrated the highest level of induction following osmotic stress. Selected studies on the σB regulon in various strains of L. monocytogenes over a range of different stress conditions9-11,32-35 have confirmed the high induction and strong σB-dependence of lmo2230 expression. These studies also show that the σB-dependent activation of lmo2230 transcription occurs in different strains and in response to different stresses. The σB promoter sequence of lmo2230 was predicted with Hidden Markov model (HMM)-based searches and its transcriptional start site was confirmed by RACE-PCR.11 lmo2230 (designated as arsC) has been already successfully used among other σB-regulated genes as a reporter of σB activity after exposure to light.28 However, this valuable and quantitative study used expensive and time consuming RNA extractions followed by RT-PCR assays. Here we describe the construction of a reporter fusion utilizing the promoter of lmo2230 to monitor σB-dependent expression that will be quicker and more effective for testing over a wide range of conditions.
Materials and Methods
Bacterial strains, plasmids and growth conditions
The bacterial strains and plasmids used in this study are listed in Table 1. L. monocytogenes strains were grown in Brain Heart Infusion (BHI) broth or agar (LabM) at 37°C unless otherwise stated. Cells were grown under continuous shaking from a starting OD600 = 0.05 to OD600 = 0.6 for exponential phase and up to ~16 h for stationary phase experiments. The volume of the medium occupied no more than 10% of the flask volume to ensure sufficient aeration. Escherichia coli strains used as intermediate vector hosts were grown in Luria Bertani (LB) broth or agar (LabM) at 30°C. Antibiotics were incorporated into the media as follows: Chloramphenicol (Cml) 10 μg ml−1 for L. monocytogenes; Ampicillin (Amp) 100 μg/ml for E. coli.36
Table 1. Plasmids and strains used in this study.
| |
Source or reference |
|---|---|
| PLASMIDS | |
| pKSV7 (pUC18 and pBD95 integrated shuttle vector for E. coli and L. monocytogenes carrying a temperature sensitive oriC from pE194) |
36 |
| pCR®-XL-TOPO® |
Invitrogen™ |
| pEC04 (pCR®-XL-TOPO® containing the ΔrsbV deletion cassette) |
This study |
| pEC06 (pKSV7 containing ΔrsbV DNA deletion cassette) |
This study |
| pBluescriptII-Plmo2230::egfp |
Eurofins MWG Operon |
| pKSV7-Plmo2230::egfp | This study |
| STRAINS | ||
|---|---|---|
| Source or reference | Collection number | |
|
E. coli DH5α/pKSV7 |
N. Freitag |
COB082 |
| One Shot® TOP10 Electrocomp™ E. coli |
Invitrogen™ |
COB267 |
|
E. coli TOP10/pBluescriptII-Plmo2230::egfp |
This study |
COB515 |
|
E. coli TOP10/pKSV7-Plmo2230::egfp |
This study |
COB516 |
|
L. monocytogenes EGD-e |
K. Boor |
COB261 |
|
L. monocytogenes EGD-e ΔsigB |
K. Boor |
COB262 |
|
L. monocytogenes EGD-e/pEC06 |
This study |
COB392 |
|
L. monocytogenes EGD-e::pEC06 |
This study |
COB393 |
|
L. monocytogenes EGD-e ΔrsbV |
This study |
COB411 |
|
L. monocytogenes EGD-e/pKSV7 |
This study |
COB517 |
|
L. monocytogenes EGD-e/pKSV7-Plmo2230::egfp |
This study |
COB476 |
|
L. monocytogenes EGD-e ΔsigB/pKSV7-Plmo2230::egfp |
This study |
COB477 |
|
L. monocytogenes EGD-e ΔrsbV/ pKSV7-Plmo2230::egfp |
This study |
COB498 |
|
L. monocytogenes EGD-e::pKSV7-Plmo2230::egfp |
This study |
COB491 |
|
L. monocytogenes EGD-e ΔsigB::pKSV7-Plmo2230::egfp |
This study |
COB495 |
| L. monocytogenes EGD-e ΔrsbV::pKSV7-Plmo2230::egfp | This study | COB501 |
Construction of a L. monocytogenes EGD-e ΔrsbV mutant
L. monocytogenes EGD-e ΔrsbV mutant was constructed using the splicing by overlap extension (SOEing) PCR technique37 followed by the construction of a shuttle vector containing the ΔrsbV deletion cassette. Primers A, B, C and D (COB385–388) were designed (based on EGD-e sequence published on http://genolist.pasteur.fr/ListiList) to amplify two fragments (AB and CD) of the gene to be deleted (Table 2). Primers A and D were designed to carry an EcoRI restriction endonuclease site at the 5′ end of each primer. Primer C was designed to have its 5′ region complementary to the 3′ region of primer B. The intermediate vector pCR-XL-TOPO® (Invitrogen) was used to generate pEC04 carrying ΔrsbV deletion cassette prepared by SOEing. The ΔrsbV deletion cassette was subcloned into the pKSV7 shuttle vector yielding pEC06. The integration of pEC06 into the L. monocytogenes chromosome was achieved by homologous recombination at 42°C (non permissive for pKSV7 replication) and finally the excision of the shuttle vector containing the wild type gene was obtained. Colonies were then screened for loss of the rsbV gene using PCR using primers COB470 and COB471 (Table 2) to confirm the elimination of rsbV. Primers COB330 and COB331 were used to verify that a fully intact neighbor rsbW gene existed in the ΔrsbV mutant and primers COB332 and COB333 provided similar finding for the sigB gene. Primers COB328 and COB329 were used to verify the rsbV deletion (312bp of 345bp).
Table 2. Primers used in this study.
| Name | Sequence (5′ to 3′) | Anneal (°C) | Collection number |
|---|---|---|---|
| M13-F |
CAGGAAACAGCTATGAC |
50 |
COB162 |
| M13-R |
GTAAAACGACGGCCAG |
50 |
COB163 |
|
rsbV-CACC-F |
CACCATGAATATTAGTATAGAAATAAAAG |
55 |
COB328 |
|
rsbV-his6-R |
TCAATGATGATGATGATGATGTGCATTGTTGCCATTCATTTC |
55 |
COB329 |
|
rsbW-CACC-F |
CACCATGGCAACAATGCATGACAAAATTAC |
55 |
COB330 |
|
rsbW-His6-R |
TCAGTGGTGGTGGATGATGATGGGTTGAGATACTTTTGGC |
55 |
COB331 |
|
sigB-CACC-F |
CACCATGCCAAAAGTATCTCAACCTG |
55 |
COB332 |
|
sigB-His6-R |
TTAATGGTGATGGTGATGGTGCTCCACTTCCTCATTCTG |
55 |
COB333 |
|
rsbV SOE A |
GAATTCGAAGGCTTACCACTGGG |
58 |
COB385 |
|
rsbV SOE B |
CATCACTTCACCCCCATCTAATTTTT |
58 |
COB386 |
|
rsbV SOE C |
GGGGGTGAAGTGATGGTAGAGGGTGAAATGAATGGC |
58 |
COB387 |
|
rsbV SOE D |
GAATTCAGGTTGAGATACTTTTGGC |
58 |
COB388 |
|
PBrsbV-His-F |
CCGAATTCCTTTGAGTTGCATGATGACTTTACGC |
60 |
COB470 |
|
PBrsbV-His-R |
GCGAATTCTCAATGATGATGATGATGAGTGCATTGTTGCC |
60 |
COB471 |
|
lmo2229-F |
GCCTTGTCGCCATCTTTG |
55 |
COB688 |
| egfp-R | GGCCGTTTACATCTCCATC | 55 | COB689 |
Design and construction of Plmo2230::egfp gene fusion strains
The reporter plasmid pKSV7-Plmo2230::egfp (Fig. 1A) was designed to contain a fusion of the σB-dependent promoter region of lmo2230 (located upstream of the start codon based on the full genome sequence for L. monocytogenes EGD-e) with a codon-optimised (with GENEius software) egfp (accession AY192024.1), the gene coding for enhanced green fluorescent protein (EGFP).20 First, egfp was synthesized together with 443 bp sequence of the lmo2230 promoter region upstream from its start codon11 flanked by BamHI and EcoRI restriction sites (together this gene fusion construct was designated Plmo2230::egfp). The gene fusion was synthesized by Eurofins MWG and inserted into pBluescriptII yielding pBluescriptII-Plmo2230::egfp. The Plmo2230::egfp fragment including the BamHI and EcoRI restriction sites was amplified by PCR with Ultra High-Fidelity DNA Polymerase (Agilent Technologies) and M13 primers (Table 2) using pBluescriptII-Plmo2230::egfp as a template. After digestion with BamHI and EcoRI the Plmo2230::egfp fragment was subcloned into pKSV7 using standard methodologies, generating plasmid pKSV7-Plmo2230::egfp. This newly constructed plasmid was transformed into electrocompetent L. monocytogenes EGD-e wild type, ΔsigB and ΔrsbV derivative mutant strains as described earlier.38 The transformants were selected on BHI agar plates containing 10 μg ml−1 of chloramphenicol, kept for 48 h at 30°C.

Figure 1. Design of the reporter plasmid pKSV7-Plmo2230::egfp containing a fusion of the σB–dependent promoter region of lmo2230 with egfp (A). Site-directed integration of the reporter fusion vector into the chromosome of L. monocytogenes EGD-e wild type and derivative integrants (B) occurring at homologous site of lmo2230 promoter region (443 bp) after incubation at 42°C (non-permissive for autonomous plasmid maintenance in L. monocytogenes) in the presence of chloramphenicol selection.
Chromosomal integration of the Plmo2230::egfp reporter fusion
Homologous recombination was utilized to construct recombinant strains of L. monocytogenes EGD-e wild type, ΔsigB and ΔrsbV derivative mutants carrying single copies of the Plmo2230::egfp reporter fusion integrated into the chromosome (Fig. 1B). The integration was achieved by growing the L. monocytogenes cells, electro-transformed with temperature sensitive pKSV7-Plmo2230::egfp vector, on chloramphenicol plates, kept for 48 h at 42°C. At a non-permissive temperature the vector was unable to replicate autonomously and integrated into the Plmo2230 homologous region on the host chromosome. Fast growing colonies were sub-streaked five times onto fresh BHI agar with chloramphenicol, each time for an additional 24 h growth at 42°C. Integration was confirmed using PCR with COB688 and COB689 primers, which bind to defined regions in both the pKSV7-Plmo2230::egfp plasmid and EGD-e genomic DNA (Table 2).
Microscopic quantification of EGFP fluorescence
To visualize fluorescence due to σB-promoter-driven EGFP expression, cells were grown in BHI or BHI supplemented with 0.5 M NaCl under continuous shaking to OD600 = 0.6. Then 1 ml of cells was immediately fixed in 1:1 volume of ice cold 1:1 (v/v) methanol/ethanol mixture for 10 min at -20°C maintaining fluorescence level similar to live cells when observed with microscopy. For quantitative fluorescence, 1 ml of fixed cells was diluted 1:10 by mixing with 9 ml of filter sterilised PBS and then cells were concentrated on 0.2 μm pore, 10 mm diameter, black polycarbonate membrane filters (Millipore). For preliminary analyses, 1 ml of bacterial cells was centrifuged, resuspended in 50 μl of sterile PBS and 5 μl was smeared on the slides for visualization. Phase-contrast and fluorescence microscopy was performed using a Nikon Eclipse E600 microscope with a CCD camera attached for digital photography. Expression of EGFP was visualized at a fixed exposure time of 2 sec in a dark room using the B-2A filter covering GFP wavelengths together with 1/8 Neutral Density filter (ND8) for minimizing EGFP photobleaching. Relative fluorescence intensities and detectable cell counts were reported after automated image processing of multiple fields with ImageJ 1.44 software39 with appropriate manipulations as described by others.40,41 For each experimental condition a minimum of three biological replicates were analyzed and ten randomly selected fields were captured.
Western blot analyses
Proteins were extracted using a sonication-based method38 from 200 ml of stationary cultures grown for 16 h and the concentrations of protein extracts were determined by the RC DC Protein Assay Kit (BioRad). Extracts were normalized to 5 mg ml−1 total protein concentrations and 10 µl of these samples were separated by SDS-PAGE and transferred to a nitrocellulose membrane. Western blot analyses were performed using chicken polyclonal anti-GFP antibody (Abcam) diluted 1:2,000 in 3% w/v skim milk and secondary antibody (HRP conjugated to goat anti-chicken IgY, Promega) diluted 1:20,000 in 3% w/v skim milk. Blots were viewed with a chemiluminescent substrate (SuperSignal® West Pico Chemiluminescent Kit, Pierce) captured in a dark room using a light sensitive film (Amersham Hyperfilm ECL, GE Healthcare).
Flow cytometry (FCM) analysis of the EGFP expressing cells
For FCM analysis of EGFP expression bacterial strains were grown from starting OD600 = 0.05 to OD600 = 0.6 in BHI or BHI supplemented with 0.3 M, 0.6 M, or 0.9 M NaCl. Cells were fixed in 1:1 volume of ice cold 1:1 (v/v) methanol/ethanol mixture for 10 min at -20°C. One ml of fixed cells was then harvested by centrifugation and resuspended in 0.5 ml of PBS. Quantification of single cell fluorescence was achieved by FCM analysis of 100 μl of the suspension with a BD Accuri C6 flow cytometer (Accuri Cytometers, Inc.) using the following instrument settings: 488 nm blue laser excitation, FL1 533/30 nm (e.g., FITC/GFP) emission channel and fast 66 µL/min flow rate from 96 round bottom plates (Sarstedt) and a minimum of 100,000 events for each sample recorded. The data collected were processed with BD CFlow® software to determine mean fluorescence values and plot side scatter and forward scatter values for two biological and three technical replicates.
Results
A Plmo2230::egfp reporter fusion generates strongly σB-dependent fluorescence
A fusion construct consisting of 443 bp of the lmo2230 promoter region upstream from the egfp gene was synthesized and sub-cloned into pKSV7, generating a reporter plasmid designated pKSV7-Plmo2230::egfp. This plasmid was then transformed into L. monocytogenes EGD-e (wild-type) as well as ΔsigB and ΔrsbV mutant derivatives of this strain. These transformants were investigated by fluorescent microscopy to determine whether EGFP was expressed in the three strains grown for 16 h in brain heart infusion (BHI) broth at 37°C. EGD-e wild-type cells harboring the pKSV7-Plmo2230::egfp plasmid were brightly fluorescent, although considerable heterogeneity in the level of EGFP fluorescence could be observed in the population (Fig. 2). Analysis of randomly selected microscopic fields with phase contrast and fluorescence microscopy suggests that some portion of wild-type cells transformed with pKSV7-Plmo2230::egfp were non-fluorescent or might express EGFP at a level not detectable with this method. In contrast to the wild-type, the ΔsigB mutant strain carrying pKSV7-Plmo2230::egfp showed no fluorescence, suggesting that σB is necessary for activation of egfp expression from the lmo2230 promoter. Furthermore, the ΔrsbV strain harbouring this plasmid was also non-fluorescent, which is consistent with the proposed role of RsbV as an anti-anti sigma factor; in the absence of RsbV σB remains permanently sequestered by RsbW and is therefore unavailable to drive transcription from σB promoters.

Figure 2. Fluorescence of egfp-containing cells of L. monocytogenes EGD-e wild type, ΔsigB and ΔrsbV mutants after transformation with pKSV7-Plmo2230::egfp. Phase-contrast and fluorescence microscopy of corresponding fields were performed after 1 ml of stationary phase culture was centrifuged, resuspended in 50 μl of sterile PBS and 5 μl was smeared on the slides for visualization. Images are representative of a minimum of ten randomly selected fields captured for three biological replicates for each strain.
To check if the lack of fluorescence of ΔsigB, and ΔrsbV strains bearing the reporter plasmid was due to a detection limit of fluorescent microscopy we looked at egfp expression at the protein level. Western blotting using an anti-GFP antibody was performed on stationary cell extracts from wild-type, ΔsigB, and ΔrsbV strains. EGFP was found to be expressed in wild-type only and neither full-length EGFP nor any indication of degraded protein bands were observed in the ΔsigB (Fig. 3A), and the ΔrsbV strains (Fig. 3B). These findings confirmed σB-dependent expression of EGFP and also indicated an absence of RsbV-independent activation of σB under the conditions investigated.

Figure 3. EGFP is expressed of L. monocytogenes EGD-e wild type but not in ΔsigB and ΔrsbV backgrounds. Western blot analyses were performed using protein extracts from stationary phase cultures (normalized to 5 mg ml−1 total protein concentrations and 10 µl of these samples separated by SDS-PAGE) with chicken polyclonal anti-GFP antibody (Abcam) HRP-conjugated goat anti-chicken antibody (Promega) and chemiluminescent detection.
Quantification of lmo2230-promoter-driven expression with fluorescent microscopy
In order to eliminate any artifacts that might be associated with a multi-copy plasmid-based reporter fusion (e.g., variable copy number or effects of antibiotics used for maintenance) the reporter fusion vector (Fig. 1A) was integrated into the genomes of L. monocytogenes EGD-e wild type, ΔsigB and ΔrsbV strains by homologous recombination (Fig. 1B). Microscopic comparison of wild type cells carrying either a chromosomal copy or a plasmid copy of the reporter fusion did not show a distinguishable difference in fluorescence (data not shown). As expected the ΔsigB and ΔrsbV integrants were not fluorescent. Integrant strains bearing single chromosomal copies of egfp could be grown without the need for chloramphenicol selection and consequently were more stable than plasmid bearing transformants, which required selection for plasmid maintenance.
It was possible to quantify the relative fluorescence levels in cultures growing under different experimental conditions using fluorescent microscopy and image analysis (Fig. 4). This method was based on detection of fluorescent cells using algorithms for automatic edge detection of bacteria, background subtraction and counting of the objects (Fig. 4B) and subsequently determining the mean fluorescent intensity of the objects detected (Fig. 4C). To evaluate this approach we examined the wild-type integrant strain in the presence of salt stress (0.5 M NaCl) and in stationary phase, conditions that σB is known to be activated by, and under which EGFP structure and its fluorescence are stable.23 As expected EGFP expression was increased by salt in exponential phase and a higher fluorescence was observed in stationary phase when compared with the exponential phase of growth (Fig. 4). The salt induction in exponential phase could be visually observed in randomly selected microscopic fields (Fig. 4A; n ≥ 30) and was further demonstrated by quantifying the number of fluorescent objects detected (Fig. 4B) and their relative fluorescence (Fig. 4C). However, the activation of σB by salt was not found to be statistically significant in stationary phase (Fig. 4C). Cells grown up to stationary phase of growth (~16 h) were more fluorescent than exponentially growing cells regardless of the salt addition. Thus the ability of the Plmo2230::egfp fusion to act as a reporter of σB activity is not adversely affected by genome integration.

Figure 4. σB -dependent expression of EGFP is increased in L. monocytogenes EGD-e wild-type integrant in stationary phase and by osmotic stress. Cells of integrants bearing Plmo2230::egfp fusion were grown from starting OD600 = 0.05 up to either exponential (OD600 = 0.6) or stationary phase (16 h) in BHI or BHI supplemented with 0.5 M NaCl. A similar number of cells (equivalent to 1 ml of OD600 = 0.6 and diluted 1:2 by the fixing procedure) was diluted 1:10 in PBS and concentrated on 10 mm diameter, 0.2 μm pore polycarbonate membrane (Millipore) by filtration. For each experimental condition three biological replicates were analyzed and a minimum ten randomly selected fields of each membrane were captured with a CCD camera attached to Nikon Eclipse E600 with B-2A and ND8 filters used at a fixed exposure time of 2 sec with representative fields shown (A). Fluorescence levels of cells were quantified with automated image processing of microscopic fields by counting numbers of detectable particles (B) and their relative fluorescence intensities (C) with ImageJ 1.44 software with appropriate manipulations as described by others.39,40
Activation of σB is rapid after osmotic upshock
To determine whether our reporter system is able to detect quick changes of σB activity reported by earlier studies,31,32 the relative fluorescence was investigated after osmotic upshock. In contrast to steady-state growth experiments, cells were grown without NaCl supplementation up to OD600 = 0.6 then osmotically shocked by addition of solid NaCl (0.5 M) and samples were taken at suitable intervals from vigorously shaken cultures for microscopic observation (Fig. 5A) and fluorescence intensity quantification (Fig. 5B). A statistically significant increase (p < 0.05, Student's t-test) of relative fluorescence between osmotically shocked and untreated culture was observed from 10 min after the upshock (Fig. 5B). The reporter approach demonstrated an induction of σB activity with the highest variability up to 20 min after salt addition and then stable fluorescence subsequent to 30 min after treatment. Together these results show that a chromosomally integrated Plmo2230::egfp reporter fusion can reliably detect a rapid activation of σB following osmotic upshock.

Figure 5. σB -dependent EGFP expression is induced after osmotic upshock in L. monocytogenes EGD-e wild-type Plmo2230::egfp integrant. Cells bearing Plmo2230::egfp fusion grown in BHI from OD600 = 0.05 up to OD600 = 0.6 when 0.5 M NaCl was added. Similar number of cells (equivalent to 1 ml of OD600 = 0.6 and diluted 1:2 by the fixing procedure) was taken at appropriate intervals from untreated and osmotically shocked cultures. Fixed cells were diluted 1:10 in PBS and concentrated on 10 mm diameter, 0.2 μm pore polycarbonate membrane (Millipore) by filtration. For each experimental condition three biological replicates were analyzed and a minimum of ten randomly selected fields were captured with a CCD camera attached to Nikon Eclipse E600 with B-2A and ND8 filters were used at a fixed exposure time of 2 s with representative fields shown (A). Fluorescence levels of cells were quantified with automated image processing of captured microscopic fields by counting relative fluorescence intensities (B) with ImageJ 1.44 software with appropriate manipulations as described by others.39,40
Flow cytometry reveals heterogeneous activation of σB in the population
Digital image processing is cheap and straight forward but also time-consuming especially in terms of the investigation of multiple experimental conditions or for determining the proportion of the population that is fluorescent. For a more automated analysis of cells expressing EGFP flow cytometry (FCM) was utilized and evaluated in cultures with increasing concentrations of salt. FCM allows individual cells to be analyzed whereas other methods give average data for the whole population. When wild-type cells without a reporter fusion were analyzed by FCM the population was found to have a low level of intrinsic fluorescence (autofluorescence). This “background” fluorescence level was used to define the gate range used to detect EGFP expressing cells. When the wild-type Plmo2230::egfp fusion strain was analyzed, following aerobic growth to exponential phase (OD600 = 0.6) at 37°C, 27.8% of the particles detected had fluorescence levels that fell within the defined gate (Fig. 6). When a FCM analysis was performed on a culture of the ΔsigB mutant grown under the same conditions, no significant fluorescence was detected above the background level, indicating that σB was responsible for any EGFP expression detected in the wild type. When cultures were grown under conditions of hyperosmotic stress (NaCl concentrations of 0.3, 0.6 or 0.9 M) the wild-type reporter strain showed a clear increase in the proportion of cells that were expressing EGFP, while no EGFP expression was detected in the ΔsigB mutant (Fig. 6). The proportion of cells expressing EGFP more than doubled as the NaCl concentration increased from 0 to 0.9 M, reaching 62.2% of the population at 0.9 M NaCl. The data presented are in line with our previous transcriptomic reports of σB activity being proportional to the extent of NaCl stress.31
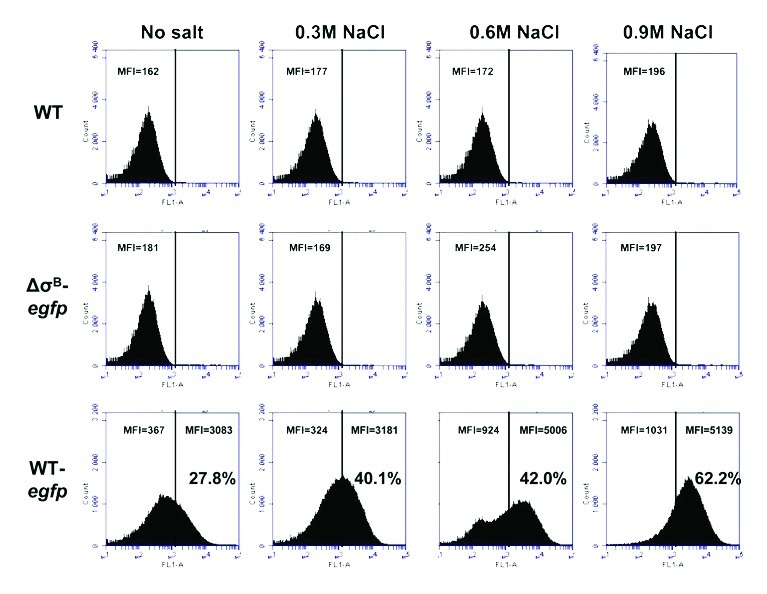
Figure 6. Heterogeneity of fluorescence within EGFP-expressing population and σB activation proportional to the extent of osmotic stress was revealed with FCM. Cells of parent wild-type strain (WT), wild-type-Plmo2230::egfp (WT-egfp) and ΔsigB-Plmo2230::egfp (ΔσB-egfp) derivative strains were grown from a starting OD600 = 0.05 up to OD600 = 0.6 in BHI (no salt) or BHI supplemented with 0.3 M, 0.6 M or 0.9 M NaCl. FCM was performed using BD Accuri C6 flow cytometer on fixed cells (concentration equivalent to 1 ml of OD600 = 0.6, fixed and resuspended in sterile PBS) for three technical replicates of two biological replicates for each strain and each experimental condition. Levels of intrinsic fluorescence (autofluorescence) were determined for wild-type cells without a reporter fusion (WT) and were used to define the gate range of EGFP expressing wild-type-egfp strain population. Mean fluorescence intensities (MFI) for egfp gate and particles located outside the gate (autofluorescence) were calculated by BD CFlow® software.
The heterogeneity of fluorescence within the wild-type EGFP expressing population was significant; with ~38% of the population exposed to 0.9 M NaCl failing to induce fluorescence levels that fell within the predetermined gate (Fig. 6A). The gate was determined by defining the limit of autofluorescence of wild-type L. monocytogenes. However it was clear that there was an increase in the level of autofluorescence when cells were exposed to 0.9 M NaCl and that increase was σB-dependent (Fig. 6). This result indicates that there is some overlap between cellular autofluorescence and EGFP fluorescence and also shows that the range of σB activities within the population is considerable. The heterogeneity of σB activities within the population exposed to hyperosmotic stress raises new and interesting questions about how individual cells sense and respond to osmotic stress.
Discussion
In the present study, we developed a rapid EGFP-based reporter assay for measuring σB activity in L. monocytogenes. The system was carefully designed based on available literature to have the strong σB-dependent promoter of lmo2230, which ensured that cells were highly fluorescent following the activation of σB. The reporter approach showed increased σB activity in stationary phase and during hyperosmotic stress, which was applied either continuously or suddenly. Furthermore, an analysis by flow cytometry revealed that σB activation was heterogeneous in the population and proportional to the extent of stress. The σB-dependency of the reporter fusion was confirmed since strains lacking either the sigB or rsbV genes failed to induce EGFP expression under any condition tested. Together the data presented here demonstrate that the Plmo2230::egfp reporter is a useful tool that can be used to investigate the conditions and mechanisms that trigger the activation of σB in L. monocytogenes.
Expression of lmo2230 was shown to be rapid and transient both after heat shock at 48°C, with a 10-fold induction observed after 3 min of heat stress32 and also 15 min after osmotic upshock when more than 160-fold higher levels of lmo2230 in wild-type were reported comparing to unstressed cells at time zero.31 Taken together these findings give an opportunity for monitoring activation of σB in real time by following lmo2230-promoter-driven expression after a sudden change of environmental conditions. However, there are also some limitations in terms of reporting transient activation of σB with the EGFP-based reporter system caused by the high stability of the fluorescent protein under most of the experimental conditions. The long half-life of EGFP (estimated at greater than 24 h)42 makes it impossible to observe a drop in σB activity after the removal of stress, while this decrease can be demonstrated by monitoring the transcript levels of lmo2230 and other σB-regulated genes under similar conditions31 and after heat shock.32 Future versions of this reporter could include less stable GFP variants (with ssrA RNA tags recognized by housekeeping proteases)42 in order to overcome this limitation. When the time scale for σB activation was compared between the RNA based approach described earlier31 and the Plmo2230::egfp reporter (Fig. 5B), the maximal σB activation was evident approximately 15 min earlier when monitoring mRNA levels. It seems likely that this lag observed with microscopy is due to the time required for EGFP translation, protein folding and the chromophore maturation process.19,43 Overall, despite limitations related to the stability and maturation of EGFP, this reporter system should prove very useful for applications that require knowledge about the induction of σB activity in response to stress.
Another unique advantage of the Plmo2230::egfp reporter is that σB activation can be studied both at the single cell and the population levels, using microscopy and flow cytometry. Using these approaches heterogeneity of the population and stochastic cell-to-cell variability of gene expression in L. monocytogenes can be studied in response to strictly defined stimuli. The flow cytometry data presented here indicate that cells from the same vigorously shaken liquid culture exhibit significant differences in fluorescence intensities (Fig. 6). This result indicates that σB activation does not occur uniformly in the population and further suggests that not all cells may perceive osmotic stress in the same way. Phenotypic variations in clonal populations have been investigated in other bacteria and partly explained by fluctuations in the amount of cellular components together with the noise and the asynchrony in gene expression.44 It will be interesting in future studies to determine whether cell-cell differences in σB activation influences the survival of individual cells in foods or within the gastrointestinal tract.45
In an ΔrsbV background no EGFP expression was detected from the Plmo2230::egfp reporter (Figs. 2 and 3B), consistent with the current model for σB activation, which proposes that RsbV acts as an anti-anti-sigma factor that facilitates σB activation when it interacts with the anti-sigma factor RsbW.13 Indeed there is genetic data from L. monocytogenes 10403S to support this model; rsbV and sigB mutants are found to have essentially the same phenotype, suggesting that RsbV is required for σB activation.46 This highlights the potential use of the Plmo2230::egfp reporter in conducting studies on the regulation of σB. A key question that remains to be answered concerns the nature of the stress sensing mechanism. In B. subtilis a high molecular weight (~2MDa) sensory organelle called a stressosome is involved in sensing although the mechanism has not yet been elucidated. Stressosomes are also likely to exist in L. monocytogenes, since homologs of all of the B. subtilis stressosome proteins are present in the genome, but their existence has not yet been established experimentally. By making targeted mutations in the predicted components of the stressosome it should be possible to use the Plmo2230::egfp reporter to determine which components are required for stress sensing and σB activation.
In summary, the Plmo2230::egfp fusion was developed and shown to be a reliable indicator of σB activity in L. monocytogenes, both during different phases of growth and under conditions of hyperosmotic stress. The tight σB-dependence of this promoter combined with the simplicity of detecting GFP fluorescence means that this reporter can be used for many applications in the study of the stress responses of this important food-borne pathogen.
Acknowledgments
We thank our colleagues in Microbiology and the Bacterial Stress Response Group for useful discussions. We thank N. Freitag for supplying plasmid pKSV7. This work was supported by a Science Foundation Ireland Research Frontiers Programme grant (05/RFP/GEN0044) and by Irish Research Council for Science, Engineering and Technology EMBARK funding together with Thomas Crawford Hayes award to M.U. C.B. and R.C. were supported by Science Foundation Ireland grant SRC 09/SRC/B1794 and by a Science Foundation Ireland Stokes Professorship to R.C.
Disclosure of Potential Conflicts of Interest
No potential conflicts of interest were disclosed.
Footnotes
Previously published online: www.landesbioscience.com/journals/biobugs/article/19476
References
- 1.Barbuddhe SB, Chakraborty T. Listeria as an enteroinvasive gastrointestinal pathogen. Curr Top Microbiol Immunol. 2009;337:173–95. doi: 10.1007/978-3-642-01846-6_6. [DOI] [PubMed] [Google Scholar]
- 2.Milohanic E, Glaser P, Coppe´e JY, Frangeul L, Vega Y, V´zquez-Boland JA, et al. Transcriptome analysis of Listeria monocytogenes identifies three groups of genes differently regulated by PrfA. Mol Microbiol. 2003;47:1613–25. doi: 10.1046/j.1365-2958.2003.03413.x. [DOI] [PubMed] [Google Scholar]
- 3.Rauch M, Luo Q, Müller-Altrock S, Goebel W. SigB-dependent in vitro transcription of prfA and some newly identified genes of Listeria monocytogenes whose expression is affected by PrfA in vivo. J Bacteriol. 2005;187:800–4. doi: 10.1128/JB.187.2.800-804.2005. [DOI] [PMC free article] [PubMed] [Google Scholar]
- 4.Ollinger J, Wiedmann M, Boor KJ. SigmaB- and PrfA-dependent transcription of genes previously classified as putative constituents of the Listeria monocytogenes PrfA regulon. Foodborne Pathog Dis. 2008;5:281–93. doi: 10.1089/fpd.2008.0079. [DOI] [PMC free article] [PubMed] [Google Scholar]
- 5.O’Byrne CP, Karatzas KA. The role of sigma B (sigma B) in the stress adaptations of Listeria monocytogenes: overlaps between stress adaptation and virulence. Adv Appl Microbiol. 2008;65:115–40. doi: 10.1016/S0065-2164(08)00605-9. [DOI] [PubMed] [Google Scholar]
- 6.Glaser P, Frangeul L, Buchrieser C, Rusniok C, Amend A, Baquero F, et al. Comparative genomics of Listeria species. Science. 2001;294:849–52. doi: 10.1126/science.1063447. [DOI] [PubMed] [Google Scholar]
- 7.Wemekamp-Kamphuis HH, Wouters JA, de Leeuw PP, Hain T, Chakraborty T, Abee T. Identification of sigma factor sigma B-controlled genes and their impact on acid stress, high hydrostatic pressure, and freeze survival in Listeria monocytogenes EGD-e. Appl Environ Microbiol. 2004;70:3457–66. doi: 10.1128/AEM.70.6.3457-3466.2004. [DOI] [PMC free article] [PubMed] [Google Scholar]
- 8.Abram F, Su WL, Wiedmann M, Boor KJ, Coote P, Botting C, et al. Proteomic analyses of a Listeria monocytogenes mutant lacking sigmaB identify new components of the sigmaB regulon and highlight a role for sigmaB in the utilization of glycerol. Appl Environ Microbiol. 2008;74:594–604. doi: 10.1128/AEM.01921-07. [DOI] [PMC free article] [PubMed] [Google Scholar]
- 9.Raengpradub S, Wiedmann M, Boor KJ. Comparative analysis of the sigma B-dependent stress responses in Listeria monocytogenes and Listeria innocua strains exposed to selected stress conditions. Appl Environ Microbiol. 2008;74:158–71. doi: 10.1128/AEM.00951-07. [DOI] [PMC free article] [PubMed] [Google Scholar]
- 10.Hain T, Hossain H, Chatterjee SS, Machata S, Volk U, Wagner S, et al. Temporal transcriptomic analysis of the Listeria monocytogenes EGD-e sigmaB regulon. BMC Microbiol. 2008;8:20. doi: 10.1186/1471-2180-8-20. [DOI] [PMC free article] [PubMed] [Google Scholar]
- 11.Kazmierczak MJ, Mithoe SC, Boor KJ, Wiedmann M. Listeria monocytogenes sigma B regulates stress response and virulence functions. J Bacteriol. 2003;185:5722–34. doi: 10.1128/JB.185.19.5722-5734.2003. [DOI] [PMC free article] [PubMed] [Google Scholar]
- 12.Toledo-Arana A, Dussurget O, Nikitas G, Sesto N, Guet-Revillet H, Balestrino D, et al. The Listeria transcriptional landscape from saprophytism to virulence. Nature. 2009;459:950–6. doi: 10.1038/nature08080. [DOI] [PubMed] [Google Scholar]
- 13.Hecker M, Pane´-Farre´ J, Völker U. SigB-dependent general stress response in Bacillus subtilis and related gram-positive bacteria. Annu Rev Microbiol. 2007;61:215–36. doi: 10.1146/annurev.micro.61.080706.093445. [DOI] [PubMed] [Google Scholar]
- 14.Shin JH, Brody MS, Price CW. Physical and antibiotic stresses require activation of the RsbU phosphatase to induce the general stress response in Listeria monocytogenes. Microbiology. 2010;156:2660–9. doi: 10.1099/mic.0.041202-0. [DOI] [PMC free article] [PubMed] [Google Scholar]
- 15.Riedel CU, Monk IR, Casey PG, Morrissey D, O’Sullivan GC, Tangney M, et al. Improved luciferase tagging system for Listeria monocytogenes allows real-time monitoring in vivo and in vitro. Appl Environ Microbiol. 2007;73:3091–4. doi: 10.1128/AEM.02940-06. [DOI] [PMC free article] [PubMed] [Google Scholar]
- 16.Ferreira A, Sue D, O’Byrne CP, Boor KJ. Role of Listeria monocytogenes sigma(B) in survival of lethal acidic conditions and in the acquired acid tolerance response. Appl Environ Microbiol. 2003;69:2692–8. doi: 10.1128/AEM.69.5.2692-2698.2003. [DOI] [PMC free article] [PubMed] [Google Scholar]
- 17.Southward CM, Surette MG. The dynamic microbe: green fluorescent protein brings bacteria to light. Mol Microbiol. 2002;45:1191–6. doi: 10.1046/j.1365-2958.2002.03089.x. [DOI] [PubMed] [Google Scholar]
- 18.Hansen MC, Palmer RJ, Jr., Udsen C, White DC, Molin S. Assessment of GFP fluorescence in cells of Streptococcus gordonii under conditions of low pH and low oxygen concentration. Microbiology. 2001;147:1383–91. doi: 10.1099/00221287-147-5-1383. [DOI] [PubMed] [Google Scholar]
- 19.Cubitt AB, Heim R, Adams SR, Boyd AE, Gross LA, Tsien RY. Understanding, improving and using green fluorescent proteins. Trends Biochem Sci. 1995;20:448–55. doi: 10.1016/S0968-0004(00)89099-4. [DOI] [PubMed] [Google Scholar]
- 20.Heim R, Cubitt AB, Tsien RY. Improved green fluorescence. Nature. 1995;373:663–4. doi: 10.1038/373663b0. [DOI] [PubMed] [Google Scholar]
- 21.Patterson GH, Knobel SM, Sharif WD, Kain SR, Piston DW. Use of the green fluorescent protein and its mutants in quantitative fluorescence microscopy. Biophys J. 1997;73:2782–90. doi: 10.1016/S0006-3495(97)78307-3. [DOI] [PMC free article] [PubMed] [Google Scholar]
- 22.Iizuka R, Funatsu T, Uemura S. Real-time single-molecule observation of green fluorescent protein synthesis by immobilized ribosomes. Methods Mol Biol. 2011;778:215–28. doi: 10.1007/978-1-61779-261-8_14. [DOI] [PubMed] [Google Scholar]
- 23.Gerena-Lo´pez Y, Nolan J, Wang L, Gaigalas A, Schwartz A, Fern´ndez-Repollet E. Quantification of EGFP expression on Molt-4 T cells using calibration standards. Cytometry A. 2004;60:21–8. doi: 10.1002/cyto.a.20019. [DOI] [PubMed] [Google Scholar]
- 24.Haldenwang WG, Losick R. A modified RNA polymerase transcribes a cloned gene under sporulation control in Bacillus subtilis. Nature. 1979;282:256–60. doi: 10.1038/282256a0. [DOI] [PubMed] [Google Scholar]
- 25.Benson AK, Haldenwang WG. Regulation of sigma B levels and activity in Bacillus subtilis. J Bacteriol. 1993;175:2347–56. doi: 10.1128/jb.175.8.2347-2356.1993. [DOI] [PMC free article] [PubMed] [Google Scholar]
- 26.Brigulla M, Hoffmann T, Krisp A, Völker A, Bremer E, Völker U. Chill induction of the SigB-dependent general stress response in Bacillus subtilis and its contribution to low-temperature adaptation. J Bacteriol. 2003;185:4305–14. doi: 10.1128/JB.185.15.4305-4314.2003. [DOI] [PMC free article] [PubMed] [Google Scholar]
- 27.Pr´gai Z, Harwood CR. Regulatory interactions between the Pho and sigma(B)-dependent general stress regulons of Bacillus subtilis. Microbiology. 2002;148:1593–602. doi: 10.1099/00221287-148-5-1593. [DOI] [PubMed] [Google Scholar]
- 28.Ondrusch N, Kreft J. Blue and red light modulates SigB-dependent gene transcription, swimming motility and invasiveness in Listeria monocytogenes. PLoS One. 2011;6:e16151. doi: 10.1371/journal.pone.0016151. [DOI] [PMC free article] [PubMed] [Google Scholar]
- 29.Becker LA, Cetin MS, Hutkins RW, Benson AK. Identification of the gene encoding the alternative sigma factor sigmaB from Listeria monocytogenes and its role in osmotolerance. J Bacteriol. 1998;180:4547–54. doi: 10.1128/jb.180.17.4547-4554.1998. [DOI] [PMC free article] [PubMed] [Google Scholar]
- 30.van der Veen S, Abee T. Importance of SigB for Listeria monocytogenes static and continuous-flow biofilm formation and disinfectant resistance. Appl Environ Microbiol. 2010;76:7854–60. doi: 10.1128/AEM.01519-10. [DOI] [PMC free article] [PubMed] [Google Scholar]
- 31.Utratna M, Shaw I, Starr E, O’Byrne CP. Rapid, transient, and proportional activation of σB in response to osmotic stress in Listeria monocytogenes. Appl Environ Microbiol. 2011;77:7841–5. doi: 10.1128/AEM.05732-11. [DOI] [PMC free article] [PubMed] [Google Scholar]
- 32.van der Veen S, Hain T, Wouters JA, Hossain H, de Vos WM, Abee T, et al. The heat-shock response of Listeria monocytogenes comprises genes involved in heat shock, cell division, cell wall synthesis, and the SOS response. Microbiology. 2007;153:3593–607. doi: 10.1099/mic.0.2007/006361-0. [DOI] [PubMed] [Google Scholar]
- 33.Chan YC, Boor KJ, Wiedmann M. SigmaB-dependent and sigmaB-independent mechanisms contribute to transcription of Listeria monocytogenes cold stress genes during cold shock and cold growth. Appl Environ Microbiol. 2007;73:6019–29. doi: 10.1128/AEM.00714-07. [DOI] [PMC free article] [PubMed] [Google Scholar]
- 34.Chaturongakul S, Boor KJ. SigmaB activation under environmental and energy stress conditions in Listeria monocytogenes. Appl Environ Microbiol. 2006;72:5197–203. doi: 10.1128/AEM.03058-05. [DOI] [PMC free article] [PubMed] [Google Scholar]
- 35.Oliver HF, Orsi RH, Ponnala L, Keich U, Wang W, Sun Q, et al. Deep RNA sequencing of L. monocytogenes reveals overlapping and extensive stationary phase and sigma B-dependent transcriptomes, including multiple highly transcribed noncoding RNAs. BMC Genomics. 2009;10:641. doi: 10.1186/1471-2164-10-641. [DOI] [PMC free article] [PubMed] [Google Scholar]
- 36.Smith K, Youngman P. Use of a new integrational vector to investigate compartment-specific expression of the Bacillus subtilis spoIIM gene. Biochimie. 1992;74:705–11. doi: 10.1016/0300-9084(92)90143-3. [DOI] [PubMed] [Google Scholar]
- 37.Horton RM, Cai ZL, Ho SN, Pease LR. Gene splicing by overlap extension: tailor-made genes using the polymerase chain reaction. Biotechniques. 1990;8:528–35. [PubMed] [Google Scholar]
- 38.Abram F, Starr E, Karatzas KA, Matlawska-Wasowska K, Boyd A, Wiedmann M, et al. Identification of components of the sigma B regulon in Listeria monocytogenes that contribute to acid and salt tolerance. Appl Environ Microbiol. 2008;74:6848–58. doi: 10.1128/AEM.00442-08. [DOI] [PMC free article] [PubMed] [Google Scholar]
- 39.Collins TJ. ImageJ for microscopy. Biotechniques. 2007;43(Suppl):25–30. doi: 10.2144/000112517. [DOI] [PubMed] [Google Scholar]
- 40.Hamilton N. Quantification and its applications in fluorescent microscopy imaging. Traffic. 2009;10:951–61. doi: 10.1111/j.1600-0854.2009.00938.x. [DOI] [PubMed] [Google Scholar]
- 41.Selinummi J, Seppälä J, Yli-Harja O, Puhakka JA. Software for quantification of labeled bacteria from digital microscope images by automated image analysis. Biotechniques. 2005;39:859–63. doi: 10.2144/000112018. [DOI] [PubMed] [Google Scholar]
- 42.Andersen JB, Sternberg C, Poulsen LK, Bjorn SP, Givskov M, Molin S. New unstable variants of green fluorescent protein for studies of transient gene expression in bacteria. Appl Environ Microbiol. 1998;64:2240–6. doi: 10.1128/aem.64.6.2240-2246.1998. [DOI] [PMC free article] [PubMed] [Google Scholar]
- 43.Sniegowski JA, Lappe JW, Patel HN, Huffman HA, Wachter RM. Base catalysis of chromophore formation in Arg96 and Glu222 variants of green fluorescent protein. J Biol Chem. 2005;280:26248–55. doi: 10.1074/jbc.M412327200. [DOI] [PubMed] [Google Scholar]
- 44.Elowitz MB, Levine AJ, Siggia ED, Swain PS. Stochastic gene expression in a single cell. Science. 2002;297:1183–6. doi: 10.1126/science.1070919. [DOI] [PubMed] [Google Scholar]
- 45.Booth IR. Stress and the single cell: intrapopulation diversity is a mechanism to ensure survival upon exposure to stress. Int J Food Microbiol. 2002;78:19–30. doi: 10.1016/S0168-1605(02)00239-8. [DOI] [PubMed] [Google Scholar]
- 46.Chaturongakul S, Boor KJ. RsbT and RsbV contribute to sigmaB-dependent survival under environmental, energy, and intracellular stress conditions in Listeria monocytogenes. Appl Environ Microbiol. 2004;70:5349–56. doi: 10.1128/AEM.70.9.5349-5356.2004. [DOI] [PMC free article] [PubMed] [Google Scholar]