

Abstract
In this short review article I will summarize the path we took over the years towards increasing the spatial resolution of fMRI. To fully capitalize on the fMRI technique, a better understanding of the origin of the hemodynamic signals, and what factors are governing their spatial control is necessary. Here, I will briefly describe the studies and developments that ultimately led to our successful effort in mapping orientation columns in humans that is considered by many as the current state-of-the-art for fMRI studies.
Keywords: high-resolution fMRI, orientation columns, cortical layers, high-field, vascular imaging
Introduction to functional neuroimaging
My personal interest in high-resolution fMRI started years earlier when I was doing my PhD work with Robert (Bob) Harrison at the University of Toronto during the second half of 1990s. Bob Harrison’s lab was mapping frequency representation (“tonotopic organization”) in animal models using the classical electrophysiological approach, which was a tedious and extremely slow process. During that time, optical imaging of intrinsic signals was introduced to the neuroscience community in which enabled one to map a cortical region in a fraction of the time. Bob used to joke that “I was looking for ways to get home earlier…” So for my PhD thesis I was to apply this new technology and map the tonotopic organization of the auditory cortex using optical imaging, which hadn’t been done until then (Harel et al., 2000).
A question that always came up with hemodynamic-based mapping methods was: “what is the spatial resolution that these blood-flow mapping techniques can achieve?” To address this, and to be in a position to fully utilize these techniques, one needs to have a better understanding of where these signals are originating and what factors are governing these hemodynamic signals.
All hemodynamic-based functional brain imaging techniques, such as optical imaging of intrinsic signals and fMRI, rely on the apparent close coupling between neuronal activity and local changes in blood supply (Roy and Sherrington, 1890). Numerous studies have focused on the relationship between neuronal activity and the mechanisms of local blood flow modulation (e.g., (Logothetis et al., 2001)). It should be understood that the ultimate spatial resolution of any hemodynamic-based mapping technique relies on the underlying vasculature supplying the region and on the controlling mechanisms regulating the flow to the region. The first direct evidence to support such correlations between neuronal activity (as determined by hemodynamic mapping signals) and the vascular system was provided by a combined optical imaging and corrosion cast preparation in the auditory cortex, where it was demonstrated that intrinsic optical signals were spatially associated with a specific capillary bed (Harrison et al., 2002). However, because optical imaging is recording signals mainly from the cortical surface, which are the accumulative sum of signals originating throughout the cortical ribbon, it does not have the ability to resolve depth information. Optical imaging functional maps are a 2D representation of a 3D network of the vascular system, including surface vessels within which any hemodynamic changes are non-specific to the activated region. Thus, optical imaging techniques are not optimal for investigating the precise vascular or neuronal origin of hemodynamic mapping signals. Such investigations can be accomplished using high-resolution fMRI that is not limited by depth coverage and thus can provide critical information on neurovascular coupling as well as insight into the origin of hemodynamic-based imaging signals.
In early 2000, for my post-doc training, I joined Dr. Seong-Gi Kim’s group at the Center for Magnetic Resonance Research (CMRR) at the University of Minnesota, an institution that is and was known for its high-field magnets and one of the two pioneering sites that brought forth the birth of fMRI. I quickly learned that MRI (and fMRI in particular) is not as simple as optical imaging.
Increasing the spatial resolution in optical imaging requires a simple adjustment of the camera’s zoom, while in MRI, for obtaining higher resolution images, signal-to-noise (SNR) consideration is crucial. To gain the needed SNR for high-resolution imaging, high-field (stronger) magnets and optimized coils provide the “camera zoom” and are typically used. However, acquiring high-resolution BOLD-fMRI images does not guarantee mapping signals that closely reflect on the underlying neuronal activity. To increase the spatial specificity of the mapping signals, pulse sequences such as spin-echo (SE) based BOLD have been shown to be extremely beneficial (see more below). These ingredients for pushing the limits of fMRI were primarily established at the CMRR.
fMRI and the underlying vascular system
In general terms, the cortical vasculature system can be described by three basic elements: arteries, veins and the fine vascular network, i.e., the capillary bed. A large body of literature exists describing the morphology and functionality of the large pial vessels, mainly using optical methods on the exposed cortical surface. At the other end of the vascular tree, the capillary level, there are ample studies exploring their structural nature using a large arsenal of histochemical approaches. Only recently have the functional properties of the capillaries been investigated, using focal optical techniques such as Two-Photon imaging (Schaffer et al., 2006). Connecting these two groups is a cluster of intracortical vessels, which branch off from large cortical surface vessels, penetrate the cortex at approximately right angles, and extend down to the capillary level deep within the tissue. However, data describing their morphology is limited, and their functional properties are largely a mystery. This is mainly due to technical limitations of accessing these vessels; the intracortical vessels, as their name implies, are embedded within the tissue. While, relatively little is known about them, their strategic positioning within the cortical tissue may play a significant role in blood flow regulation at the submillimeter scale – the level of fundamental functional units – cortical columns.
Capitalizing on the benefits of high field we set out to investigate these intracortical vessels. In a study with Dr. Patrick Bolan, we described a methodology for in-vivo MR imaging of arteries and veins within the visual cortex of the cat brain (Bolan et al., 2006). A high magnetic field (9.4 T) and small field-of-view 3D acquisitions were used to image the neurovasculature at resolutions approaching the microscopic scale. A combination of time-of-flight MR angiography and T2*- weighted imaging, using both endogenous BOLD contrast and an exogenous iron-oxide contrast agent, provided high specificity for distinguishing between arteries and veins within the cortex. These acquisition techniques, combined with 3D image processing and display methods, were used to detect and visualize intracortical arteries and veins with diameters smaller than 100 μm (Bolan et al., 2006).
This cat data demonstrated that the distribution of arteries and veins are not random. The largest veins oriented perpendicular to the cortical surface are the principle intracortical veins. These are spaced 1–1.5 mm apart, and are surrounded by a network of smaller veins and arteries oriented in the same direction (Bolan et al., 2006). This morphological organization is consistent with previous ex vivo studies in cats (McHedlishvili and Kuridze, 1984) and humans (Duvernoy et al., 1981) and is in agreement with the “vascular unit” as was suggested by Duvernoy’s model, thus, the data suggests an orderly structure of the vascular system in the cat cortex. Furthermore, that study demonstrates the capabilities of high-field MRI to identify and resolve these small vascular features in vivo (Bolan et al., 2006).
The reader should appreciate that the current understanding of fMRI, regarding its vascular origins, is based on numerous assumptions and theoretical modeling, but little experimental validation exists to support or challenge these models. However, in recent years, advances in MR technology and methodology have enabled the probing of the brain, both structurally as well as functionally, at resolutions and coverage not previously attainable which should provide the missing link regarding the origin of the fMRI signals (Harel et al., 2010, Yu et al., 2011). A nice example of utilizing the knowledge of the underlying vasculature for fMRI was recently demonstrated by Seong-Gi Kim’s lab, where, by carefully choosing an imaging plane just below the pial surface vessels, orientation columns were obtained in the cat brain with gradient-echo (GE)- BOLD which typically has higher sensitivity to surface vessels, that dominate and mask the functional maps and result in reduced spatial specificity (Moon et al., 2007).
Laminar resolution of fMRI signals
Since the introduction of BOLD fMRI, great effort has been put into better understanding its neuronal correlations with the goal of increasing the spatial resolution and specificity of these hemodynamic-based signals. These efforts focused predominantly on suppressing draining vessel contributions and boosting tissue or capillary signals, all with the assumption that gray matter or “tissue”-fMRI signals closely mirror changes at the neuronal level. High magnetic fields provide the right settings to push and investigate the spatial resolution of fMRI. In a combined imaging and histological study, the spatial characteristics of fMRI signals across the cortical lamina were explored (Harel et al., 2006). In a high-resolution fMRI study (0.15 × 0.15 × 2 mm3) we demonstrated that when surface vessels are excluded, high-resolution fMRI signals peak at cortical layer IV. The uniqueness of this study was that we were able to spatially correlate the fMRI maps with the underlying cortical laminar cytoarchitectonic obtained within the same animal and tissue region (Harel et al., 2006). Similar fMRI results were successfully replicated by others (Zhao et al., 2006). An independent confirmation to our findings came from a high-resolution monkey study where the fMRI signals peaked over the line of Gennari, which is visually identified on the echo-planar images (EPI) and is anatomically confined to cortical layer IV (Goense and Logothetis, 2006).
In addition, theoretical work had predicted that spin-echo (SE) BOLD will have better specificity at high magnetic fields when compared with GE-BOLD although at the cost of a decrease in the magnitude of signal changes (Ogawa et al., 1993) (Boxerman et al., 1995). Our experimental data has demonstrated and validated these predictions. The SE-BOLD functional maps exhibit reduced superficial large-vessels signals when compared to GE-BOLD fMRI signals (factor of 2.8); more importantly, it was demonstrated that maximum signal changes in the tissue were observed in layer IV, a region dominated by microvascular size vessels (Harel et al., 2006). The improved specificity of the SE-BOLD is ascribed to the enhanced sensitivity to the microvasculature via extravascular BOLD, while the potentially non-specific intravascular component from larger vessels rapidly diminishes with increasing field magnitude.
When our laminar paper came out, several groups argued that the findings of fMRI signal peak over layer IV was purely a reflection of the vascular distribution across the tissue. However, several observations argue against this as the only possibility: first, similarly higher densities of capillaries are found in layers IV across areas 17 and 18 of the cat (Tieman et al., 2004), while the largest fMRI signals associated with the middle layers in that study were observed mainly in area 18 (Harel et al., 2006). If the fMRI signal changes were simply reflecting the vascular density, a more homogeneous distribution of signal changes would be expected across areas 17 and 18 in similar lamina. Furthermore, this is a finding that is frequently overlooked when discussing laminar activation of fMRI signals, the laminar activation maps in the cat data demonstrated a noticeable specificity to the input stimulus and thus, neuronal preference. The stimulus used in that study was optimized for evoking responses from neurons in area 18 of the cat visual cortex; in contrast, the neurons in area 17 prefer stimuli with higher spatial frequencies and slower velocities. Figure 6 in Harel (2006) demonstrates the corresponding spatial specificity of the cerebral blood volume (CBV) signals to the visual stimulation. As one of the anonymous reviewers of the manuscript nicely pointed out, the largest CBV changes correspond to area 18 (dorsal section of marginal gyrus) and seem to consistently mark the medial edge of area 18 into the transition zone (Payne, 1990)—the region bordering between areas 18 and 17 (medial section of marginal gyrus), while significantly reduced signal changes in area 17 are seen in the maps (Harel et al., 2006).
Mapping cortical columns in human with fMRI
Since the glorious days in the 1990s of optical imaging, where their figures and maps were featured on every respectable journal cover, the fMRI neuroimaging community had the envy to accomplish similar mapping resolution. The one major difference is that if it could be done, it would be done non-invasively, which would open the possibility for exploring columnar organization in human.
A fundamental property of the cerebral cortex is the spatial localization of function. Within a defined cortical region, neurons sharing similar functional properties are often clustered together spanning from the pial surface to the white matter, thus forming a column-like functional unit. Initially, Mountcastle (Mountcastle, 1957) described the columnar organization of the somatic sensory cortex, which was followed by the work of Hubel and Wiesel (Hubel and Wiesel, 1962, Hubel and Wiesel, 1965), who mapped the columnar organization of the visual cortex. This functional parcellation extends in the millimeter to sub-millimeter domain. In visual cortex, preference to right or left eye (ocular dominance), direction of motion, spatial frequency and orientation have all been characterized in animals. In humans, several groups have successfully mapped ocular dominance columns (ODCs) using fMRI (Menon et al., 1997, Dechent and Frahm, 2000, Cheng et al., 2001, Yacoub et al., 2007) (see also Kang Cheng's this issue). However, the ODCs represent bulk, segregated inputs that can be measured anatomically (Horton and Hedley-Whyte, 1984) whereas this is not possible with other columnar systems.
From years of invasive animal studies, orientation columns in visual cortex are perhaps the best-known example of such a functional organization in the brain. Building on the accomplishments of a long series of theoretical and experimental studies, by many groups, on the underlying mechanisms of fMRI contrast, we (Essa Yacoub, Kamil Ugurbil and myself) combined all of what was learned over the years (7T, SE-BOLD, optimized coil etc.,) and recently demonstrated the feasibility to map orientation columnar structures in the human brain (for experimental details, see Yacoub et al., 2008). Highly motivated and “semi-professional” volunteers, mainly graduate students at the University of Minnesota were scanned multiple times. A typical imaging session consisted of 3-hour scans while the subjects were biting on a bit-bar to minimize motion artifact. Initially, the stimulus paradigm consistent of 4 orientations (conditions). However, the initial maps didn’t produce the expected features that were expected from the animal studies. We then decided to use the phase encoding paradigm (similar to the approach typically used for retinotopic mapping) and with some image post-processing, the classical pinwheel centers, areas where multiple orientation preferences converge, emerged from the data.
While we were extremely delighted seeing these maps, we always had in the back of our mind the work coming out of Eric Schwartz’s lab (Rojer and Schwartz, 1990) that claimed that the pinwheel features could simply be produced by spatial filtering, in other words, artifacts. In animal studies, the validation process is relatively straightforward (i.e. measuring the orientation preference of each cortical area using invasive methods). Since such validation approaches are impractical in human studies we had to build our case from what was known from animal studies. Extensive literature exists from years of animal studies regarding the spatial organization of orientation columns. After many (!!!) hours of exploring the human orientation maps we identified the spatial features that were reported from animal studies, such as linear zones, saddle points and fractures (Obermayer and Blasdel, 1993). Figure 1 shows a picture from Noam Harel’s notebook (early 2006) showing a few of the initial maps and the identified features in these maps. Furthermore, striking similarities were found in our human data with the known spatial features and spatial relationships between ODC and orientation columns, as was previously described in monkeys and cat studies using the optical imaging method (Bartfeld and Grinvald, 1992, Blasdel, 1992).
Figure 1.
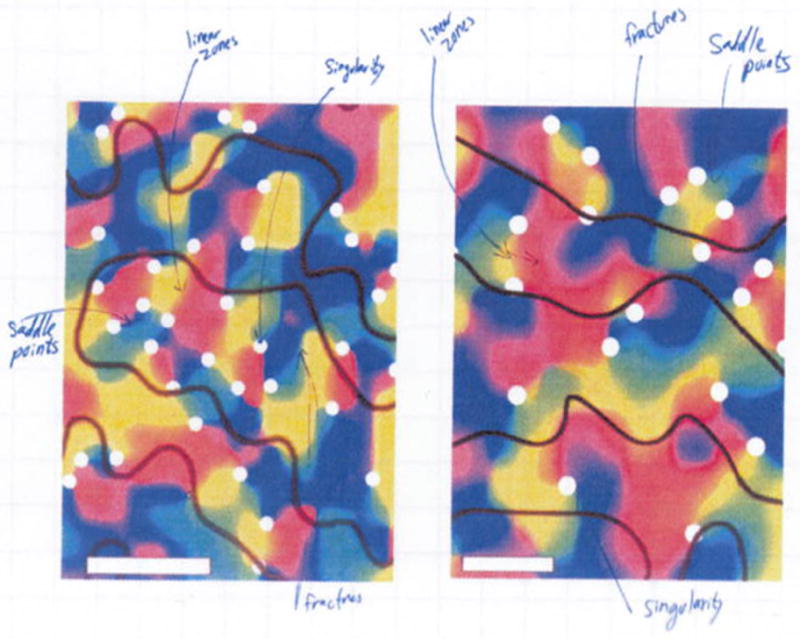
is a snapshot from Noam Harel’s notebook (early 2006) showing two of the initial orientation fMRI maps obtained in humans. The maps exhibits the spatial features that have been reported in animal studies, such as linear zone, singularities, saddle points and fractures following (Obermayer and Blasdel, 1993).
During the Gordon conference in Oxford (August 2006) where I presented the fMRI orientation maps, Justin Gardner (RIKEN, Brain Science Institute) had a simple, but great idea for validating our results. Justin suggested reversing the direction of the rotating stimulation and seeing if these “pinwheels” change direction – if these maps were genuine, we should obtain complementary maps when comparing the clockwise and counterclockwise-stimulated maps. The first experiment coming back from the meeting was exactly that, and needless to say, we were all thrilled to see the results which ended up as fig. 4 in our PNAS publication -- for more experimental details, please see (Yacoub et al., 2008).
This work represented several major achievements: for starters, the data and methods used specifically demonstrate the feasibility of using fMRI to explore previously unmapped, and potentially unknown, columnar systems in the human brain. While one could expect the presence of orientation preferences in human V1, theses cortical columns could only be resolved based on their functional properties, with no corresponding anatomical studies for validation. Furthermore, our ability to measure the ODC patterns anatomically and our inability, to date, to measure orientation columns in humans noninvasively, with any other method than fMRI, underscore the importance of the reported discovery of orientation pinwheels in humans. Secondly, and probably more significant for the entire field of fMRI, this study became the showcase for any institution that was, and is, seeking a high-field (≥ 7T) magnet. We have been asked to present this work, provide slides and figures for numerous investigators around the world for their effort to make their case of the advantages and benefits of obtaining high-field systems for fMRI studies. A clear testimony for it is the fast proliferation of 7T systems around the world today.
In conclusion, the development of fMRI over the past 20 years was by no means a one-person, or even a one-group, achievement. Publications, presentations, abstracts and many hours of scientific discussions (typically over beer) lead to new ideas and to the next set of experiments that propelled the field forward. Personally, I was privileged to work with a very talented group of people throughout the years. From the visionary and pioneering work of Kamil Ugurbil, the director of the CMRR to working with Seong-Gi Kim (now at the U of Pittsburgh) who introduced me to fMRI. Special thanks go to my colleague and friend, Essa Yacoub, a truly gifted MR physicist, who could translate all my crazy ideas into spectacular images. Finally, I would like to thank all of my colleagues at the CMRR and around the world, for letting me be part of this extraordinary journey.
Acknowledgments
This work was supported, in part, by the NIH grants R01EB008645, P41-RR008079 and P30 NS057091 and by the Human Connectome Project (U54 MH091657).
Footnotes
Publisher's Disclaimer: This is a PDF file of an unedited manuscript that has been accepted for publication. As a service to our customers we are providing this early version of the manuscript. The manuscript will undergo copyediting, typesetting, and review of the resulting proof before it is published in its final citable form. Please note that during the production process errors may be discovered which could affect the content, and all legal disclaimers that apply to the journal pertain.
References
- Bartfeld E, Grinvald A. Relationships between orientation-preference pinwheels, cytochrome oxidase blobs, and ocular-dominance columns in primate striate cortex. Proc Natl Acad Sci U S A. 1992;89:11905–11909. doi: 10.1073/pnas.89.24.11905. [DOI] [PMC free article] [PubMed] [Google Scholar]
- Blasdel GG. Differential imaging of ocular dominance and orientation selectivity in monkey striate cortex. J Neurosci. 1992;12:3115–3138. doi: 10.1523/JNEUROSCI.12-08-03115.1992. [DOI] [PMC free article] [PubMed] [Google Scholar]
- Bolan PJ, Yacoub E, Garwood M, Ugurbil K, Harel N. In vivo micro-MRI of intracortical neurovasculature. Neuroimage. 2006;32:62–69. doi: 10.1016/j.neuroimage.2006.03.027. [DOI] [PubMed] [Google Scholar]
- Boxerman JL, Hamberg LM, Rosen BR, Weisskoff RM. MR contrast due to intravascular magnetic susceptibility perturbations. Magnetic resonance in medicine : official journal of the Society of Magnetic Resonance in Medicine / Society of Magnetic Resonance in Medicine. 1995;34:555–566. doi: 10.1002/mrm.1910340412. [DOI] [PubMed] [Google Scholar]
- Cheng K, Waggoner RA, Tanaka K. Human ocular dominance columns as revealed by high-field functional magnetic resonance imaging. Neuron. 2001;32:359–374. doi: 10.1016/s0896-6273(01)00477-9. [DOI] [PubMed] [Google Scholar]
- Dechent P, Frahm J. Direct mapping of ocular dominance columns in human primary visual cortex. Neuroreport. 2000;11:3247–3249. doi: 10.1097/00001756-200009280-00039. [DOI] [PubMed] [Google Scholar]
- Duong TQ, Yacoub E, Adriany G, Hu X, Ugurbil K, Kim SG. Microvascular BOLD contribution at 4 and 7 T in the human brain: gradient-echo and spin-echo fMRI with suppression of blood effects. Magn Reson Med. 2003;49:1019–1027. doi: 10.1002/mrm.10472. [DOI] [PubMed] [Google Scholar]
- Duvernoy HM, Delon S, Vannson JL. Cortical blood vessels of the human brain. Brain Res Bull. 1981;7:519–579. doi: 10.1016/0361-9230(81)90007-1. [DOI] [PubMed] [Google Scholar]
- Goense JB, Logothetis NK. Laminar specificity in monkey V1 using high-resolution SE-fMRI. Magn Reson Imaging. 2006;24:381–392. doi: 10.1016/j.mri.2005.12.032. [DOI] [PubMed] [Google Scholar]
- Harel N, Bolan PJ, Turner R, Ugurbil K, Yacoub E. Recent Advances in High-Resolution MR Application and Its Implications for Neurovascular Coupling Research. Frontiers in neuroenergetics. 2010;2:130. doi: 10.3389/fnene.2010.00130. [DOI] [PMC free article] [PubMed] [Google Scholar]
- Harel N, Lin J, Moeller S, Ugurbil K, Yacoub E. Combined imaging-histological study of cortical laminar specificity of fMRI signals. Neuroimage. 2006;29:879–887. doi: 10.1016/j.neuroimage.2005.08.016. [DOI] [PubMed] [Google Scholar]
- Harel N, Mori N, Sawada S, Mount RJ, Harrison RV. Three distinct auditory areas of cortex (AI, AII, and AAF) defined by optical imaging of intrinsic signals. Neuroimage. 2000;11:302–312. doi: 10.1006/nimg.1999.0537. [DOI] [PubMed] [Google Scholar]
- Harrison RV, Harel N, Panesar J, Mount RJ. Blood capillary distribution correlates with hemodynamic-based functional imaging in cerebral cortex. Cereb Cortex. 2002;12:225–233. doi: 10.1093/cercor/12.3.225. [DOI] [PubMed] [Google Scholar]
- Horton J, Hedley-Whyte ET. Mapping of cytochrome oxidase patches and ocular dominance columns in human visual cortex. Philos Trans R Soc Lond Biol B. 1984;304:255–272. doi: 10.1098/rstb.1984.0022. [DOI] [PubMed] [Google Scholar]
- Hubel DH, Wiesel TN. Receptive fields, binocular interaction and functional architecture in the cat's visual cortex. J Physiol (Lond) 1962;160:106–154. doi: 10.1113/jphysiol.1962.sp006837. [DOI] [PMC free article] [PubMed] [Google Scholar]
- Hubel DH, Wiesel TN. Receptive Fields and Functional Architecture in Two Nonstriate Visual Areas (18 and 19) of the Cat. J Neurophysiol. 1965;28:229–289. doi: 10.1152/jn.1965.28.2.229. [DOI] [PubMed] [Google Scholar]
- Logothetis NK, Pauls J, Augath M, Trinath T, Oeltermann A. Neurophysiological investigation of the basis of the fMRI signal. Nature. 2001;412:150–157. doi: 10.1038/35084005. [DOI] [PubMed] [Google Scholar]
- McHedlishvili G, Kuridze N. The modular organization of the pial arterial system in phylogeny. J Cereb Blood Flow Metab. 1984;4:391–396. doi: 10.1038/jcbfm.1984.57. [DOI] [PubMed] [Google Scholar]
- Menon RS, Ogawa S, Strupp JP, Ugurbil K. Ocular dominance in human V1 demonstrated by functional magnetic resonance imaging. J Neurophysiol. 1997;77:2780–2787. doi: 10.1152/jn.1997.77.5.2780. [DOI] [PubMed] [Google Scholar]
- Moon CH, Fukuda M, Park SH, Kim SG. Neural interpretation of blood oxygenation level-dependent fMRI maps at submillimeter columnar resolution. J Neurosci. 2007;27:6892–6902. doi: 10.1523/JNEUROSCI.0445-07.2007. [DOI] [PMC free article] [PubMed] [Google Scholar]
- Mountcastle VB. Modality and topographic properties of single neurons of cat's somatic sensory cortex. J Neurophysiol. 1957;20:408–434. doi: 10.1152/jn.1957.20.4.408. [DOI] [PubMed] [Google Scholar]
- Obermayer K, Blasdel GG. Geometry of orientation and ocular dominance columns in monkey striate cortex. The Journal of neuroscience : the official journal of the Society for Neuroscience. 1993;13:4114–4129. doi: 10.1523/JNEUROSCI.13-10-04114.1993. [DOI] [PMC free article] [PubMed] [Google Scholar]
- Ogawa S, Menon RS, Tank DW, Kim S-G, Merkle H, Ellermann JM, Ugurbil K. Functional Brain Mapping by Blood Oxygenation Level-Dependent Contrast Magnetic Resonance Imaging. Biophys J. 1993;64:800–812. doi: 10.1016/S0006-3495(93)81441-3. [DOI] [PMC free article] [PubMed] [Google Scholar]
- Payne BR. Representation of the ipsilateral visual field in the transition zone between areas 17 and 18 of the cat's cerebral cortex. Vis Neurosci. 1990;4:445–474. doi: 10.1017/s0952523800005204. [DOI] [PubMed] [Google Scholar]
- Rojer AS, Schwartz EL. Cat and monkey cortical columnar patterns modeled by bandpass-filtered 2D white noise. Biol Cybern. 1990;62:381–391. doi: 10.1007/BF00197644. [DOI] [PubMed] [Google Scholar]
- Roy C, Sherrington C. On the regulation of the blood supply of the brain. J Physiol. 1890;11:85–108. doi: 10.1113/jphysiol.1890.sp000321. [DOI] [PMC free article] [PubMed] [Google Scholar]
- Schaffer CB, Friedman B, Nishimura N, Schroeder LF, Tsai PS, Ebner FF, Lyden PD, Kleinfeld D. Two-Photon Imaging of Cortical Surface Microvessels Reveals a Robust Redistribution in Blood Flow after Vascular Occlusion. PLoS Biol. 2006;4:e22. doi: 10.1371/journal.pbio.0040022. [DOI] [PMC free article] [PubMed] [Google Scholar]
- Tieman SB, Mollers S, Tieman DG, White J. The blood supply of the cat's visual cortex and its postnatal development. Brain Research. 2004;998:100–112. doi: 10.1016/j.brainres.2003.11.023. [DOI] [PubMed] [Google Scholar]
- Yacoub E, Harel N, Ugurbil K. High-field fMRI unveils orientation columns in humans. Proc Natl Acad Sci U S A. 2008;105:10607–10612. doi: 10.1073/pnas.0804110105. [DOI] [PMC free article] [PubMed] [Google Scholar]
- Yacoub E, Shmuel A, Logothetis N, Ugurbil K. Robust detection of ocular dominance columns in humans using Hahn Spin Echo BOLD functional MRI at 7 Tesla. Neuroimage. 2007;37:1161–1177. doi: 10.1016/j.neuroimage.2007.05.020. [DOI] [PMC free article] [PubMed] [Google Scholar]
- Yu X, Glen D, Wang S, Dodd S, Hirano Y, Saad Z, Reynolds R, Silva AC, Koretsky AP. Direct imaging of macrovascular and microvascular contributions to BOLD fMRI in layers IV-V of the rat whisker-barrel cortex. Neuroimage. 2011 doi: 10.1016/j.neuroimage.2011.08.001. [DOI] [PMC free article] [PubMed] [Google Scholar]
- Zhao F, Wang P, Hendrich K, Ugurbil K, Kim SG. Cortical layer-dependent BOLD and CBV responses measured by spin-echo and gradient-echo fMRI: insights into hemodynamic regulation. Neuroimage. 2006;30:1149–1160. doi: 10.1016/j.neuroimage.2005.11.013. [DOI] [PubMed] [Google Scholar]