

Abstract
Skeletal muscle function largely depend on intact energy metabolism, stress response, and antioxidant defense mechanisms. In this study, we tested the effect of a combined supplementation of α-lipoic acid (LA) plus coenzyme Q10 (Q10) on PPARγ-coactivator α (PGC1α) activity, expression of glutathione-related phase II enzymes and glutathione (GSH) levels in cultured C2C12 myotubes. Supplementation of myotubes with 250 μmol/L LA plus 100 μmol/L Q10 significantly increased nuclear levels of PGC1α, a master switch of energy metabolism and mitochondrial biogenesis. The increase of nuclear PGC1α was accompanied by an increase in PPARγ transactivation, a downstream target of PGC1α, and an increase in mitochondrial transcription factor A mRNA centrally involved in mitochondrial replication and transcription. Furthermore, supplementation of myotubes with LA plus Q10 resulted in an increase of genes encoding proteins involved in stress response, GSH synthesis, and its recycling. In LA-plus-Q10-treated myotubes a significant 4-fold increase in GSH was evident. This increase in GSH was accompanied by increased nuclear Nrf2 protein levels, partly regulating γGCS and GST gene expression. Present data suggest that the combined supplementation of skeletal muscle cells with LA plus Q10 may improve energy homeostasis, stress response, and antioxidant defense mechanisms.
1. Introduction
The peroxisome proliferator-activated receptor γ (PPARγ)-coactivator α (PGC1α) has been characterized as a master switch of energy homeostasis [1]. PGC1α interacts with transcription factors such as PPARγ, which is a downstream target of PGC1α, thereby mediating adaptive thermogenesis, mitochondrial biogenesis, and fiber type switching of the skeletal muscle [1]. Gain-of-function studies indicate an increased resistance to induced fatigue in isolated skeletal muscle of transgenic mice overexpressing PGC1α [2]. An activation of PGC1α is associated with an increased expression of slow-twitch (type I) fibers which are characterized by an increased mitochondrial biogenesis and thus oxidative metabolism as main energy source [1]. Physical exercise may activate PGC1α [3], whereas aging is accompanied by a significant decrease of PGC1α expression in skeletal muscle [4]. This decrease in PGC1α may impair mitochondrial respiratory capacity, thereby increasing the production of reactive oxygen species which in turn results in glutathione (GSH) depletion and oxidative stress. Thus, strategies are warranted that activate PGC1α and increase GSH synthesis and its recycling thereby maintaining muscle function and integrity.
α-Lipoic acid (LA) is synthesized from octanoic acid in the mitochondria where it serves as a cofactor of mitochondrial α-ketoacid dehydrogenase [5].Beside endogenous synthesis LA may also derive from exogenous dietary sources including supplements (reviewed by [6]). As a component of the electron transport chain in the inner mitochondria membrane, coenzyme Q10 also known as ubiquinone is centrally involved in cellular respiration and mitochondrial biogenesis. Furthermore, it is well known for its free radical scavenging properties, which are partly mediated by electron transfer (reviewed by [7]). LA and Q10 may not work in isolation [8] although little is known regarding the potential synergistic activity of LA plus Q10 in terms of muscle cell physiology. Therefore, in this study we investigated the effect of a combined supplementation of LA plus Q10 on PGC1α levels, stress response, and glutathione synthesis in cultured myotubes.
2. Materials and Methods
R(+)LA and Q10 were obtained from Sigma-Aldrich Co. (Munich, Germany). LA was dissolved in DMSO (Carl Roth, Karlsruhe, Germany). Q10 stock solutions were prepared as described previously [9]. The stock solutions were stored at −80°C until usage.
2.1. Cell Culture
C2C12 cells (Institute for Applied Cell Culture, Munich, Germany) were maintained in Dulbecco's modified Eagle's medium (DMEM) containing 4.5 g/L glucose, 4 mmol/L L-glutamine, 1 mmol/L sodium pyruvate, 10% fetal calf serum (FCS), 100 U/mL penicillin, and 100 μg/mL streptomycin (PAA, Coelbe, Germany). Cells were grown in 5% CO2 at 37°C under a humidified atmosphere. Before each treatment, C2C12 cells were differentiated to myotubes via serum starvation applying DMEM supplemented with 2% horse serum (Gibco, Life technologies, Carlsbad, USA) for 48 h–72 h. All cell-culture plasticware was purchased from Sarstedt (Numbrecht, Germany) unless otherwise stated. For all cell culture assays vehicle controls have been performed and did not affect any of the parameters measured.
2.2. Cytotoxicity Measurement
Cytotoxicity was determined via the neutral red assay [10]. The neutral red assay is based on the pH-dependent accumulation of neutral red in the lysosomes of viable cells. C2C12 cells were seeded in 24-well plates (Fisher Scientific, Schwerte, Germany) at a density of 100,000 cells/well, differentiated for 72 h, and treated with 250 μmol/L LA plus 100 μmol/L Q10 for 24 h in serum-containing medium, respectively. The culture medium containing the test substances was replaced with fresh serum-containing medium including 50 μg/mL of neutral red (Carl Roth). After incubation for 3 h, the medium was removed and the cells were extracted using a solution comprising 50 : 49 : 1 (v/v/v) ethanol, water, and glacial acetic acid. The absorbance was measured in a plate reader (Labsystems, Helsinki, Finland) at 540 nm.
2.3. Transient Transfection and PPARγ Luciferase Reporter Gene Assay
C2C12 cells were differentiated in 24-well plates. The cells were transiently transfected with three vectors: one vector containing the PPARγ-LBD (ligand-binding domain), one UAS-GAL4-vector containing the reporter gene firefly luciferase, and a normalization vector (pRL-TK; Promega, Mannheim, Germany) containing the Renilla reniformis luciferase gene. Transfection was performed using JetPei transfection reagent (Polyplus transfection, Illkirch Cedex, France) according to manufacturer's instructions. Following 24 h of transfection the test compounds as well as 1 μM rosiglitazone were applied in serum-containing medium and treated for 24 h. Subsequently, cells were lysed and luciferase activity was measured using the Dual-Luciferase reporter gene assay system (Promega) according to the manufacturer's protocol in a Tecan Infinite 200 microplate reader (Tecan Group Ltd., Crailsheim, Germany).
2.4. RNA Isolation and Real-Time PCR
C2C12 cells were precultured in 6-well plates at a density of 300,000 cells/well. Cells were differentiated and subsequently treated with 250 μmol/L LA plus 100 μmol/L Q10 and the respective compounds in coapplication for 16 h.
RNA for real-time PCR was isolated with TRIsure following the manufacturer's protocol (Bioline, Luckenwalde, Germany). Primers were designed by primer3 software with the following sequences: PGC1α forward: TGCCCAGATCTTCCTGAACT; reverse: TCTGTGAGAACCGCTAGCAA; TFAM forward: TAGGAAAATTGCAGCCCTGT; reverse: GCTGAACGAGGTCTTTTTGG; 18SrRNA forward: CCTGCGGCTTAATTTGACTC; reverse: AACTAAGAACGGCCATGCAC (MWG Biotech, Ebersberg, Germany). Real-time PCR was performed using Sensi-Mix one-step kit (Quantace, Berlin, Germany).
2.5. Agilent Microarray Analysis
Differential gene expression was determined via an Agilent MicroArray platform (Source BioScience, ImaGenes GmbH, Berlin, Germany). C2C12 cells were treated as described above. RNA for gene chip analysis was isolated using a Qiagen RNeasy Kit (Duesseldorf, Germany) according to the manufacturer's protocol. Agilent Quick Amp Labeling Kit One Color (Agilent Technologies, Santa Clara, USA) was used according to the manufacturer's instructions for generation and amplification of fluorescent cRNA. Yield and labeling of cRNA was controlled via NanoDrop measurement (Thermo Fisher Scientific). For hybridization, the Agilent gene expression hybridization kit was used according to the manufacturer's protocol. The microarray slides were washed (following the Agilent protocol) and subsequently scanned using an Agilent microarray scanner. Data were extracted using the Agilent Feature Extraction. Quality parameters (e.g., background detrend or grid) and abnormalities of each sample were monitored.
For microarray analysis DAVID Bioinformatics Resources 6.7 (Database for Annotation, Visualization an Integrated Discovery [11]; http://david.abcc.ncifcrf.gov/) was used. Therefore, gene IDs of the regulated genes (fold change > 2 or <−2) were uploaded. For subsequent functional clustering, KEGG (Kyoto Encyclopedia for Genes and Genomes) pathway maps were used.
2.6. In Silico Promoter Analysis
For promoter analysis, sequences of genes differentially regulated by LA plus Q10 treatment were uploaded to MatInspector Software (http://www.genomatix.de/) in order to identify putative binding sites for Nrf2.
2.7. Glutathione Measurement
C2C12 cells were treated with the test compounds for 24 h as described above. Subsequently, cells were washed and lysed in 10 mmol/L HCl and repeated freeze-thaw cycles. GSH was determined following the microtiter plate assay protocol according to Vandeputte et al. [12]. In brief, cell protein was precipitated by addition of 6.5% sulfosalicylic acid and centrifugation (2000 × g, 15 min). Cell samples were applied on the microtiter plates, mixed with stock buffer and a reagent mix comprising (final reaction concentration) 0.71 mmol/L DTNB and 0.24 mmol/L NADPH. The reaction was initialized by addition of glutathione reductase (1.2 IU/mL, Sigma Aldrich Co.). Kinetic measurement of the chromophore DTNB-GSH at 415 nm was performed in a plate reader (Labsystems, Helsinki, Finland). Total glutathione was determined using a GSH-standard curve (all reagents Carl Roth unless otherwise stated).
2.8. Western Blot Analysis of PGC1α and Nrf2 in Nuclear Extracts
For PGC1α and Nrf2 detection, cells were treated with the test compounds for 6 h. Subsequently, cells were washed with ice-cold PBS, scraped off, centrifuged, and nuclear extracts were subsequently prepared as described by Wagner et al. (2010) [13]. A quantity of 40 μg protein of each sample were mixed with loading buffer, incubated at 95°C for 5 min and separated on a 12% SDS-PAGE. Subsequently, the samples were transferred onto a PVDF (polyvinylidene fluoride) membrane and blocked with 3% (w/v) skim milk dissolved in TBS + 0.05% (v/v) Tween-20 (TBST) for at least 2 h and probed with antibodies against PGC1 (1 : 200; Santa Cruz Biotechnology Inc., Santa Cruz, USA), Nrf2 (1 : 200; Santa Cruz), TATA box binding protein (TBP; Santa Cruz; 1 : 200), or α-tubulin (Abcam, Cambridge, UK; 1 : 5000) at 4°C overnight. Following, the membranes were incubated with a secondary antibody (1 : 4000 anti-rabbit (Bio-Rad, Munich, Germany): Nrf2; 1 : 4000 anti-mouse (Bio-Rad): TBP, α-tubulin; 1 : 3000 anti-goat (Santa Cruz): PGC1) for 1 h, and the bands were visualized by using ECL reagent (Thermo Scientific) in a ChemiDoc XRS system (BioRad). Molecular weight of the protein bands was estimated using a Western C protein standard (Bio-Rad).
2.9. Statistical Analysis
Statistical analysis was conducted using SPSS 19 (IBM, Chicago, USA). Data were analysed for normality of distribution (Kolmogorov-Smirnov). In case of not normally distributed data the nonparametric Mann-Whitney U test was applied. Student's t-test or one-way analysis of variance (ANOVA) with a Dunnett-T (homogeneous variances) post hoc test was performed. Data are expressed as mean ± SEM. Significance was accepted at P < 0.05.
3. Results
In order to test for cytotoxicity of the test compounds C2C12 myotubes were incubated with 250 μmol/L LA plus 100 μmol/L Q10 (in the following abbreviated as LA plus Q10) for 24 h. Under the conditions investigated cell viability was not negatively affected by the LA plus Q10 treatment (Figure 1(a)).
Figure 1.
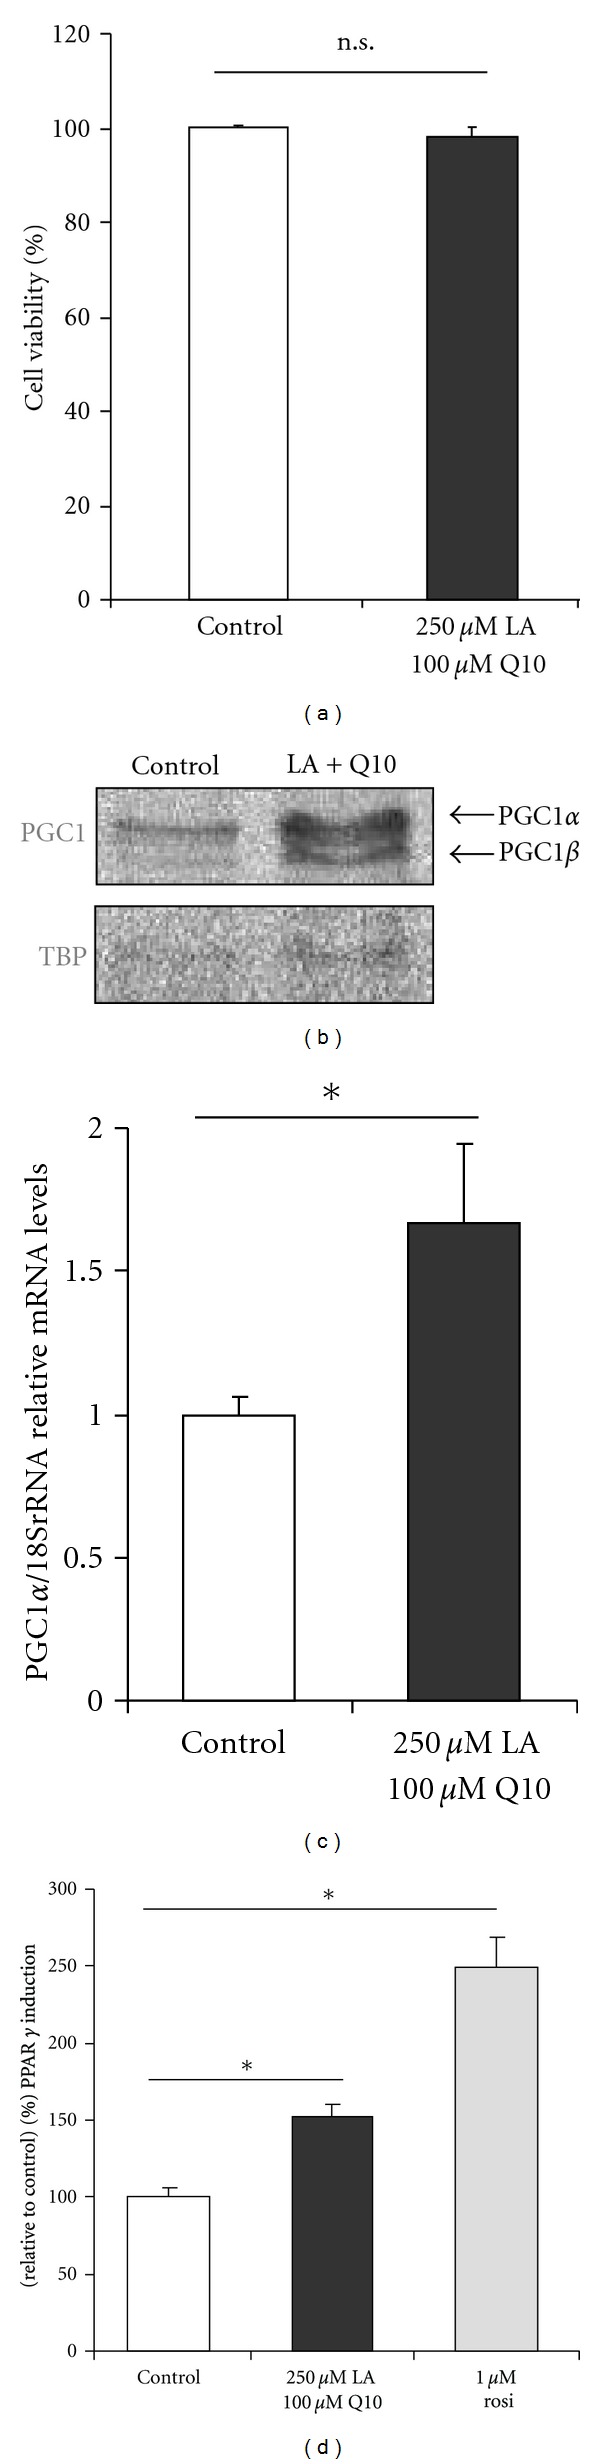
(a) Viability of differentiated C2C12 cells following incubation with 250 μmol/L LA plus 100 μmol/L Q10 for 24 h (data are mean + SEM). (b) PGC1 induction in C2C12 cells following incubation with 250 μmol/L LA plus 100 μmol/L Q10 for 6 h in nuclear cell lysates and (c) PGC1α mRNA levels in response to the LA plus Q10 treatment (data are mean + SEM of three independent experiments; *indicates significant difference to the control cells; P < 0.05; Student's t-test). (d) The increase in PGC1α is accompanied by an increased PPARγ transactivation as shown in transiently transfected C2C12 cells (data are mean + SEM of two independent experiments; *indicates significant difference to the control cells; P < 0.05; one-way ANOVA).
PGC1α is an important regulator of skeletal muscle energy homoeostasis. Therefore, we determined PGC1α nuclear protein levels following 6 h of incubation with LA plus Q10. LA plus Q10 supplementation of C2C12 myotubes significantly enhanced nuclear PGC1α protein levels as summarized in Figure 1(b). Differences in PGC1α protein levels in response to the LA plus Q10 treatment were also reflected in terms of PGC1α gene expression (Figure 1(c)). In fact we found a 70% increase in PGC1α mRNA levels in LA-plus-Q10-treated myotubes as compared to untreated control cells.
PGC1α is centrally involved in the regulation of PPARγ activity, which is a downstream target of PGC1α. Therefore, we determined PPARγ transactivation in transiently transfected C2C12 myotubes using a luciferase reporter gene assay. Rosiglitazone (1 μmol/L; rosi) was used as positive control. Treatment of our C2C12 myotubes with LA plus Q10 significantly increased PPARγ transactivation by approximately 50% (Figure 1(d)). However, LA plus Q10 cotreatment was less potent than rosiglitazone as far as the induction of PPARγ transactivation is concerned.
Aerobic muscle turnover may be accompanied by induction of reactive oxygen species which are partly produced in the respiratory chain of the inner mitochondrial membrane. Therefore, we investigated if and to what extent the application of LA plus Q10 may affect cellular GSH which is an important endogenous antioxidant. By using Agilent gene chip technology we found several transcripts to be differentially regulated by LA plus Q10 in our C2C12 myotubes. We filtered those genes in terms of their role in GSH synthesis, metabolism, and recycling. Interestingly within the GSH pathway 12 genes were differentially regulated (P value < 0.001, Benjamini enrichment score < 0.05) due to the LA plus Q10 supplementation as summarized in Figures 2(a) and 2(b).
Figure 2.
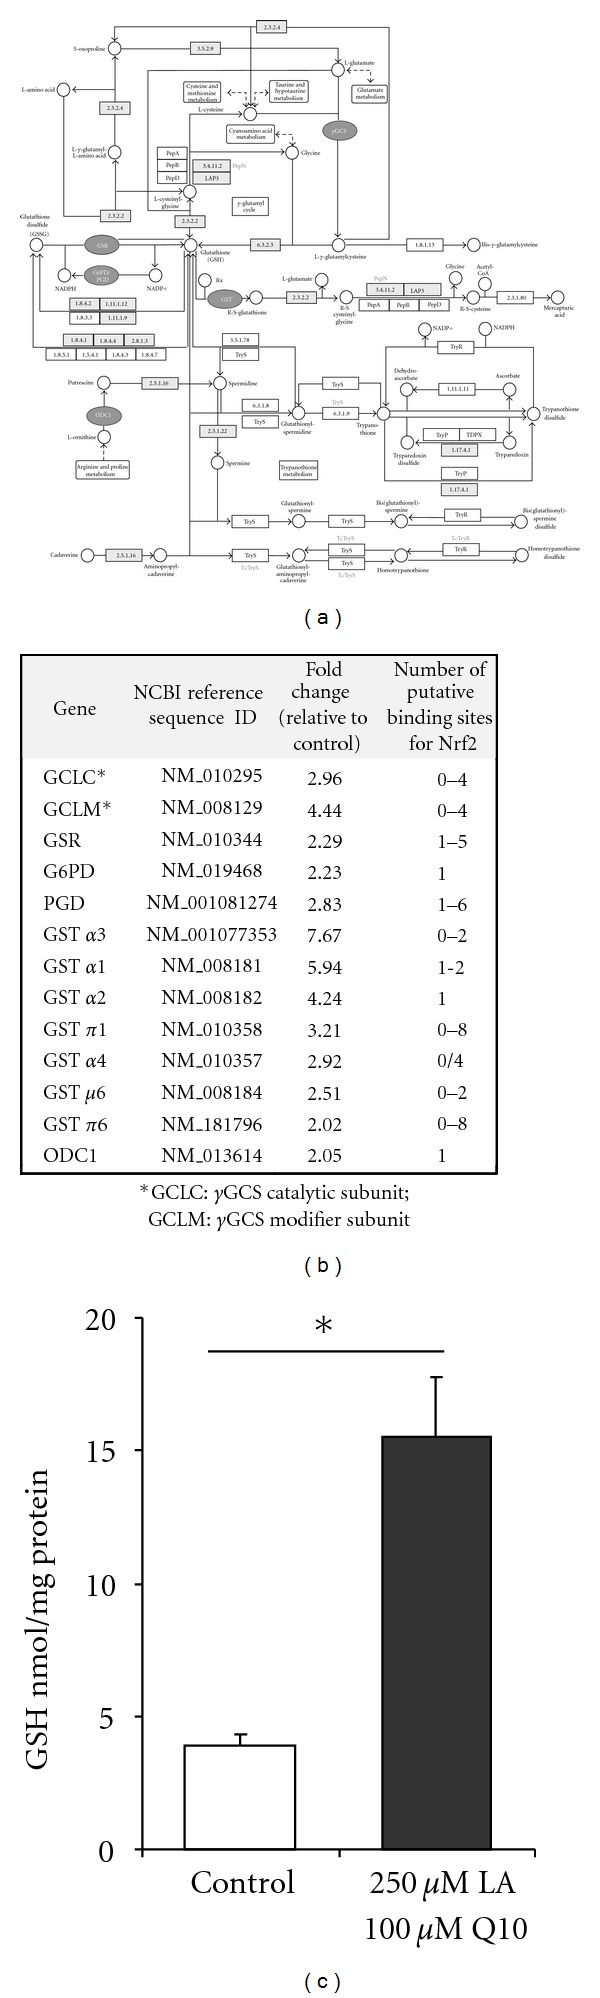
(a) Treatment of C2C12 cells with 250 μmol/L LA plus 100 μmol/L Q10 for 16 h differentially affects genes encoding proteins involved in glutathione synthesis, recycling, and metabolism as well as glutathione-related phase II response genes including γ-glutamylcysteine-synthetase (γGCS), glutathione reductase (GSR), glucose-6-phosphate dehydrogenase (G6PD), phosphogluconate dehydrogenase (PGD), and glutathione-S-transferases (GST), according to DAVID and KEGG pathway analysis. (b) Indicates fold changes, gene IDs, and the respective putative Nrf2 binding sites in the alternative murine promoter sequences of LA-plus-Q10-regulated genes as determined via MatInspector. (c) Glutathione (GSH) concentration in C2C12 cells in response to LA plus Q10 treatment (data are mean + SEM of three independent experiments; *indicates significant difference to the control cells; P < 0.05; Student's t-test).
Both γGCS light and heavy chain were manifold upregulated by the LA plus Q10 treatment. Since γGCS is the key enzyme in GSH synthesis we further determined cellular GSH levels in our skeletal muscle cells. Importantly, the induction of γGCS gene expression was accompanied by a 4-fold increase in cellular GSH in the LA-plus-Q10-treated cells as compared to control (Figure 2(c)).
Glutathione reductase (GSR) is centrally involved in the NADPH-mediated reduction of GSSG to GSH, thereby providing GSH for further reactions. Following incubation with LA plus Q10, we observed a 3.2-fold increase in GSR gene expression (Figure 2(c)). Interestingly, not only GSR but also glucose-6-phosphate dehydrogenase 2 (G6PD) and phosphogluconate dehydrogenase (PGD) gene expression was induced by LA plus Q10. Both enzymes provide NADPH which is used by GSR for GSSG reduction.
Induction of glutathione-S-transferase (GST) may protect the skeletal muscle from lipid peroxides thereby improving stress response. In fact, it has been shown that GST inactivates lipid peroxides such as 4-hydroxynonenal due to conjugation with GSH [14]. We found in our myotubes various genes encoding GST (GST α1, GST α2, GST α3, GST α4, GST π1, GST π2, GST μ6) to be upregulated by the cotreatment of LA plus Q10 (Figures 2(a) and 2(b)).
To identify binding sites for Nrf2 in murine promoter regions in LA-plus-Q10-regulated genes, the respective murine promoter sequences were uploaded to MatInspector. As summarized in Figure 2(b), several binding sites for Nrf2 have been identified in the promoter of the γGCS (GCLC (0–4 putative binding sites), GCLM (0–4)), GSR (1–5), GST (GST α1 (1-2), GST α2 (1), GST α3 (0–2), GST α4 (0/4), GST π1 (0–8), GST π2 (0–8), GST μ6 (0–2)) ODC1 (1), G6PD (1), and PGD (1–6) genes, respectively, (Figure 2(b)).
Treatment of C2C12 cells with LA plus Q10 increased TFAM mRNA levels by 70% (P = 0.078) as compared to controls (Figure 3(a)). Furthermore, LA plus Q10 supplementation resulted in an increase in nuclear Nrf2 levels as summarized in Figure 3(b).
Figure 3.
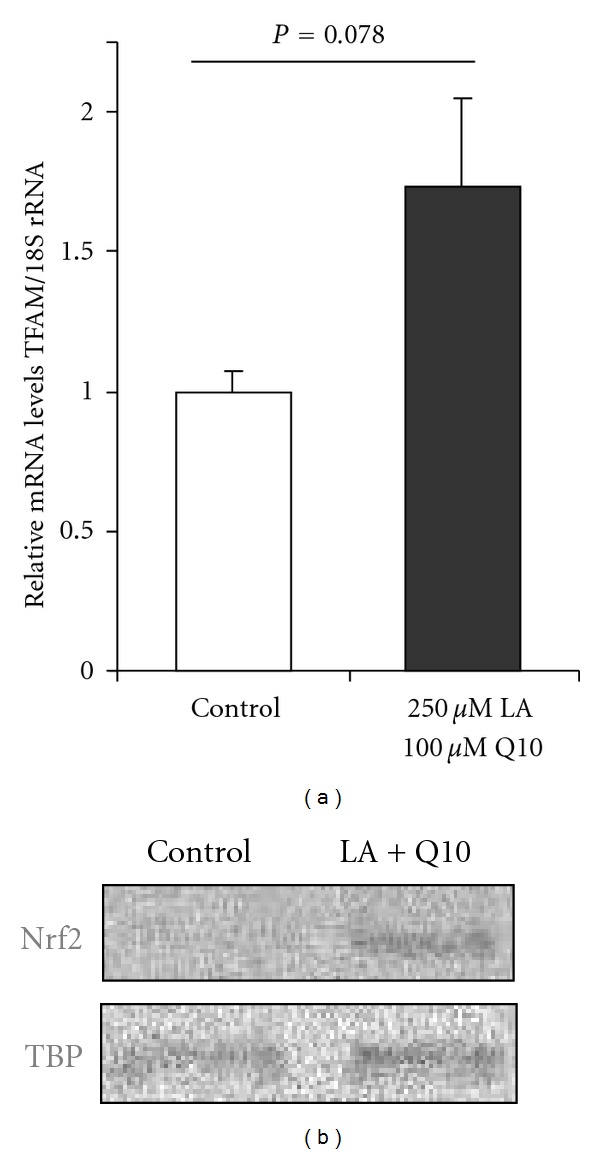
(a) TFAM mRNA and (b) nucleic Nrf2 protein levels of C2C12 cells following incubation with 250 μmol/L LA plus 100 μmol/L Q10 for 16 h (mRNA data are mean + SEM of three independent experiments; Mann-Whitney U test).
4. Discussion
Under the conditions investigated LA plus Q10 significantly increased nuclear PGC1α levels in our C2C12 skeletal muscle cells. PGC1α partly controls PPARγ activation which is centrally involved in cellular glucose uptake. In fact it has been previously shown that lipoic acid may stimulate glucose uptake and insulin sensitivity in adipocytes via a PPARγ-dependent signal transduction pathway [15, 16].
PGC1α is a key factor in mitochondrial biogenesis. PGC1α, in the presence of the nuclear respiratory factor 1 (NRF1), coactivates the mitochondrial transcription factor A (TFAM; also called mtTFA) which is essential for mitochondrial replication and transcription [17, 18]. Therefore, we determined TFAM levels in our LA-plus-Q10-treated myotubes. Interestingly, LA plus Q10 resulted in an increase in TFAM mRNA levels as compared to untreated controls (Figure 3(a)). LA plus Q10 cotreatment was more potent than the single treatment with LA and Q10 per se in increasing TFAM gene expression (data not shown). Further studies are needed to prove whether the increase in TFAM gene expression due to the LA plus Q10 cotreatment is also reflected in terms of increased nuclear TFAM protein levels as well as an increased cellular mitochondrial density, ATP synthesis, and oxygen consumption.
We observed a significant increase in cellular GSH levels in response to LA plus Q10 treatment in our skeletal muscle cells. Similar to PGC1α cellular GSH levels decrease with age [19]. Thus, LA plus Q10 may prevent age-dependent GSH depletion. The underlying mechanisms by which LA plus Q10 increased cellular GSH may be partly related to an increased cysteine uptake as previously reported [20]. Furthermore, in the present study LA plus Q10 significantly increased gene expression of γGCS, the rate limiting enzyme of GSH synthesis. γGCS gene expression is under transcriptional control of nuclear factor erythroid-like 2 derived factor 2 (Nrf2), a Cap N'Collar basic leucine zipper transcription factor [21–23]. Interestingly, LA plus Q10 treatment also manifold upregulated numerous GSTs which are also Nrf2 target genes [24]. Therefore, we determined Nrf2 nuclear levels in our skeletal muscle cells in response to the LA plus Q10 treatment. Since LA plus Q10 treatment substantially increased nuclear Nrf2 levels, it seems plausible that the induction of GSH via γGCS as well as the induction of GST gene expression in our C2C12 cells may have occurred via a Nrf2-dependent mechanism. In fact, it has been recently suggested that LA, may act as an electrophile which targets cysteine residues of the Nrf2 inhibitor Keap1 [25].
Our gene expression analysis also reveals ornithine decarboxylase 1 (ODC1) as a LA plus Q10 sensitive molecular target (fold change = 2.1, see Figure 2(b)). Interestingly, ODC1 is induced by exercise in skeletal muscle [26]. The increase in ODC1 activity may in turn increase cellular levels of putrescine, spermine, and spermidine [27], thereby improving DNA stability [28], which warrants further investigations.
In this study we tested the combination of LA plus Q10 in terms of PGC1α activity, stress response, and cellular GSH levels. However, we conducted also experiments using LA and Q10 as single treatments in order to relate our results to any of the test substances administered (data not shown). While Q10 was mainly mediating PGC1α inducing activity, LA increased stress response and cellular GSH levels. As far as TFAM gene expression is concerned, neither of the single test compounds enhanced TFAM. Thus, TFAM induction may be due to synergistic interaction between LA and Q10 in coapplication. Accordingly, in order to simultaneously induce PGC1, stress response genes, and cellular GSH levels in skeletal muscle cells a combination of LA plus Q10 rather than a treatment with the single compound may be suggested.
Overall present data indicate that a combination of lipoic acid plus coenzyme Q10 induces PGC1α, improves stress response, and increases cellular glutathione levels in cultured C2C12 skeletal muscle cells as summarized in Figure 4. We supplemented our myotubes with 250 μmol/L LA and 100 μmol/L Q10. LA concentrations, as used in this study, are by in large physiologically achievable [6, 29], whereas Q10 levels seem to be higher than those achievable in human plasma and skeletal muscle [30]. Thus, current finding regarding the role of LA and Q10 in terms of PGC1α activity, stress response, and antioxidant defense in cultured skeletal muscle cells in vitro should be verified in appropriate in vivo models.
Figure 4.
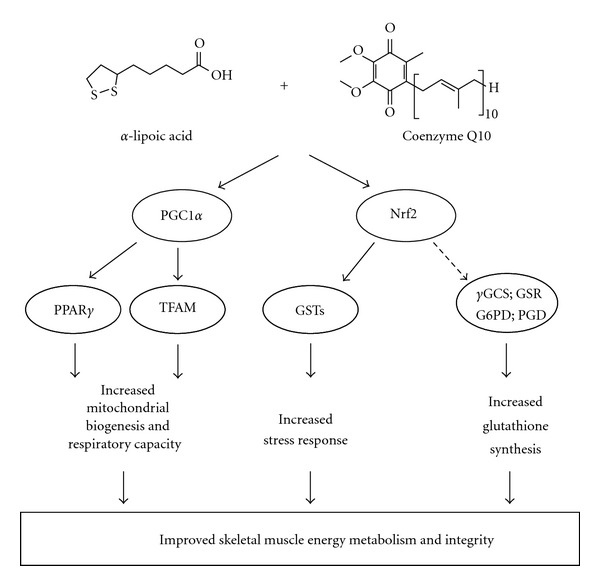
Molecular mechanisms by which the coadministration of LA plus Q10 may improve skeletal muscle energy metabolism and integrity. LA plus Q10 induce the transcription factor PGC1α which may activate TFAM. Furthermore, LA plus Q10 induce GSTs and genes encoding enzymes involved in GSH synthesis and recycling. Ultimately, LA plus Q10 may increase mitochondrial biogenesis, improve stress response, and increase cellular GSH levels.
Authors' Contribution
A. E. Wagner and I. M. A. Ernst contributed equally to this work.
Acknowledgment
The authors thank Gaby Steinkamp and Vivien Schmuck for excellent technical assistance.
Abbreviations
- γGCS:
γ-Glutamylcysteine-synthetase
- GST:
Glutathione-S-transferases
- G6PD:
Glucose-6-phosphate dehydrogenase 2
- GSH:
Glutathione
- GSR:
Glutathione reductase
- LA:
α-Lipoic acid
- Nrf2:
Nuclear factor erythroid-like 2 derived factor 2
- ODC1:
Ornithine decarboxylase 1
- PGC1α:
Peroxisome proliferator-activated receptor γ (PPARγ)-coactivator α
- PGD:
Phosphogluconate dehydrogenase
- TFAM:
Mitochondrial transcription factor A
- rosi:
Rosiglitazone.
References
- 1.Liang H, Ward WF. PGC-1α: a key regulator of energy metabolism. American Journal of Physiology. 2006;30(4):145–151. doi: 10.1152/advan.00052.2006. [DOI] [PubMed] [Google Scholar]
- 2.Lin J, Wu H, Tarr PT, et al. Transcriptional co-activator PGC-1α drives the formation of slow-twitch muscle fibres. Nature. 2002;418(6899):797–801. doi: 10.1038/nature00904. [DOI] [PubMed] [Google Scholar]
- 3.Pilegaard H, Saltin B, Neufer DP. Exercise induces transient transcriptional activation of the PGC-1α gene in human skeletal muscle. Journal of Physiology. 2003;546(3):851–858. doi: 10.1113/jphysiol.2002.034850. [DOI] [PMC free article] [PubMed] [Google Scholar]
- 4.Anderson R, Prolla T. PGC-1α in aging and anti-aging interventions. Biochimica et Biophysica Acta. 2009;1790(10):1059–1066. doi: 10.1016/j.bbagen.2009.04.005. [DOI] [PMC free article] [PubMed] [Google Scholar]
- 5.Packer L, Kraemer K, Rimbach G. Molecular aspects of lipoic acid in the prevention of diabetes complications. Nutrition. 2001;17(10):888–895. doi: 10.1016/s0899-9007(01)00658-x. [DOI] [PubMed] [Google Scholar]
- 6.Shay KP, Moreau RF, Smith EJ, Smith AR, Hagen TM. Alpha-lipoic acid as a dietary supplement: molecular mechanisms and therapeutic potential. Biochimica et Biophysica Acta. 2009;1790(10):1149–1160. doi: 10.1016/j.bbagen.2009.07.026. [DOI] [PMC free article] [PubMed] [Google Scholar]
- 7.Ernster L, Dallner G. Biochemical, physiological and medical aspects of ubiquinone function. Biochimica et Biophysica Acta. 1995;1271(1):195–204. doi: 10.1016/0925-4439(95)00028-3. [DOI] [PubMed] [Google Scholar]
- 8.Tarnopolsky MA. The mitochondrial cocktail: rationale for combined nutraceutical therapy in mitochondrial cytopathies. Advanced Drug Delivery Reviews. 2008;60(13-14):1561–1567. doi: 10.1016/j.addr.2008.05.001. [DOI] [PubMed] [Google Scholar]
- 9.Schmelzer C, Kohl C, Rimbach G, Döring F. The reduced form of coenzyme q10 decreases the expression of lipopolysaccharide-sensitive genes in human thp-1 cells. Journal of Medicinal Food. 2011;14(4):391–397. doi: 10.1089/jmf.2010.0080. [DOI] [PubMed] [Google Scholar]
- 10.Borenfreund E, Puerner JA. Toxicity determined in vitro by morphological alterations and neutral red absorption. Toxicology Letters. 1985;24(2-3):119–124. doi: 10.1016/0378-4274(85)90046-3. [DOI] [PubMed] [Google Scholar]
- 11.Huang DW, Sherman BT, Lempicki RA. Systematic and integrative analysis of large gene lists using david bioinformatics resources. Nature Protocols. 2009;4(1):44–57. doi: 10.1038/nprot.2008.211. [DOI] [PubMed] [Google Scholar]
- 12.Vandeputte C, Guizon I, Genestie-Denis I, Vannier B, Lorenzon G. A microtiter plate assay for total glutathione and glutathione disulfide contents in cultured/isolated cells: performance study of a new miniaturized protocol. Cell Biology and Toxicology. 1994;10(5-6):415–421. doi: 10.1007/BF00755791. [DOI] [PubMed] [Google Scholar]
- 13.Wagner AE, Ernst I, Iori R, Desel C, Rimbach G. Sulforaphane but not ascorbigen, indole-3-carbinole and ascorbic acid activates the transcription factor Nrf2 and induces phase-2 and antioxidant enzymes in human keratinocytes in culture. Experimental Dermatology. 2010;19(2):137–144. doi: 10.1111/j.1600-0625.2009.00928.x. [DOI] [PubMed] [Google Scholar]
- 14.Balogh LM, Atkins WM. Interactions of glutathione transferases with 4-hydroxynonenal. Drug Metabolism Reviews. 2011;43(2):165–178. doi: 10.3109/03602532.2011.558092. [DOI] [PMC free article] [PubMed] [Google Scholar]
- 15.Moini H, Tirosh O, Park YC, Cho KJ, Packer L. R-α-lipoic acid action on cell redox status, the insulin receptor, and glucose uptake in 3T3-L1 adipocytes. Archives of Biochemistry and Biophysics. 2002;397(2):384–391. doi: 10.1006/abbi.2001.2680. [DOI] [PubMed] [Google Scholar]
- 16.Shen W, Liu K, Tian C, et al. R-α-lipoic acid and acetyl-l-carnitine complementarily promote mitochondrial biogenesis in murine 3T3-L1 adipocytes. Diabetologia. 2008;51(1):165–174. doi: 10.1007/s00125-007-0852-4. [DOI] [PubMed] [Google Scholar]
- 17.Wu Z, Puigserver P, Andersson U, et al. Mechanisms controlling mitochondrial biogenesis and respiration through the thermogenic coactivator PGC-1. Cell. 1999;98(1):115–124. doi: 10.1016/S0092-8674(00)80611-X. [DOI] [PubMed] [Google Scholar]
- 18.Duguez S, Féasson L, Denis C, Freyssenet D. Mitochondrial biogenesis during skeletal muscle regeneration. American Journal of Physiology. 2002;282(4):E802–E809. doi: 10.1152/ajpendo.00343.2001. [DOI] [PubMed] [Google Scholar]
- 19.Suh JH, Shenvi SV, Dixon BM, et al. Decline in transcriptional activity of Nrf2 causes age-related loss of glutathione synthesis, which is reversible with lipoic acid. Proceedings of the National Academy of Sciences of the United States of America. 2004;101(10):3381–3386. doi: 10.1073/pnas.0400282101. [DOI] [PMC free article] [PubMed] [Google Scholar]
- 20.Han D, Handelman G, Marcocci L, et al. Lipoic acid increases de novo synthesis of cellular glutathione by improving cystine utilization. Biofactors. 1997;6(3):321–338. doi: 10.1002/biof.5520060303. [DOI] [PubMed] [Google Scholar]
- 21.Wasserman WW, Fahl WE. Functional antioxidant responsive elements. Proceedings of the National Academy of Sciences of the United States of America. 1997;94(10):5361–5366. doi: 10.1073/pnas.94.10.5361. [DOI] [PMC free article] [PubMed] [Google Scholar]
- 22.Ernst IMA, Wagner AE, Schuemann C, et al. Allyl- butyl- and phenylethyl-isothiocyanate activate Nrf2 in cultured fibroblasts. Pharmacological Research. 2011;63(3):233–240. doi: 10.1016/j.phrs.2010.11.005. [DOI] [PubMed] [Google Scholar]
- 23.Bayram B, Ozcelik B, Grimm S, et al. A diet rich in olive oil phenolics reduces oxidative stress in the heart of SAMP8 mice by induction of Nrf2-dependent gene expression. Rejuvenation Research. 2012;15(1):71–81. doi: 10.1089/rej.2011.1245. [DOI] [PMC free article] [PubMed] [Google Scholar]
- 24.Banning A, Deubel S, Kluth D, Zhou Z, Brigelius-Flohé R. The gi-gpx gene is a target for Nrf2. Molecular and Cellular Biology. 2005;25(12):4914–4923. doi: 10.1128/MCB.25.12.4914-4923.2005. [DOI] [PMC free article] [PubMed] [Google Scholar]
- 25.McCarty MF, Barroso-Aranda J, Contreras F. The "rejuvenatory" impact of lipoic acid on mitochondrial function in aging rats may reflect induction and activation of ppar-γ coactivator-1α . Medical Hypotheses. 2009;72(1):29–33. doi: 10.1016/j.mehy.2008.07.043. [DOI] [PubMed] [Google Scholar]
- 26.Turchanowa L, Rogozkin VA, Milovic V, Feldkoren BI, Caspary WF, Stein J. Influence of physical exercise on polyamine synthesis in the rat skeletal muscle. European Journal of Clinical Investigation. 2000;30(1):72–78. doi: 10.1046/j.1365-2362.2000.00586.x. [DOI] [PubMed] [Google Scholar]
- 27.Lee NKL, Maclean HE. Polyamines, androgens, and skeletal muscle hypertrophy. Journal of Cellular Physiology. 2011;226(6):1453–1460. doi: 10.1002/jcp.22569. [DOI] [PubMed] [Google Scholar]
- 28.Childs AC, Mehta DJ, Gerner EW. Polyamine-dependent gene expression. Cellular and Molecular Life Sciences. 2003;60(7):1394–1406. doi: 10.1007/s00018-003-2332-4. [DOI] [PMC free article] [PubMed] [Google Scholar]
- 29.Carlson DA, Smith AR, Fischer SJ, Young KL, Packer L. The plasma pharmacokinetics of r-(+)-lipoic acid administered as sodium r-(+)-lipoate to healthy human subjects. Alternative Medicine Review. 2007;12(4):343–351. [PubMed] [Google Scholar]
- 30.Bhagavan HN, Chopra RK. Coenzyme q10: absorption, tissue uptake, metabolism and pharmacokinetics. Free Radical Research. 2006;40(5):445–453. doi: 10.1080/10715760600617843. [DOI] [PubMed] [Google Scholar]