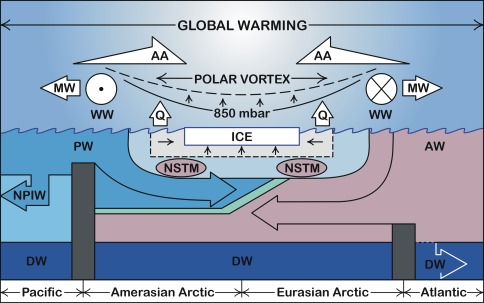
Fig. 5.
Schematic view showing the coupling of Arctic and subarctic systems under global warming. AA Arctic amplification, the 850 mbar surface is taken as representative of the Polar Vortex, WW Westerly winds, eddy flux convergence occurs along the Westerly wind maximum MW is meridional winds, Q ocean/atmospheric heat exchange, NSTM near surface temperature maximum, PW Pacific water, AW Atlantic water, NPIW North Pacific Intermediate water, DW is deep water. See text for changes and feedbacks

