

Abstract
Silica nanoparticles (SiO2) are widely used in biomedical applications such as drug delivery, cell tracking and gene transfection. The capability to control the geometry, porosity, and surface characteristics of SiO2 further provides new opportunities for their applications in nanomedicine. Concerns however remain about the potential toxic effects of SiO2 upon exposure to biological systems. In the present study, the acute toxicity of SiO2 of systematically varied geometry, porosity and surface characteristics was evaluated in immune-competent mice when administered intravenously. Results suggest that in vivo toxicity of SiO2 was mainly influenced by nanoparticle porosity and surface characteristics. The maximum tolerated dose (MTD) increased in the following order: Mesoporous SiO2 (aspect ratio 1, 2, 8) at 30 – 65 mg/kg < amine-modified mesoporous SiO2 (aspect ratio 1, 2, 8) at 100 – 150 mg/kg < unmodified or amine-modified nonporous SiO2 at 450 mg/kg. The adverse reactions above MTDs were primarily caused by the mechanical obstruction of SiO2 in the vasculature that led to congestion in multiple vital organs and subsequent organ failure. It was revealed that hydrodynamic sizes of SiO2 post protein exposure had an important implication in relating SiO2 physicochemical properties with their vasculature impact and resultant tolerance threshold, as the larger the hydrodynamic size in the presence of serum protein, the lower the MTD. This study sheds light on the rational design of SiO2 to minimize in vivo toxicity and provides a critical guideline in selecting SiO2 as the appropriate system for nanomedicine applications.
Keywords: Silica nanoparticles, mesoporous, geometry, acute toxicity
Silica nanoparticles (SiO2) are widely used in a variety of biomedical applications such as drug delivery, cell tracking and gene transfection.1-5 Recent advances in manipulating the geometry, porosity, and surface characteristics of SiO2 have further enabled their utility in nanomedicine.6-10 The variations in physicochemical characteristics play a crucial role in determining the compatibility of SiO2 with biological systems and hence their development for diagnostic or therapeutic applications.11-15 Previous studies have revealed that biodistribution of nonporous SiO2 varies according to particle size and only smaller SiO2 of 70 nm in diameter accumulated in the placenta and fetus of pregnant mice compared to 300 nm or 1000 nm nanoparticles.11 Other studies on particle size and toxicity relationship using a similar set of nonporous SiO2 demonstrated that 70 nm SiO2 induced liver injury at 30 mg/kg animal weight while 300 nm or 1000 nm SiO2 exerted no adverse effect at 100 mg/kg.12, 13 The difference in the toxicity level could be due to the differential biodistribution pattern of SiO2 in mice since studies have shown that smaller SiO2 tend to have higher accumulation in reticulo-endothelial system (RES) and caused specific organ toxicity.14 It has also been shown that surface modification of 70 nm SiO2 by either primary amine or carboxylic moieties prevent fetotoxicity even though the modified SiO2 were found in placenta and fetus of mice.11 The surface modification of SiO2 could also alleviate liver injury and avoid hepatic fibrosis.15 Thus, it is of great interest to systematically evaluate the interdependent influence of geometry, porosity, and surface functionality on in vivo toxicity of SiO2.
The relationship between biological responses from in vitro examination and those from in vivo evaluation has been less well established to date. It has been reported that non-functionalized mesoporous silicates of particle sizes 150 nm – 4000 nm, which induced more toxicity to mesothelial cells and myoblasts and less toxicity to macrophages, exhibited benign local compatibility by subcutaneous injection route, but with considerable systemic toxicity when administered by the intraperitoneal or intravenous routes in mice.16 In a previous investigation we evaluated the cellular uptake and toxicity of nonporous silica nanospheres of 115 nm in diameter, mesoporous silica nanospheres of similar size, and mesoporous silica nanorods with aspect ratios of 2, 4 and 8 as well as their cationic counterparts.17 Our in vitro observations showed that the cellular toxicity of nanoparticles are cell-type dependent and that surface characteristics and porosity govern cellular uptake rather than geometric features.17 While in vitro observations shed light on the potential influence of these physicochemical characteristics on biocompatibility in live biological systems, a thorough investigation in animals is needed to relate the observed in vitro impacts of SiO2 with in vivo outcomes.
Herein, we investigated the single-dose, acute toxicity of engineered SiO2 of distinct shapes, porosities and surface characteristics upon intravenous injection into immune-competent mice. A series of different doses were administered to identify the MTD of nonporous or mesoporous silica nanospheres, mesoporous silica nanorods of different aspect ratios as well as their cationic counterparts. Clinical observation, daily weight monitoring, hematological/blood chemistry tests, and histological examination were conducted to evaluate in vivo toxicity of SiO2 as a function of their physicochemical properties.
RESULTS
Nanoparticle Characterization
Nonporous nanospheres (Stöber), mesoporous nanospheres (Meso S), or mesoporous nanorods (short aspect ratio; AR2, and long aspect ratio; AR8) were previously synthesized and stored in ethanol.17 The pristine SiO2 of various types were further modified with (3-aminopropyl)triethoxysilane (APTES) to obtain their highly cationic counterparts (SA, MA, 2A and 8A).17 The overall physicochemical features of various SiO2 are summarized in Figure 1.17 The hydrodynamic sizes of selective spherical SiO2 (Stöber, Meso S, MA) in DI water, physiological saline and 50% serum were assessed by dynamic light scattering (DLS) to analyze the effect of porosity or surface characteristics on nanoparticle dispersive status in media. Results showed that SiO2 had good dispersivity in water or saline except that MA exhibited some degree of agglomeration in saline (Table 1) probably due to decreased electrostatic repulsion in salt solution and enhanced interaction of surface amine with salinol groups on nanoparticles.18 When incubated in 50% serum at 37 °C for 30 minutes, Meso S exhibited significantly higher hydrodynamic size than in water or saline (p < 0.001)(Table 1). This indicates that protein molecules adhered to the surface of Meso S and suggests the formation of a “nanoparticle-protein corona” upon incubation with proteins.18, 19 The hydrodynamic sizes of Stöber or MA in 50% serum were significantly lower than their sizes in water or saline (p < 0.001) (Table 1). This implied that there was limited nanoparticle association in water or saline and addition of protein molecules served as the dispersion stabilizer and resulted in a decrease in average diameter of nanoparticles.20, 21 In this case, the protein molecules were probably adsorbed onto nanoparticle surface and provided steric hinderance that potentially prevented nanoparticles from agglomorating.20, 21 To compare the hydrodynamic sizes of SiO2 in 50% serum across the board, Meso S exhibited significantly higher size than Stöber (p < 0.001), while MA possessed significanlty lower size than Meso S in 50% serum (p < 0.001) (Table 1).
Figure 1.
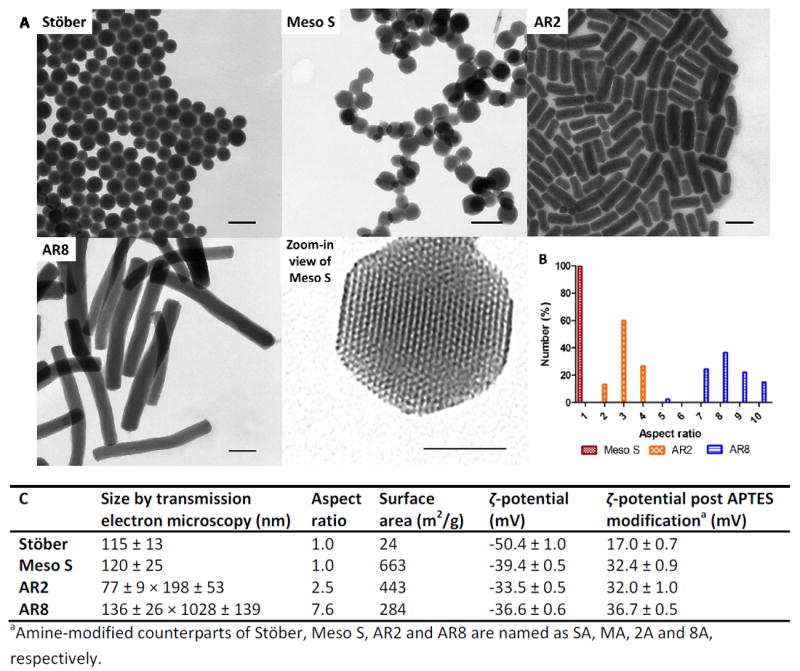
A) Transmission electron microscopy images of nonporous SiO2 (Stöber), mesoporous SiO2 (Meso S), mesoporous silica nanorods with aspect ratio 2 (AR2), mesoporous silica nanorods with aspect ratio 8 (AR8), and high resolution image of a nanoparticle from Meso S, scale bars = 200 nm except in high resolution image = 50 nm. B) The percentage distribution histogram of mesoporous SiO2 as a function of aspect ratio, C) the physicochemical characteristics of nonporous or mesoporous SiO2 before and after primary amine modification. Histogram and table were adapted from a previous article.17
Table 1.
Hydrodynamic sizes of selective spherical SiO2 in DI water, physiological saline, and 50% serum at 1 mg/mLa
| Nanoparticle | DI Water | Physiological saline | 50% serum |
|---|---|---|---|
| Stöber | 170.3 ± 0.8 | 139.6 ± 0.2 | 121.6 ± 1.6 |
| Meso S | 208.6 ± 1.2 | 200.6 ± 1.5 | 268.9 ± 6.3*** |
| MA | 206.0 ± 0.5 | 855.7 ± 2.8 | 150.3 ± 0.6### |
Data are mean ± SD (n = 3).
The hydrodynamic size of Meso S was significantly higher than that of Stöber in 50% serum (p < 0.001).
The hydrodynamic size of MA was significantly lower than that of Meso S in 50% serum (p < 0.001).
MTD Investigation
MTD is defined as the highest dose that does not cause major adverse reactions in mice over 10 days post intravenous injection.22, 23 Major adverse reactions are considered to be: immediate death, impaired mobility or irregular breathing that could not be recovered within a day, or over 10% weight loss over continuous days, or histological evidence of organ toxicity. In this study, toxic dose(s) were first reached as major adverse reactions were observed in a test group of five mice (named as M1 – M5) at that specific dose. Then the dose was reduced to a level identified later as MTD based on summarized clinical, hematological, blood chemical and histological examinations. Nanoparticle treatment administered to mice are expressed as “nanoparticle type (,) dose (mg/kg)” throughout the manuscript. The overall dosing procedure and animal response is summarized in Figure 2. The detailed record of animal adverse reactions from SiO2 dosing is shown in Supplemental Table 1.
Figure 2.
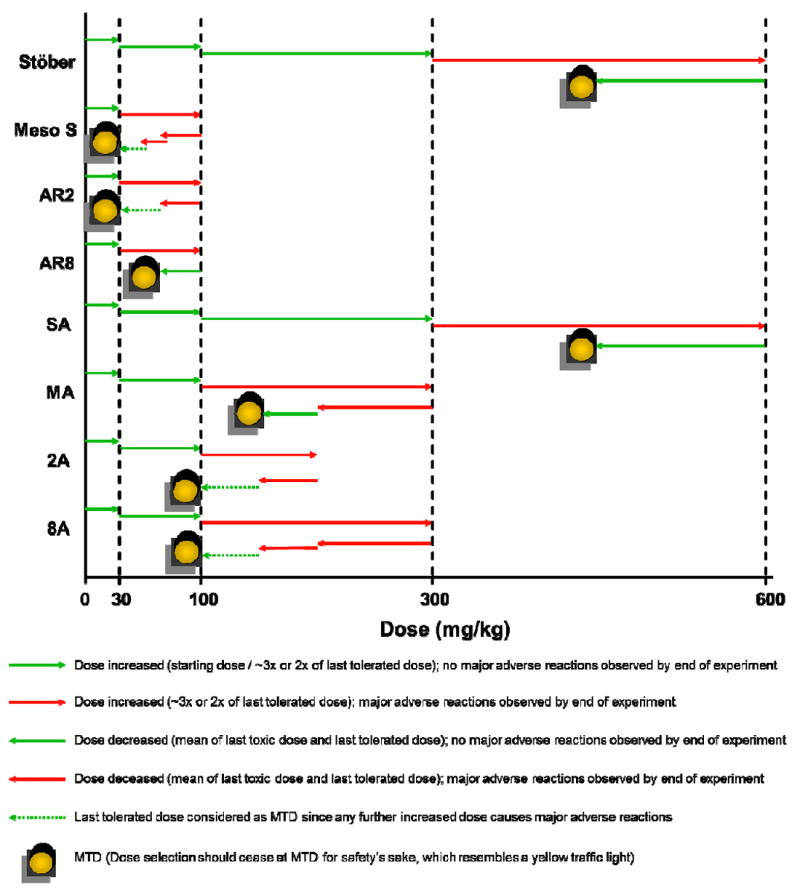
Summary of the experimental procedures and outcomes of MTD investigation of various SiO2 in mice.
The MTDs of various types of nanoparticles are summarized in Table 2. As shown, the MTDs of nonporous SiO2, either bare or amine-modified, were the highest (450 mg/kg) among all types of SiO2 studied. Mesoporous SiO2 had a remarkably low safety threshold with MTDs between 30 mg/kg to 65 mg/kg irrespective of geometrical features. Any higher doses could cause major adverse reaction, which was reported by previous studies that animals had immediate death post intravenous injection of mesoporous SiO2 at 6 mg/mouse (approximately 240 mg/kg).16 Toxicity was alleviated by modifying mesoporous SiO2 with primary amine groups, resulting in a 2-3 fold increase in MTDs to 100 – 150 mg/kg. For the animals which survived treatment, they showed normal weight gain 10 days post injection (Supplemental Figure 1) and there was no clinical difference in organ weight percentages between treatment groups and the control group (Supplement Figure 2).
Table 2.
MTDs of SiO2 with engineered physicochemical characteristics and the major affected organs, and the associated adverse reactions in mice post intravenous injection at toxic doses
| Treatment | MTD (mg/kg) | Major affected organ(s) above MTD | Main adverse reaction(s) above MTD |
|---|---|---|---|
| Stöber | 450 | Heart, lung, spleen | Thrombosis on endocardium or in lung, anemia |
| Meso S | 30 | Kidney | Renal congestion |
| AR2 | 30 | Kidney | Renal congestion |
| AR8 | 65 | Kidney | Renal congestion |
| SA | 450 | Lung, kidney | Pulmonary and renal congestion |
| MA | 150 | Lung, kidney | Pulmonary and renal congestion |
| 2A | 100 | Lung, kidney | Pulmonary and renal congestion |
| 8A | 100 | Lung, kidney | Lung thrombosis and renal congestion |
Hematology and Blood Chemistry
In order to gain comprehensive understanding about nanoparticle impact in vivo, blood was collected after animal termination for the diagnosis of SiO2 toxicity. Major hematology markers from the whole blood, including erythrocyte count, platelet count, total leukocyte count, and hemoglobin level were measured in complete blood count analysis. Kidney and liver functions were evaluated in the blood chemistry analysis. Renal function was examined by blood urea nitrogen and creatinine concentrations, while liver function was tested through plasma levels of albumin, aspartate aminotransferase, alanine aminotransferase, and total bilirubin. Globulin level was measured as a potential indicator of an immune reaction as the increase in both total leukocyte count and globulin concentration reflected the onset of inflammation. Animals that survived showed no significant changes in blood counts or blood biochemical indices between SiO2 treatment groups at all doses tested and the control groups (p > 0.05) (Figure 3-4, Supplemental Figure 3-4), except that animals that survived from AR8 100 mg/kg showed significantly higher total bilirubin concentration than controls (p < 0.05) (Figure 3I), or animals dosed with Stöber at 600 mg/kg had significantly lower hemoglobin level (p < 0.001) (Figure 4D) coupled with significantly higher alanine aminotransferase concentration than controls (p < 0.001) (Figure 4H). Stöber caused hematological toxicity or hepatocellular injury at the high dose of 600 mg/kg. All surviving animals from the entire study had less than 0.2 mg/dL creatinine level upon euthanasia, indicating normal kidney function.
Figure 3.
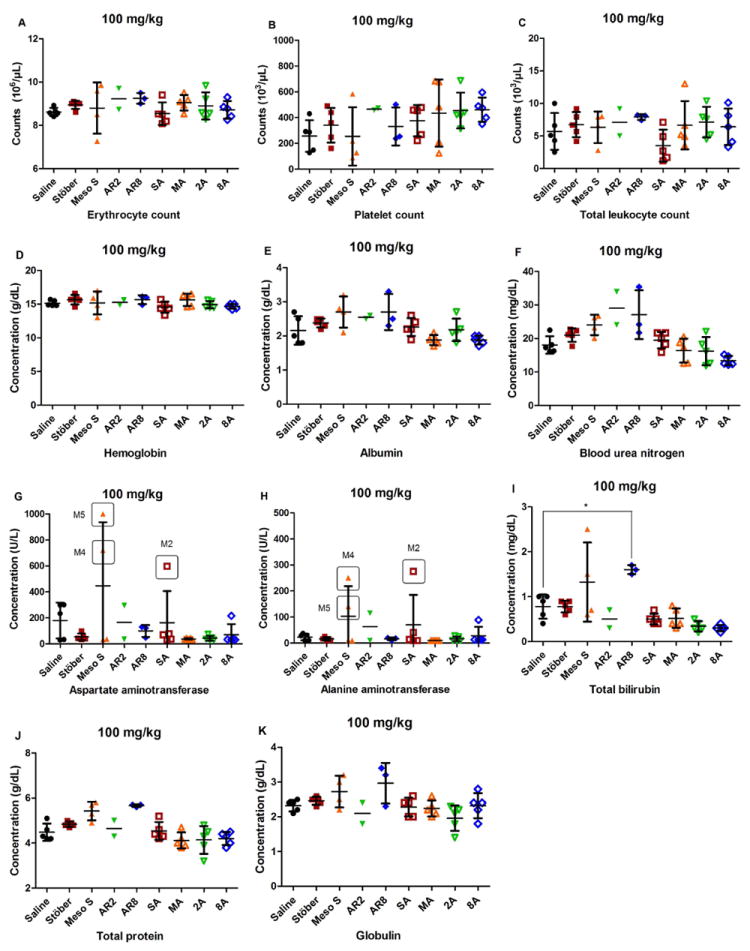
Blood counts (A-D) and blood chemistry (E-K) of animals treated at the dose of 100 mg/kg. No statistically significant changes were observed between each SiO2 treatment group and the control, expect that the surviving animals from AR8 100 mg/kg exhibited a significant increase in total bilirubin concentration compared with the control (*p < 0.05). There were individual animals (Meso S 100 M4, M5 or SA 100 M2) which exhibited elevated aspartate aminotransferase or alanine aminotransferase levels (value circled with animal identity shown).
Figure 4.
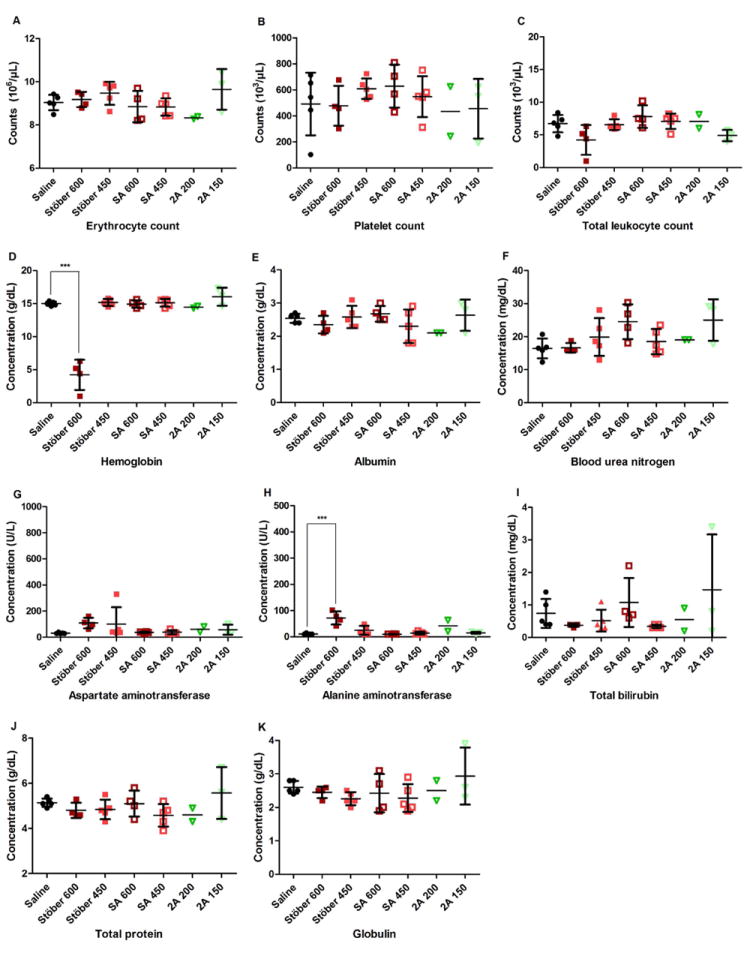
Blood counts (A-D) and blood chemistry (E-K) of animals treated at indicated dose. No significant changes were observed between each SiO2 treatment group and the control, except that the surviving animals from Stöber 600 mg/kg showed significant decrease in hemoglobin concentration (***p < 0.001) and significant increase in alanine aminotransferase level (***p < 0.001) compared with the control.
Among animals showing adverse reactions, renal compromise was the major abnormality of animals treated with mesoporous SiO2 (Meso S, AR8) or MA as indicated by dramatically increased blood urea nitrogen level (> 140 mg/dL versus 18 ± 3 mg/dL in control) or creatinine concentration (2 - 2.4 mg/dL versus < 0.2 mg/dL in control) (Table 3). Coupled with increased kidney weight percentages (0.99% - 1.19% versus 0.66 ± 0.01% in control), it suggests that the kidney was the target organ of mesoporous SiO2 intravenous toxicity, irrespective of geometrical features or surface characteristics (Table 3). There was an increase in liver weight percentage across the board for mesoporous SiO2 treatments (5.75% - 6.37% versus 4.41 ± 0.19% in control) (Table 3). Combining the significantly increased total bilirubin concentrations in animals from AR8 100 mg/kg (p < 0.05) (Figure 3I), it seems that liver function was affected by exposure to mesoporous SiO2. No inflammatory responses were observed in the animals showing acute toxicity as the total leukocyte counts remained in the normal range (Table 3).
Table 3.
Hematological and blood chemical indices of selected mice which exhibited major adverse reactions post intravenous injection of SiO2 at toxic doses and the organ weight percentages and weight changes upon necropsy of each mouse
| Treatment | Saline * | Meso S | AR2 | AR8 | MA |
|---|---|---|---|---|---|
| Animal identity | 100 mg/kg, M2 | 100 mg/kg, M4 | 100 mg/kg, M5 | 300 mg/kg, M2 | |
| Complete blood count | |||||
| Erythrocyte count (106/μL) | 8.62 ± 0.18 | 7.25 | 5.34 | 8.51 | 8.00 |
| Platelet count (103/μL) | 257 ± 123 | 163 | 139 | 262 | 319 |
| Total leukocyte count (103/μL) | 5.7 ± 2.8 | 2 | 1.9 | 3.1 | 2.7 |
| Hemoglobin (g/dL) | 15.1 ± 0.4 | 13.9 | 15.9 | 15.6 | 14.1 |
| Blood chemistry | |||||
| Kidney function | |||||
| Blood urea nitrogen (mg/dL) | 18 ± 3 | >140 | n/a | >140 | >140 |
| Creatinine (mg/dL) | <0.2 | 2.4 | n/a | 2 | 2.2 |
| Liver function | |||||
| Albumin (g/dL) | 2.2 ± 0.4 | 1.3 | n/a | 1.5 | 2.2 |
| Aspartate aminotransferase (U/L) | 179 ± 138 | 243 | n/a | 162 | 334 |
| Alanine aminotransferase (U/L) | 32 ± 5 | 23 | n/a | 20 | 129 |
| Total bilirubin (mg/dL) | 0.8 ± 0.3 | 1.1 | n/a | 1.3 | 1.8 |
| Other biomarkers | |||||
| Globulin (g/dL) | 2.3 ± 0.2 | 4.1 | n/a | 3.6 | 3.3 |
| Total protein (g/dL) | 4.5 ± 0.4 | 5.4 | n/a | 5.1 | 5.5 |
| % Body weight | |||||
| Heart | 0.49 ± 0.05 | 0.43 | 0.59 | 0.44 | 0.44 |
| Liver | 4.41 ± 0.19 | 5.94 | 6.37 | 5.75 | 4.70 |
| Spleen | 0.32 ± 0.04 | 0.28 | 0.34 | 0.36 | 0.26 |
| Lung | 0.81 ± 0.06 | 0.55 | 0.99 | 1.04 | 0.83 |
| Kidney | 0.66 ± 0.01 | 0.99 | 1.06 | 1.19 | 1.13 |
| % Normalized weight upon death | 3.50 ± 2.44 | -8.52 | -4.43 | -4.18 | -4.16 |
Data were mean ± SD (n = 5) from the control group for 100 mg/kg dose phase.
Histological Examination
In order to obtain accurate diagnosis of SiO2 toxicity on a microscopic level, major organs from animals were subject to histological evaluation. Compared with control animals that received saline (Figure 5), the animals treated with nonporous SiO2 (Stöber) at a high dose of 600 mg/kg developed thrombosis on the endocardium of the heart (Figure 6A, Supplemental Figure 5A). Extensive lung hemorrhage was also observed (Figure 6D). The presence of macrophages with light bluish grey cytoplasm suggests that SiO2 uptake was detected in the spleen and liver (Supplement Figure 5B-C). Since animals of this group also showed significantly increased alanine aminotransferase level in the plasma (p < 0.001) (Figure 4H), it could be deducted that these animals experienced moderate liver dysfunction. This may be induced by nanoparticle accumulation or by the secondary effect of obstructive damage to the circulatory and respiratory systems (mainly heart and lung) by Stöber.
Figure 5.
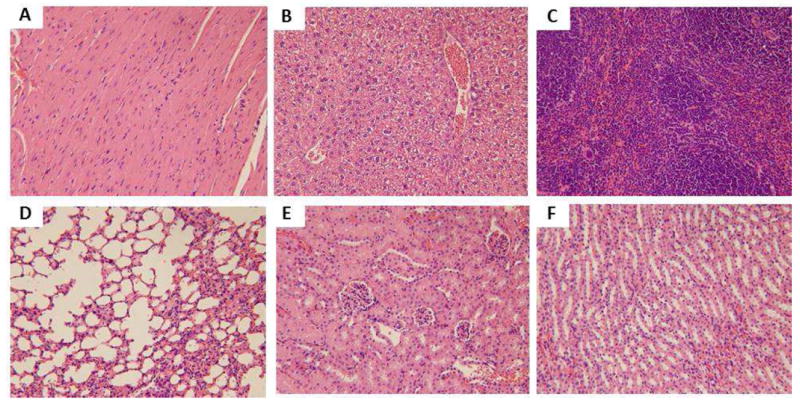
Light microscopic analysis of organs recovered from control group: A) heart, B) liver, C) spleen, D) lung, E) kidney (glomeruli), F) kidney (tubules). All H&E staining images were 200× the original magnification.
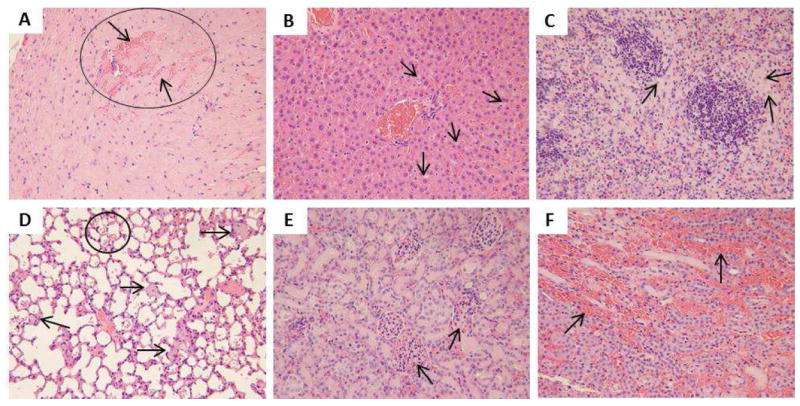
Figure 6.
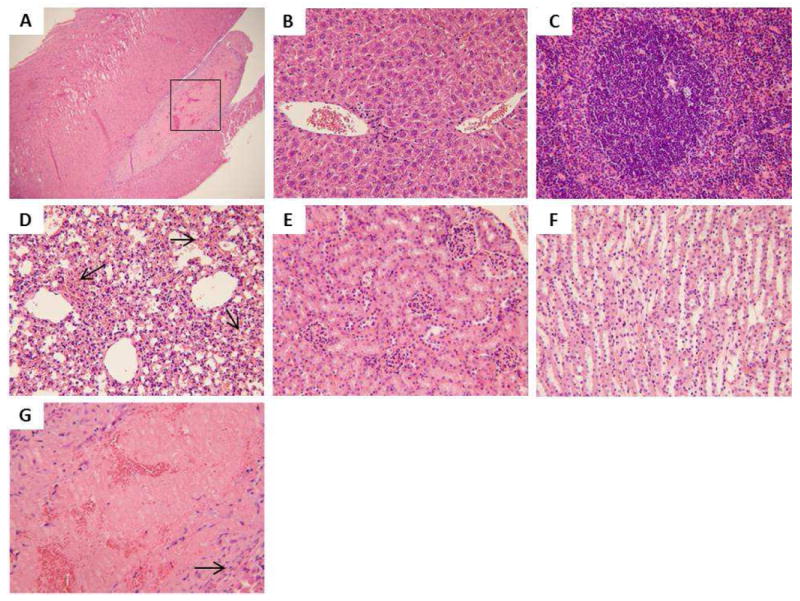
Light microscopic analysis of organs recovered from Stöber 600 mg/kg M2: A) heart (40×), rectangle box indicates the area that is amplified and shown in G, B) liver, C) spleen, D) lung, arrows indicate hemorrhage into the alveoli, E) kidney (glomeruli), F) kidney (tubules), G) heart. The arrow indicates fibrosis layer organized around the thrombus. All H&E staining images were 200× the original magnification except A (40×).
Mesoporous SiO2, irrespective of the geometrical features, caused vascular congestion in viscera of mice at the dose of 100 mg/kg (Figure 7-8, Supplemental Figure 6, 8, 10), especially in the medullary interstitium of the kidney (Figure 7F, 8F, Supplemental Figure 8F). This change corresponded with elevated levels of renal biomarkers from these animals (Table 3). It could be due to compromised blood flow in vasa recta which makes the renal interstitium a likely location for thrombosis.4 Calcium deposition was observed as intense blue staining in the cortex in one animal (M1) from AR2 65 mg/kg treatment (Supplemental Figure 9E). This indicates that kidney damage occurred, therefore 65 mg/kg was ruled out as MTD and the lower dose of 30 mg/kg was determined to be MTD for AR2. No histological abnormality was found in major organs of the animal (M1) from Meso S 30 mg/kg treatment (Supplemental Figure 7) and thus 30 mg/kg was still considered as the MTD for Meso S.
Figure 7.
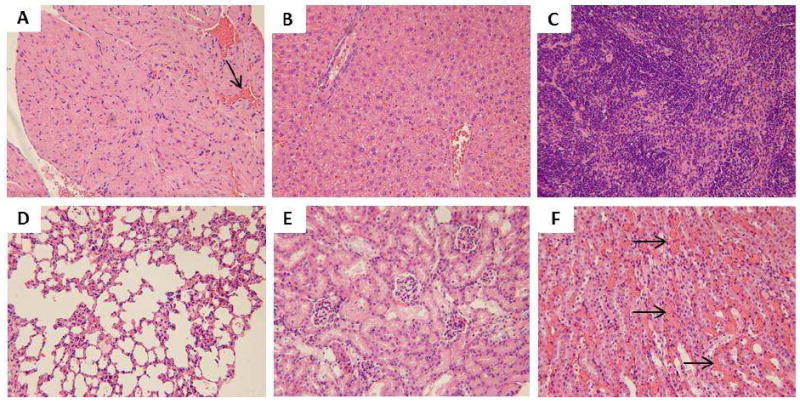
Light microscopic analysis of organs recovered from Meso S 100 mg/kg M2: A) heart, arrow indicates the congestion in the capillary, B) liver, C) spleen, D) lung, E) kidney (glomeruli), F) kidney (tubules), arrows indicate vasa recta congestion. All H&E staining images were 200× the original magnification.
Figure 8.
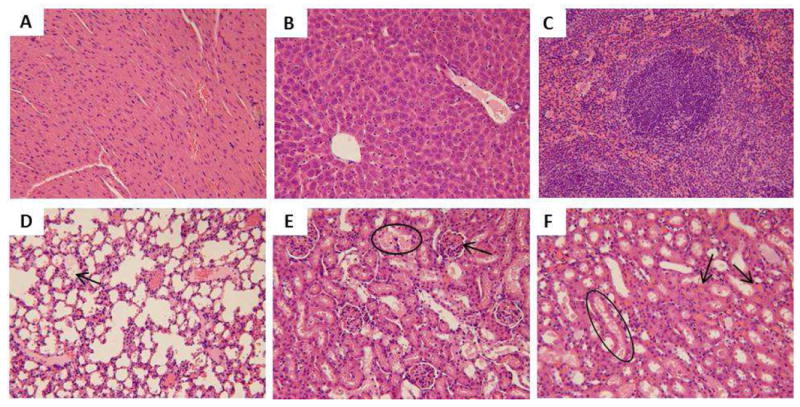
Light microscopic analysis of organs recovered from AR8 100 mg/kg M5: A) heart, B) liver, C) spleen, D) lung, arrow indicates lung edema, E) kidney (glomeruli), circle indicates the tubule that went through degeneration with protein seen in the tubule, arrow indicates congestion in the glomerulus, F) kidney (tubules), circle indicates the degeneration in the tubule with protein seen in the tubule, arrows point to the congestion in the renal interstitium. All H&E staining images were 200× the original magnification.
Amine-modified nonporous or mesoporous SiO2 caused hemorrhage or congestion in the lung and kidney (Figure 9-10, Supplemental Figure 11-12). Pulmonary embolism was observed in the lung in animal M2 from MA 300 mg/kg which was sacrificed 22 hours post injection due to acute adverse reactions (Figure 10G). The histological examination confirmed the onset of lung thrombosis with renal congestion (Figure 10D, F). One mouse (M1) from 8A 300 mg/kg died immediately post injection and pulmonary embolism was observed upon necropsy with confirmation by histologic observation of pulmonary congestion with additional symptoms of kidney congestion (Supplemental Figure 12). The presence of macrophages with light bluish grey cytoplasm in the liver or spleen indicated the association of amine-modified SiO2 with RES in these organs (Figure 9-10). In the animals treated with amine-modified SiO2 at high doses, the color of red pulp in the spleen turned from pinkish red to light blue, probably because of the extensive association of amine-modified SiO2 with macrophages (Figure 9C, 10C).
Figure 9.
Light microscopic analysis of organs recovered from SA 600 mg/kg M3: A) heart, the circle refers to hemorrhage into the cardiac muscle, the arrow on top indicates the hemorrhage that separates the cardiac fiber, the arrow below indicates the cardiac fiber surrounded by the hemorrhage, B) liver, C) spleen, arrows in B and C indicate macrophages with light bluish grey cytoplasm implying SiO2 internalization, D) lung, arrows indicate bluish grey congestion in the capillary suggesting SiO2 presence and the circle encloses the hemorrhage in alveoli, E) kidney (glomeruli), arrows indicate congestion in the glomeruli, F) kidney (tubules), arrows indicate hemorrhage into renal interstitium. All H&E staining images were 200× the original magnification.
Figure 10.
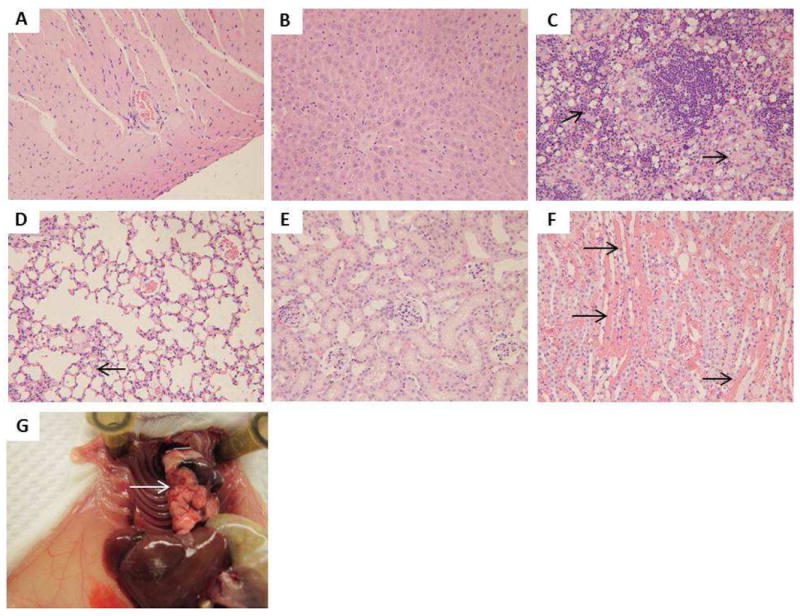
Light microscopic analysis of organs recovered from MA 300 mg/kg M2: A) heart, B) liver, C) spleen, arrows point to macrophages with light bluish grey cytoplasm indicating SiO2 uptake, D) lung, the arrow indicates congestion in the capillary, E) kidney (glomeruli), F) kidney (tubules), arrows indicate intra-vasculature congestion. G) Pulmonary embolism (pointed by the arrow) was observed upon necropsy of this animal. All H&E staining images were 200× the original magnification.
In sum, histological examination demonstrated that there was minimum cellular toxicity that occurred in major organs (heart, liver, spleen, lung, and kidney). Lesions were mainly associated with mechanical obstruction in the vasculature upon intravenous injection of various SiO2 which resulted in congestion in major organs and consequently led to organ failure and life termination. At the MTD or even lower doses of each type of nanoparticle, no pathologic changes were found in major organs of SiO2 treatment groups compared with control groups, including individual animals (8A 30 mg/kg M2, SA100 mg/kg M2, SA 300 mg/kg M1) which showed moderate liver enzyme level increase in plasma (Figure 3G-H, Supplemental Figure 3G-H, 4G-H). The major adverse reactions to intravenous injection of various SiO2 at toxic doses are summarized in Table 2.
Calculation of Dose Equivalents at MTD
Table 4 lists the dose equivalents of nanoparticles calculated on the basis of mass, total surface area, external surface area, total nanoparticle number, or total nanoparticle volume normalized to the animal weight.17 It can be observed that dosing based on a total surface area was the most relevant parameter in evaluating the MTD of nanoparticles administered by the intravenous route since the variation of MTD equivalent dose expressed as total surface area per kilogram was the lowest (27%) among the five dose equivalents. This agreed well with previous studies indicating that similar gene expression changes in cell culture31 or similar toxicity thresholds to liver in mice13 were achieved for nonporous SiO2 of different sizes dosed on an equivalent surface area basis. In our case, reaching MTD, as the common biological outcome, has been achieved for SiO2 of different porosities or geometrical features that were dosed on an equivalent total surface area basis of 15.6 ± 4.3 m2/kg animals.
Table 4.
The dose equivalents of nanoparticles at MTD on the basis of mass, total surface area, external surface area, total number, or total volume
| Treatment | Mass (mg/kg) | Total surface area (m2/kg) | External surface area (m2/kg) | Total number (× 1013/kg) | Total volume (× 10-2 cm3/kg) |
|---|---|---|---|---|---|
| Stöber | 450 | 10.8 | 10.8 | 25.6 | 20.5 |
| Meso S | 30 | 19.9 | 3.2 | 3.0 | 3.3 |
| AR2 | 30 | 13.3 | 3.0 | 4.2 | 3.2 |
| AR8 | 65 | 18.4 | 3.0 | 0.4 | 4.7 |
| AVG | 143 | 15.6 | 5.0 | 8.3 | 7.9 |
| ST | 204 | 4.3 | 3.8 | 11.6 | 8.4 |
| % | 142 | 27 | 76 | 140 | 106 |
DISCUSSION
Toxicity profile of SiO2 is a crucial factor in determining their potential application in nanomedicine. In this paper, we investigated the single-dose, acute toxicity of engineered SiO2 of various shapes, porosities and surface characteristics upon intravenous injection to immune-competent mice. In order to explain the difference in MTD and to relate it with SiO2 physicochemical properties, representative spherical SiO2 were incubated with 50% serum at 1 mg/mL for 30 minutes at 37 °C to evaluate the hydrodynamic size changes by DLS measurement. 50% serum was used to mimic in vivo protein environment when nanoparticles were exposed to circulation system. SiO2 concentration 1mg/mL was equivalent to initial blood concentration achieved at 100 mg/kg dose (Supplemental Calculation 1), which led to drastic difference in animal response to intravenous injection of various SiO2. Since SiO2 exhibited a relatively fast blood clearance and majority of SiO2 were removed from circulation in several minutes, incubation time of SiO2 in serum was chosen at 30 minutes to reflect the time length most SiO2 interacted with serum protein before they were taken up by the RES system. Stöber exhibited the smallest hydrodynamic size post serum incubation, which was related to highest MTD in vivo among all SiO2 tested. Meso S showed the largest hydrodynamic size post protein exposure. This could explain that it easily caused vasculature congestion in major organs at a low dose as confirmed by histological examination, leading to the lowest MTD. The cationic MA, amine-modified counterpart of Meso S, had significantly lower hydrodynamic size than Meso S (p < 0.001), leading to onset of vessel congestion only at higher dose and several folds increase in MTD. It should be noted that slight agglomeration of MA was observed in saline. However, the agglomerates were dissociated when MA from the same saline stock was diluted in 50% serum probably due to steric stabilization by protein adsorption. Nevertheless, injecting MA in saline might lead to congestion in vasculature because of lack of protein stabilization especially at higher doses of MA. This could possibly explain why the MTD of MA was several fold lower than that of Stöber even when their sizes in protein solution were similar. Overall porosity and surface characteristics of SiO2 were the major factors that determined hydrodynamic size change post protein adsorption, the related vasculature impact and in vivo tolerance threshold.
Differential patterns of toxicity in major organs were observed in animals probably due to varied physicochemical characteristics of SiO2 combined with physiological traits of different organs. When administered through tail vein, nanoparticles were rushing through inferior vena cava to the heart resulting in damage to the endocardium of heart leading to a series of cardiovascular complications,24 such as thrombosis as found in nonporous Stöber treated animals at high dose. Lung is the following organ which receives 100% cardiac venous output and serves as a first-pass filter capillary bed for foreign bodies.25 Any aggregation of nanoparticles formed in the blood can then cause obstruction in the capillaries of the lung, resulting in acute embolism.25 Injection of MA, 2A and 8A at high doses often led to acute death in animals in such a manner. After traversing the lung, the oxygenated blood with SiO2 returned to the heart and was distributed to the whole body. In this process, the kidney is likely the most vulnerable organ to SiO2 exposure among five major organs examined probably because of its specialized vasculature organization. As a selective blood filter, kidney receives 20% of the cardiac output and compromising the blood flow in vasa recta in renal interstitium will lead to congestion upon exposure to mesoporous SiO2, which showed larger hydrodynamic size in the presence of protein or amine-modified SiO2. The renal congestion leads to onset of renal failure, a consequence which was observed in mesoporous SiO2 or amine-modified SiO2 treated mice. Liver and spleen were the major sites where the majority of SiO2 eventually was collected by regardless of variation in physicochemical properties because of the abundant blood supply and the major presence of RES in these organs.14, 26 It must be noted that animals from Stöber 600 mg/kg treatment experienced splenomegaly (Supplemental Figure 2R) and anemia (Figure 4D) simultaneously. Histological examination revealed that this concurrence could be due to infiltration and hyperplasia of macrophages in the spleen (Supplemental Figure 5C). The macrophage hyperactivity could be linked to anemia through one or more of the following mechanisms: a) displacement of the hematopoietic centers in the spleen results in less erythrocyte production, b) physical spleen enlargement entraps more erythrocytes as the blood passes through the spleen, c) SiO2 engulfment by splenic macrophages could result in hyperactivity in phagocytosis from macrophages at all locations of spleen, or d) a combination of two or more mechanisms mentioned above. Thus, SiO2 exposure could lead to hepatic or splenic toxicity at high dose. In all, results set caution for developing SiO2 as a functional carrier in a drug or biological delivery system, especially for nonporous SiO2 as heart disease targeted system27 or for mesoporous SiO2 as intravascular delivery system.28 Understanding how variations in multiple critical physicochemical factors influence toxicity helps establish guidelines for selecting appropriate compositions and properties of SiO2 to improve biocompatibility and maximize its potential utility in nanomedicine applications.
Since most of the nanoparticle toxicity found in this study was related to vasculature damage, it was expected that toxicity could also be due to interaction of nanoparticles with endothelium that lines the entire circulatory system. It was reported that nonporous SiO2 caused toxicity in primary endothelial cell culture in 24 hours at concentrations higher than 100 μg/ml.29 Interaction of nanoparticles with macrophages could also play an important role in affecting the organ toxicity level as reflected in previous studies that demonstrated that inhibition of phagocytosis of Kupffer cells elevated the liver injury by 70 nm nonporous SiO2.12 Our previous study showed that there was a concentration threshold of safety for SiO2 of various physicochemical properties on macrophages such that above the concentration of 100 μg/ml SiO2 tended to cause cellular toxicity in macrophages post 24 hour incubation.17 In this study, assuming the density of animal tissue is equivalent to water (1 g/cm3),30 the nanoparticle dose mg/kg could be converted to mg/1000 cm3 or μg/mL to relate the in vivo results with in vitro observations. In this case, at the tested toxic dose of Meso S, AR2, and AR8 (i.e. 100 mg/kg), toxicity was most likely due to vasculature obstruction since toxicity on endothelial cells or macrophages should be limited at this concentration within the time frame (one day) in animals. For amine-modified mesoporous nanoparticles (MTDs 100 -150 mg/kg), the toxicity that was immediately observed at the doses above MTDs was basically because of pulmonary obstruction by clinical observation, while the toxicity that was found in animals at extended time points (one day or more) could be partially derived from endothelium or macrophage dysfunction due to nanoparticle exposure above 100 μg/mL. For Stöber or SA, the toxicity at the dose (600 mg/kg) above MTDs could possibly be due to vasculature compromise as well as endothelial cell and macrophage toxicity (600 μg/mL). Liu et. al. reported that nonporous SiO2 given through intravenous route were associated with increased risk of cardiovascular diseases, i.e. atherosclerosis and thrombosis, by inducing endothelial cell dysfunction through oxidative stress via JNK/p53 pathways.29 Our result supports this prediction that SiO2 lead to the onset of vascular diseases besides other organ toxicities in vivo.
Surface area of engineered particles has shown to play a crucial role in determining their biological activity.32, 33 For nanosized particles, the increased surface area per mass compared with large particles could induce greater biological interaction, which could be either desirable (e.g. loading capacity of therapeutics) or detrimental (e.g. toxicity, cell dysfunction).32 Our study revealed that given the same surface characteristics and bulk chemical composition, the total surface area of SiO2 per mass is the most relevant factor that determines the MTD of SiO2 in animals. The MTD of Stöber was surprisingly close to the maximum safety dose (500 mg/kg) of the mesoporous hollow silica nanoparticles (MHSNs, ca. 110 nm in diameter) as determined in their dose escalation study.34 MHSNs were produced by a modified Stöber method and the surface of MHSNs should resemble Stöber used in our study except that irregular pores was present on the surface with amine groups extending out from inner cavity to produce a high cationic charge.8 Although MHSNs possessed higher surface area per mass, they still had a high MTD which could probably be due to the different surface characteristics mentioned above. This indicates that porosity and surface characteristics are the crucial factors in determining the toxicity of SiO2 in vivo as reflected by MTD, and the equivalent total surface area dosing strategy should be applicable to SiO2 without presence of functional silane on the surface.
CONCLUSION
Of the materials studied here, nonporous SiO2 sized 120 nm exhibited low systemic toxicity and highest MTDs of 450 mg/kg before or after primary amine modification when exposed intravenously to animals. Mesoporous SiO2 exerted considerable systemic toxicity with MTDs ranging from 30 – 65 mg/kg, irrespective of the geometrical features. However, toxicity was attenuated when mesoporous SiO2 were modified with primary amine functionalities, which led to the increased MTDs of 100 – 150 mg/kg. In vivo toxicity of SiO2 was mostly influenced by nanoparticle porosity and surface characteristics, and was primarily associated with vasculature obstruction as a consequence of SiO2 protein interaction and change in hydrodynamic size in the serum. Dosing SiO2 on an equivalent total surface area basis could achieve a common mode of action as was quantitated as MTD here. Further studies will be focusing on the pharmacokinetics and tissue distribution of SiO2 with distinct physicochemical features to provide confirmative evidence about the origin of organ-associated toxicity.
METHODS
Materials
Nonporous or mesoporous SiO2 with distinct geometrical features or drastically different surface characteristics were prepared as reported previously.17 Briefly, mesoporous SiO2 of different shapes were synthesized by the surfactant template-aided, modified Stöber method and were subject to surfactant removal by acid extraction. The SiO2 produced were then modified with APTES in anhydrous ethanol to obtain their highly cationic counterparts. Multiple transmission electron microscopy images were taken to calculate the sizes of SiO2 of a specific type and a representative picture from each type is shown in Figure 1A. The overall physicochemical parameters of various types of SiO2 are summarized in Figure 1B-C.17
Nanoparticle Characterization and Formulation Preparation
Hydrodynamic sizes of SiO2 in DI water, physiological saline and 50% fetal bovine serum in saline were measured on a Malvern Zetasizer Nanoseries equipped with a back-scattering detector (173 degrees). Various SiO2 were stored in ethanol and were washed extensively with ethanol and DI water. SiO2 were resuspended in water or saline to make highly concentrated stocks. Then nanoparticles were diluted in water or saline to 1 mg/mL at room temperature and their sizes measured by DLS. SiO2 from saline stock were diluted in 50% serum (prewarmed to 37 °C) to 1 mg/mL and were incubated at 37 °C for 30 minutes followed by equilibration to room temperature (typically 5 minutes) before the measurements were taken.35 To prepare SiO2 injectable formulation, the nanoparticles were diluted in saline to a specific concentration, vortexed and sonicated, and were loaded into a 1 mL syringe under sterile conditions immediately before injection.
Animals
All animal experiments were performed in compliance with the University of Utah Institutional Animal Care and Use Committee. Six to eight week old female CD-1 mice were purchased from Charles River Laboratories, and were housed in a group of five in standard cages with free access to food and water and were subject to 12 hour light/dark cycle. All animals were acclimated to the animal facility for at least one week prior to experimental procedures. CD-1 mice have an intact immune system and were expected to react to nanoparticle exposure in a closer manner as in humans.
MTD Investigation
Animals were received in standard cages from animal facility with five mice per cage. These cages were randomly assigned to treatment groups with one cage per treatment and the animal in each cage were randomly numbered as M1- M5. SiO2 were suspended in sterile saline and injected through the tail vein in 200 μL suspension per mouse. Injections of sterile saline at equivalent volumes were also given to mice as controls for each dose phase. The starting dose administered into mice was chosen to be 30 mg/kg. If major adverse reactions were not observed in all five animals within 10 days, the next dose level (100 mg/kg) was applied to a new group of mice and so forth. Animals that survived were euthanized by CO2 asphyxiation at end of 10 days and the blood and tissues were collected. If major adverse reactions in animals were identified at a certain dose (toxic dose) within 10 days, a decreased dose (usually the mean value between toxic dose and last tolerated dose) was used and so forth. Animals (one or more) may have shown the onset of major adverse reactions even before five animals in the same group were all injected. When this occurred, no more animals were injected and there were less than five animals in this treatment. Animals that showed major adverse reactions were immediately euthanized, and blood and tissues were collected for analysis subsequently. If the dose was reduced to a level that no major adverse reactions were observed in all five animals for 10 days, then this dose was identified as a survival dose. Histological evidence of organ damage and abnormal values of hematological/blood chemical indices, organ weight ratios, and body weight changes, were also considered as evidence of major toxicity in mice. If such major toxicity was absent in animals from the survival dose, the survival dose was then considered as the MTD. Otherwise, a further decreased dose was selected until all major toxicities mentioned above were absent in all five animals subject to a specific dose, which was identified as the MTD.
Hematology and Blood Chemistry
Blood was withdrawn from the inferior vena cava immediately following euthanasia or animal death. The collected blood was stored in heparin-coated centrifuge tubes, the blood counts were measured within four hours post collection, and plasma chemistry determinations were made on the same day of blood collection. In the blood count analysis, major hematology markers from the whole blood, namely, erythrocyte count, platelet count, total leukocyte count, and hemoglobin level were measured on a CBC-DIFF Instrument (Heska, Loveland, CO). In the blood chemistry analysis, blood samples (about 0.3 – 0.7 ml each mouse) were briefly centrifuged at 1000 rpm for 2 minutes to obtain plasma. Liver function indicators (albumin, aspartate aminotransferase, alanine aminotransferase, and total bilirubin), renal function indicators (blood urea nitrogen and creatinine), globulin and total protein levels were tested using a DRI-CHEM (Heska, Loveland, CO) veterinary blood chemistry analyzer.
Animal Weight and Organ Weight Measurement
The animals which survived the injections of nanoparticles were weighed on a daily basis. Vital organs including heart, liver, spleen, lung, and kidney were excised and weighed post necropsy. The normalized weight percentages of heart, liver, spleen, lung or kidney were calculated as the ratio of wet tissue weight over total body weight.
Histological Examination
All the organs recovered from necropsy, including heart, liver, spleen, lung and kidney, were fixed in 10% formalin in PBS solution and stored at 4 °C. The tissues were embedded in paraffin blocks, sliced, and placed onto glass slides. The slides were stained with hematoxylin and eosin (H&E). The histological examination was performed by a pathologist who was unaware of the treatment modalities of each animal, and images were taken using a light microscope (Olympus, BH-2).
Calculation of Dose Equivalents at MTD
The dose equivalents of nanoparticles at MTD on the basis of mass, total surface area, external surface area, total number, or total volume were calculated as shown below:
Total surface area of SiO2 at MTD (m2/kg animals) = MTD (mg/kg) / 1000 × Total surface area of SiO2 (m2/g nanoparticles).
External surface area of SiO2 at MTD (m2/kg animals) = MTD (mg/kg) / 1000 × External surface area of SiO2 (m2/g nanoparticles).
Total number of SiO2 at MTD (nanoparticles/kg animals) = MTD (mg/kg) / 1000 × Number of SiO2 (nanoparticles/g nanoparticles).
Total volume of SiO2 at MTD (cm3/kg animals) = Total number of SiO2 at MTD (nanoparticles/kg animals) × Volume of a nanoparticle (cm3/nanoparticle)
Statistical Analysis
Multi-group comparisons of the means were carried out by one-way analysis of variance (ANOVA) test using Graphpad Prism. Statistical significance for all tests was set at p < 0.05. Results are expressed as mean ± standard deviation (n = 3-5).
Supplementary Material
Acknowledgments
We would like to acknowledge Shanshan Liu and Jinping Guo at University of Utah for advising on histological sample analysis, Yongjian Wang for assistance in euthanizing animals, and Robert Price for assistance in setting up hematological analysis equipment for this study. Financial support was provided by the NIH (R01 DE19050) and the Utah Science Technology and Research (USTAR) Initiative.
Footnotes
Supporting Information Available: Supplemental Table 1, Supplemental Figure 1-12, and Supplemental Calculation 1 are available free of charge via the Internet at http://pubs.acs.org.
References
- 1.Slowing II, Vivero-Escoto JL, Wu CW, Lin VS. Mesoporous Silica Nanoparticles as Controlled Release Drug Delivery and Gene Transfection Carriers. Adv Drug Deliv Rev. 2008;60:1278–1288. doi: 10.1016/j.addr.2008.03.012. [DOI] [PubMed] [Google Scholar]
- 2.He Q, Shi J. Mesoporous Silica Nanoparticle Based Nano Drug Delivery Systems: Synthesis, Controlled Drug Release and Delivery, Pharmacokinetics and Biocompatibility. J Mater Chem. 2011;21:5845–5855. [Google Scholar]
- 3.Vivero-Escoto JL, Slowing II, Trewyn BG, Lin VS. Mesoporous Silica Nanoparticles for Intracellular Controlled Drug Delivery. Small. 2010;6:1952–1967. doi: 10.1002/smll.200901789. [DOI] [PubMed] [Google Scholar]
- 4.Lu J, Liong M, Li Z, Zink JI, Tamanoi F. Biocompatibility, Biodistribution, and Drug-Delivery Efficiency of Mesoporous Silica Nanoparticles for Cancer Therapy in Animals. Small. 2010;6:1794–1805. doi: 10.1002/smll.201000538. [DOI] [PMC free article] [PubMed] [Google Scholar]
- 5.Li L, Tang F, Liu H, Liu T, Hao N, Chen D, Teng X, He J. In Vivo Delivery of Silica Nanorattle Encapsulated Docetaxel for Liver Cancer Therapy with Low Toxicity and High Efficacy. ACS Nano. 2010;4:6874–6882. doi: 10.1021/nn100918a. [DOI] [PubMed] [Google Scholar]
- 6.Nan A, Bai X, Son SJ, Lee SB, Ghandehari H. Cellular Uptake and Cytotoxicity of Silica Nanotubes. Nano Lett. 2008;8:2150–2154. doi: 10.1021/nl0802741. [DOI] [PubMed] [Google Scholar]
- 7.Tsai CP, Hung Y, Chou YH, Huang DM, Hsiao JK, Chang C, Chen YC, Mou CY. High-Contrast Paramagnetic Fluorescent Mesoporous Silica Nanorods as a Multifunctional Cell-Imaging Probe. Small. 2008;4:186–191. doi: 10.1002/smll.200700457. [DOI] [PubMed] [Google Scholar]
- 8.Chen D, Li L, Tang F, Qi S. Facile and Scalable Synthesis of Tailored Silica “Nanorattle” Structures. Adv Mater. 2009;21:3804–3807. [Google Scholar]
- 9.Malugin A, Ghandehari H. Caspase 3 Independent Cell Death Induced by Amorphous Silica Nanoparticles. Nanoscience and Nanotechnology Letters. 2011;3:309–313. [Google Scholar]
- 10.Slowing I, Trewyn BG, Lin VS. Effect of Surface Functionalization of MCM-41-Type Mesoporous Silica Nanoparticles on the Endocytosis by Human Cancer Cells. J Am Chem Soc. 2006;128:14792–14793. doi: 10.1021/ja0645943. [DOI] [PubMed] [Google Scholar]
- 11.Yamashita K, Yoshioka Y, Higashisaka K, Mimura K, Morishita Y, Nozaki M, Yoshida T, Ogura T, Nabeshi H, Nagano K, et al. Silica and Titanium Dioxide Nanoparticles Cause Pregnancy Complications in Mice. Nat Nanotechnol. 2011;6:321–328. doi: 10.1038/nnano.2011.41. [DOI] [PubMed] [Google Scholar]
- 12.Nishimori H, Kondoh M, Isoda K, Tsunoda S, Tsutsumi Y, Yagi K. Silica Nanoparticles as Hepatotoxicants. Eur J Pharm Biopharm. 2009;72:496–501. doi: 10.1016/j.ejpb.2009.02.005. [DOI] [PubMed] [Google Scholar]
- 13.Lu X, Tian Y, Zhao Q, Jin T, Xiao S, Fan X. Integrated Metabonomics Analysis of the Size-Response Relationship of Silica Nanoparticles-Induced Toxicity in Mice. Nanotechnology. 2011;22:055101. doi: 10.1088/0957-4484/22/5/055101. [DOI] [PubMed] [Google Scholar]
- 14.Xie G, Sun J, Zhong G, Shi L, Zhang D. Biodistribution and Toxicity of Intravenously Administered Silica Nanoparticles in Mice. Arch Toxicol. 2010;84:183–190. doi: 10.1007/s00204-009-0488-x. [DOI] [PubMed] [Google Scholar]
- 15.Isoda K, Hasezaki T, Kondoh M, Tsutsumi Y, Yagi K. Effect of Surface Charge on Nano-Sized Silica Particles-Induced Liver Injury. Pharmazie. 2011;66:278–281. [PubMed] [Google Scholar]
- 16.Hudson SP, Padera RF, Langer R, Kohane DS. The Biocompatibility of Mesoporous Silicates. Biomaterials. 2008;29:4045–4055. doi: 10.1016/j.biomaterials.2008.07.007. [DOI] [PMC free article] [PubMed] [Google Scholar]
- 17.Yu T, Malugin A, Ghandehari H. Impact of Silica Nanoparticle Design on Cellular Toxicity and Hemolytic Activity. ACS Nano. 2011;5:5717–5728. doi: 10.1021/nn2013904. [DOI] [PMC free article] [PubMed] [Google Scholar]
- 18.Lin YS, Abadeer N, Haynes CL. Stability of Small Mesoporous Silica Nanoparticles in Biological Media. Chem Commun (Camb) 2011;47:532–534. doi: 10.1039/c0cc02923h. [DOI] [PubMed] [Google Scholar]
- 19.Dobrovolskaia MA, Patri AK, Zheng J, Clogston JD, Ayub N, Aggarwal P, Neun BW, Hall JB, McNeil SE. Interaction of Colloidal Gold Nanoparticles with Human Blood: Effects on Particle Size and Analysis of Plasma Protein Binding Profiles. Nanomedicine : Nanotechnology, Biology, and Medicine. 2009;5:106–117. doi: 10.1016/j.nano.2008.08.001. [DOI] [PMC free article] [PubMed] [Google Scholar]
- 20.Bihari P, Vippola M, Schultes S, Praetner M, Khandoga AG, Reichel CA, Coester C, Tuomi T, Rehberg M, Krombach F. Optimized Dispersion of Nanoparticles for Biological in Vitro and in Vivo Studies. Part Fibre Toxicol. 2008;5:14. doi: 10.1186/1743-8977-5-14. [DOI] [PMC free article] [PubMed] [Google Scholar]
- 21.Ji Z, Jin X, George S, Xia T, Meng H, Wang X, Suarez E, Zhang H, Hoek EM, Godwin H, et al. Dispersion and Stability Optimization of TiO2 Nanoparticles in Cell Culture Media. Environ Sci Technol. 2010;44:7309–7314. doi: 10.1021/es100417s. [DOI] [PMC free article] [PubMed] [Google Scholar]
- 22.Chen Z, Meng H, Xing G, Chen C, Zhao Y, Jia G, Wang T, Yuan H, Ye C, Zhao F, et al. Acute Toxicological Effects of Copper Nanoparticles in Vivo. Toxicol Lett. 2006;163:109–120. doi: 10.1016/j.toxlet.2005.10.003. [DOI] [PubMed] [Google Scholar]
- 23.Chen J, Dong X, Zhao J, Tang G. In Vivo Acute Toxicity of Titanium Dioxide Nanoparticles to Mice after Intraperitoneal Injection. J Appl Toxicol. 2009;29:330–337. doi: 10.1002/jat.1414. [DOI] [PubMed] [Google Scholar]
- 24.Endemann DH, Schiffrin EL. Endothelial Dysfunction. J Am Soc Nephrol. 2004;15:1983–1992. doi: 10.1097/01.ASN.0000132474.50966.DA. [DOI] [PubMed] [Google Scholar]
- 25.Muzykantov VR. Biomedical Aspects of Targeted Delivery of Drugs to Pulmonary Endothelium. Expert Opin Drug Deliv. 2005;2:909–926. doi: 10.1517/17425247.2.5.909. [DOI] [PubMed] [Google Scholar]
- 26.He Q, Zhang Z, Gao F, Li Y, Shi J. In Vivo Biodistribution and Urinary Excretion of Mesoporous Silica Nanoparticles: Effects of Particle Size and Pegylation. Small. 2011;7:271–280. doi: 10.1002/smll.201001459. [DOI] [PubMed] [Google Scholar]
- 27.Galagudza MM, Korolev DV, Sonin DL, Postnov VN, Papayan GV, Uskov IS, Belozertseva AV, Shlyakhto EV. Targeted Drug Delivery into Reversibly Injured Myocardium with Silica Nanoparticles: Surface Functionalization, Natural Biodistribution, and Acute Toxicity. Int J Nanomedicine. 2010;5:231–237. doi: 10.2147/ijn.s8719. [DOI] [PMC free article] [PubMed] [Google Scholar]
- 28.Zhao Y, Sun X, Zhang G, Trewyn BG, Slowing II, Lin VS. Interaction of Mesoporous Silica Nanoparticles with Human Red Blood Cell Membranes: Size and Surface Effects. ACS Nano. 2011;5:1366–1375. doi: 10.1021/nn103077k. [DOI] [PubMed] [Google Scholar]
- 29.Liu X, Sun J. Endothelial Cells Dysfunction Induced by Silica Nanoparticles through Oxidative Stress Via JNK/P53 and NF-κB Pathways. Biomaterials. 2010;31:8198–8209. doi: 10.1016/j.biomaterials.2010.07.069. [DOI] [PubMed] [Google Scholar]
- 30.Hainfeld JF, Slatkin DN, Focella TM, Smilowitz HM. Gold Nanoparticles: A New X-Ray Contrast Agent. Br J Radiol. 2006;79:248–253. doi: 10.1259/bjr/13169882. [DOI] [PubMed] [Google Scholar]
- 31.Waters KM, Masiello LM, Zangar RC, Tarasevich BJ, Karin NJ, Quesenberry RD, Bandyopadhyay S, Teeguarden JG, Pounds JG, Thrall BD. Macrophage Responses to Silica Nanoparticles Are Highly Conserved across Particle Sizes. Toxicol Sci. 2009;107:553–569. doi: 10.1093/toxsci/kfn250. [DOI] [PMC free article] [PubMed] [Google Scholar]
- 32.Oberdorster G, Oberdorster E, Oberdorster J. Nanotoxicology: An Emerging Discipline Evolving from Studies of Ultrafine Particles. Environ Health Perspect. 2005;113:823–839. doi: 10.1289/ehp.7339. [DOI] [PMC free article] [PubMed] [Google Scholar]
- 33.Krug HF, Wick P. Nanotoxicology: An Interdisciplinary Challenge. Angew Chem Int Ed Engl. 2011;50:1260–1278. doi: 10.1002/anie.201001037. [DOI] [PubMed] [Google Scholar]
- 34.Liu T, Li L, Teng X, Huang X, Liu H, Chen D, Ren J, He J, Tang F. Single and Repeated Dose Toxicity of Mesoporous Hollow Silica Nanoparticles in Intravenously Exposed Mice. Biomaterials. 2011;32:1657–1668. doi: 10.1016/j.biomaterials.2010.10.035. [DOI] [PubMed] [Google Scholar]
- 35.Yadav S, Shire SJ, Kalonia DS. Viscosity Analysis of High Concentration Bovine Serum Albumin Aqueous Solutions. Pharm Res. 2011;28:1973–1983. doi: 10.1007/s11095-011-0424-7. [DOI] [PubMed] [Google Scholar]
Associated Data
This section collects any data citations, data availability statements, or supplementary materials included in this article.