Abstract
Treatment planning for patients undergoing radiation therapy is often performed based on four dimensional computed tomography (4DCT) when respiratory motion is present, as in lung cancer patients. 4DCT is used to define the internal target volume (ITV) that, ideally, incorporates all potential locations of the tumour. In this work, we use the locations of gold fiducial markers implanted in lung tumours of 8 patients to represent tumour motion. These fiducial locations are used in a simulation of a four slice CT scanner to generate the ITV for 10 mm, 20 mm and 30 mm diameter model tumours. To demonstrate instabilities in the ITV definition based on 4DCT, the ITV calculation was repeated for the same patients for consecutive scan start times, staggered by one second. The percent difference in the ITV and the percent of time that the ITV contains the tumour are both evaluated. The ITV from a single patient was found to vary by 46% – 127% for a tumour diameter of 10 mm. The ITV did not cover the entirety of the tumour 11%–74% of the time for a 10 mm tumour diameter.
1. Introduction
Radiation therapy is a local therapy where the objective is to treat the tumour volume while sparing the surrounding organs and tissues. This becomes a greater challenge when the tumour volume moves with internal organ motion (Keall et al 2006). A patient undergoing radiation therapy will often be imaged prior to treatment to determine the treatment volume. The prescribing volumes for radiation therapy are recommended by the International Commission on Radiation Units and Measurements in report 83 (ICRU 2010), where the concept of internal target volume (ITV) is used to account for uncertainties in the size, shape and position of the clinical target volume (CTV). This internal volume should encompass all locations of the tumour due to internal organ motion. To determine where the tumour may move with respect to the patient’s bony anatomy, a 4DCT scan is acquired while the patient breathes (Rietzel et al 2005). The internal target volume is taken from the maximum intensity projection (MIP) of the 4DCT scan and this volume is the union of all tumour positions during the imaging study (Underberg et al, 2005). Clinically, the ITV derived from the 4DCT scan represents all positions of the tumour during the imaging study.
The ITV reproducibility has been previously evaluated with investigators looking at the tumour volumes on CT scans that were acquired sequentially (Siker et al 2006). More recently, limitations of 4DCT in the context of treatment planning has been studied by comparing the ITV acquired in 4DCT to dynamic MR images (Cai et al 2010) and by simulating the tumour volume based on the external breathing traces of patients (Sarker et al 2010). The accuracy of the MIP, with respect to determining the ITV has also been measured by simulating tumour motion in a physical phantom (Park et al 2009) and by measuring the tumour motion from dynamic MRI and performing simulations (Cai et al 2008). All of these studies demonstrate that variations in the ITV depend on the tumor size and the amplitude and regularity of the breathing pattern.
The goal of this work is to investigate the stability of the ITV definition as it is clinically used today and to evaluate how well the ITV covers the tumour volume for patients with lung cancer. This is the first time that the clinical interpretation of the ITV concept has been tested using internal fiducial markers in patients with lung cancer and the first time that temporal variations in the ITV are investigated.
2. Methods
The simulations in this paper are based on data from 8 patients with early stage lung cancer that were imaged and treated using the Mitsubishi Real Time Radiation Therapy System in the Radiation Oncology Clinic at the Nippon Telegraph and Telephone Company in Sapporo, Japan. Details of the therapy and internal tracking system have been previously reported (Shirato et al 2000). For these patients, 1.5 mm diameter gold fiducial markers were implanted in the lung tumours and stereoscopic images of the markers were taken at a sampling rate of 30 Hz. From these images, the 3D locations of the gold markers could be determined with an accuracy of ±1 mm. All of the patients are freebreathing and were selected for internal marker motion greater than 5 mm. For the 8 patients analyzed there is more than 250 minutes of lung tumour tracking information with simultaneous external motion.
2.1 Instabilities in ITV definition
All of the simulations were constructed with MATLAB (The Mathworks, Natick MA). Using the patient data, a tumour was modeled as a sphere with location extracted from the experimental data. With this tumour volume, we simulated a 4DCT scan acquired in cine mode, accounting for the time required to acquire a single bed position (6 seconds), the travel time between bed positions (1.5 seconds), the slice thickness (2.5 mm) and the number of slices acquired per bed position (4). This simulation represents a typical clinical scan used for radiotherapy planning and accounts for the discrete nature of four slice CT scanners that are often used in radiation oncology clinics (including our own). In these simulations, the tumour may not be represented smoothly across boundaries of the four slice CT scanner. This is because the tumour locations in the first four slices are based on the first six seconds of imaging time, while in the next four slices the tumour locations are based on the following six seconds of imaging time (accounting for the time for the bed to move to the second position). The ITV was taken to be the union of all tumour positions during the scan time, as seen by the CT scanner; this is analogous to a maximum intensity projection (MIP) of the tumour that is clinically used to create ITVs. This was a geometric study and image reconstruction was not used. As a MIP can be constructed from a cine 4DCT acquisition without performing any respiratory sorting, and the ITV is constructed from the MIP, sorting techniques were not considered as a source of error in this study. In these simulations the variables that affect the ITV include tumour motion, tumour size, tumour shape, the scan duration and the geometry of the CT scanner. The ITV calculation was repeated for the same patients for consecutive scan start times, staggered by one second. To quantify the ITV variations, the percent difference in the ITVs for the same patients was calculated using:
| (1) |
2.2 Margin evaluation
For each patient, a uniform margin of varying size (0 mm – 10 mm) was added to the ITV and the percent of the time that the ITV and the margin covered the tumour volume was calculated. To achieve this, two datasets were chosen for each patient. The first data set was used to generate ITVs following the method described in Section 2.1. The second dataset was used to compare the ITV to the tumor position. The first 60 seconds of the second data set was used to calculate the center of mass position of the tumor on the treatment day and align this with the center of mass position of the ITV. The remaining samples in the dataset were used to calculate the amount of time that the ITV plus a uniform margin covered the tumor location. For every time point, the coverage of the ITV was determined by calculating the volume of tumour at that timepoint that the simulated ITV would not cover. This volume represents tumour tissue that would be undercovered during radiation therapy. This process was repeated for ITVs generated with consecutive start times at one second intervals.
3. Results
3.1 ITV Variations
The ITVs for the different patients varied by 12 % – 127 % for the 10 mm diameter model tumour, 6 % to 99% for the 20 mm diameter model tumour and 15 % – 69 % for the 30 mm diameter model tumour. The differences in ITV for the 8 patients and three model tumours are reported in table 1 and were calculated using equation 1.
Table 1.
The ITV differences (%) for the eight patients studied.
| ITV Differences (%) | ||||
|---|---|---|---|---|
| Tumour Diameter | 10 mm | 20 mm | 30 mm | |
| Patient Number | 1 | 46 | 28 | 23 |
| 2 | 80 | 53 | 36 | |
| 3 | 81 | 41 | 29 | |
| 4 | 46 | 33 | 21 | |
| 5 | 91 | 75 | 58 | |
| 6 | 127 | 78 | 49 | |
| 7 | 111 | 81 | 58 | |
| 8 | 121 | 99 | 69 | |
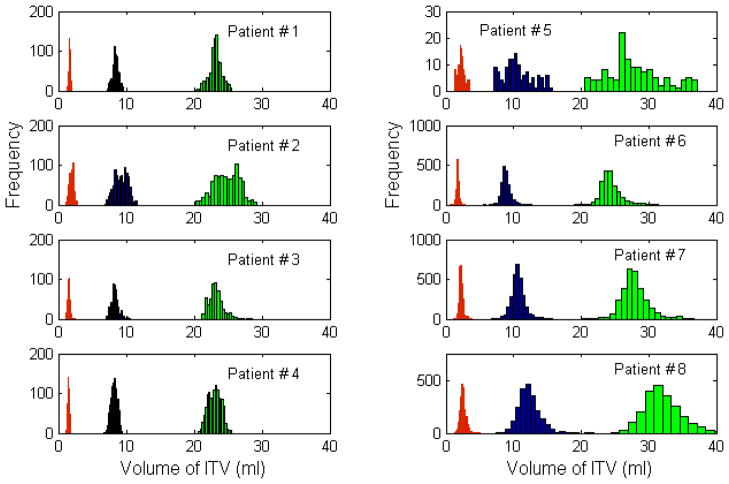
Histograms of the ITVs are shown in figure 1 for all 8 patients evaluated. For reference, the tumour volume for a 10 mm diameter sphere is 1.8 ml, for a 20 mm diameter sphere is 4.2 ml and for a 30 mm diameter sphere is 14.1 ml.
Figure 1.
Histograms of the ITVs for the 8 patients in the study. The three populations in each subplot correspond to tumour diameters of 10 mm (red, left), 20 mm (blue, center) and 30 mm (green, right).
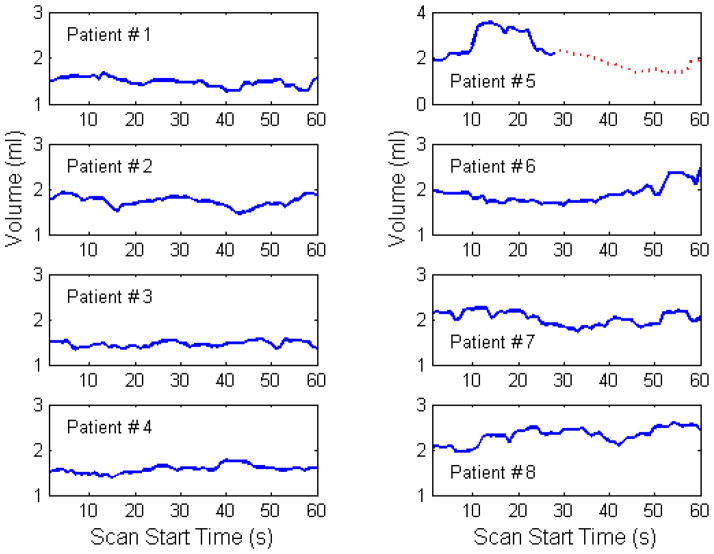
Figure 2 shows the ITVs for the 10 mm model tumour as a function of start time in the scan for a period of 60 seconds. Plotting the ITVs as a function of time illustrates the dynamic nature of the ITV definition used clinically.
Figure 2.
The variation in ITV with time for the 8 patients in the study. For patient #5 data from two separate treatment fractions is shown, with the dotted red line corresponding to data from the second treatment.
3.2 ITV Coverage
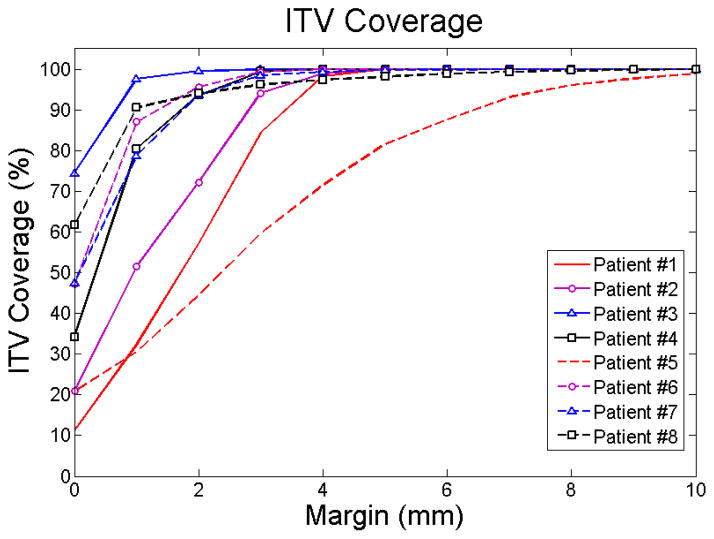
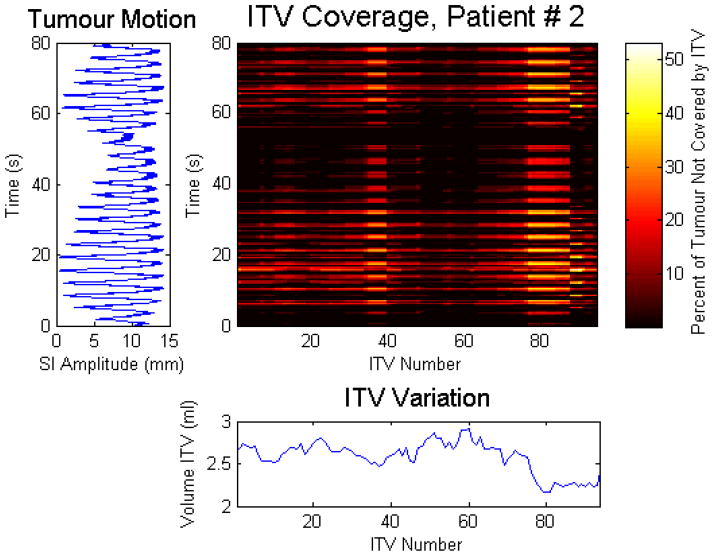
For the 8 patients studied, the ITV coverage is plotted in figure 3 as a function of uniform margin. To illustrate these results, the ITV coverage with a 1 mm uniform margin, along with the internal superior-inferior tumor motion and the corresponding ITVs for one patient is shown in figure 4. The colourmap displays the volume of tumour in percentage that would be subject to undercoverage, as a function of the ITV number (shown on the x axis) and the time (shown on the y axis). The corresponding ITVs are shown below the colourmaps, while the internal superior-inferior (SI) tumour motion is shown to the left of the colourmap. As in the previous simulations, the ITV is generated from four bed positions spanning the tumour position (as seen by the scanner) for 28.5 seconds. This instantaneous comparison shows (i) if the ITV covers the tumour position for that one time point, and (ii) if not, how much of the tumour is not covered at that specific time point. As in all of the simulations, the time points are sampled at a frequency of 30 Hz.
Figure 3.
A plot of the ITV coverage for all 8 patients, for margins varying from 0 mm to 10 mm
Figure 4.
The ITV coverage as a function of time and ITV number for patient #2 with a 1 mm uniform margin. For illustration, the corresponding ITV (from Day 1) is shown below the ITV coverage and the internal superior-inferior tumour motion (from Day 2) is shown on the left of the ITV coverage.
4. Discussion
Highlighted in this work are the potential drawbacks of using 4DCT for treatment planning purposes. From this study, variations of up to 127% percent were observed in the ITVs for a 10 mm diameter model tumour, up to 99% for a 20 mm diameter model tumour and up to 69% for a 30 mm model tumour. For the 8 patients studied, the ITV accounted for the entire range of tumour motion in none of the patients. The difference in coverage can be attributed to the differences in the breathing of each patient. For patients with poor ITV coverage, this could be due to either (i) one or more shallow breaths during the ITV generation or (ii) one or more deep breaths during the comparison. This would correspond to one or more shallow breaths during simulation and one or more deep breaths during therapy. Clinically, the first source of error is more problematic and could result in undercoverage of the tumour for all planned radiation fields. While the second source of error is concerning, it is an error that would not be propagated to the entire course of treatment for the patient. Not considered in this study is the effect of a single large breath during the treatment simulation. A single large breath would result in a larger than required ITV and additional radiation dose to healthy lung tissue.
Larger axial field of view CT scanners may maximize the probability of the treatment plan covering the tumour volume; however, this would only occur in the situation where the duration of the CT simulation was comparable to the total duration of the 4 slice CT study as imaging over a longer period of time has the benefit of potentially covering more tumour locations. A change in image acquisition protocols (e.g. increasing the scan time while maintaining a constant mAs per imaging study) may be a more accurate method to determine ITV in patients with large variations in their breathing. While it is preferable to more accurately define the ITV than to add uniform margins, the simulations in this work demonstrate that adding a uniform margin of 1 mm will improve the ITV coverage time from 11%–74% of the time to 31%–98%.
The purpose of this study is to demonstrate shortcomings in the ITV generation based on conventional treatment planning 4DCT. The dosimetric impact of not covering a tumour volume, or of accidentally irradiating healthy tissue, is beyond the scope of this paper. While, in some of the patient cohort it is possible that the planning treatment volume (PTV) covered the tumour location, the purpose of the PTV is to account for patient setup errors that are independent of the tumour motion. It is the role of the ITV to account for tumour motion within the patient.
This study demonstrates previously understated limitations of 4DCT in treatment planning for radiation therapy of lung tumours. These results highlight the need for monitoring patient breathing before and during the 4DCT used for simulation to ensure that a representative ITV is generated. Breath coaching, whenever possible, may also minimize the variations in the ITV. Real time tumour tracking remains the most promising method to ensure that the dose to the tumour is maximized while the dose to healthy tissue is minimized (Berbeco et al 2005, Rottmann et al 2010, Lewis et al 2010).
Acknowledgments
The authors would like to thank Dr. Seiko Nishioka of the Department of Radiology, NTT Hospital, Sapporo, Japan and Hiroki Shirato of the Department of Radiation Medicine, Hokkaido University School of Medicine, Sapporo, Japan for sharing the Hokkaido dataset with us. The authors would also like to thank Dr. Mike Makrigiorgos for insightful discussions during the preparation of the manuscript.
Contributor Information
Sara St. James, Email: sara.stjames@gmail.com.
John H Lewis, Email: jhlewis@lroc.harvard.edu.
References
- Berbeco RI, Mostafavi H, Sharp GC, Jiang SB. Towards fluoroscopic respiratory gating for lung tumors without radiopaque markers. Phys Med Biol. 2005;50:4481–90. doi: 10.1088/0031-9155/50/19/004. [DOI] [PubMed] [Google Scholar]
- Cai J, Read PW, Sheng Ke. The effect of respiratory motion variability and tumor size on the accuracy of average intensity projection from four-dimensional computed tomography: An investigation based on dynamic MRI. Med Phys. 2008;35:4974–4981. doi: 10.1118/1.2982245. [DOI] [PubMed] [Google Scholar]
- Cai J, McLawhorn R, Read PW, Larner JM, Yin FF, Benedict SH, Sheng Ke. Effects of breathing variation on gating window internal target volume in respiratory gated radiation therapy. Med Phys. 2010;37:3927–3934. doi: 10.1118/1.3457329. [DOI] [PubMed] [Google Scholar]
- ICRU. ICRU Report 83. Prescribing, Recording, and Reporting Photon-Beam Intensity-Modulated Radiation Therapy (IMRT) J ICRU. 2010;10:1–106. [Google Scholar]
- Keall PJ, et al. The management of respiratory motion in radiation oncology report of AAPM Task Group 76. Med Phys. 2006;33:3874–9000. doi: 10.1118/1.2349696. [DOI] [PubMed] [Google Scholar]
- Lewis JH, Li R, Watkins WT, Lawson JD, Segars WP, Cervino LI, Song WY, Jiang SB. Markerless lung tumor tracking and trajectory reconstruction using rotational cone-beam projections: a feasibility study. Phys Med Biol. 2010;55:2505–2522. doi: 10.1088/0031-9155/55/9/006. [DOI] [PubMed] [Google Scholar]
- Park K, Huang L, Gagne H, Papiez L. Do maximum intensity projection images truly capture tumor motion? Int J Radiat Oncol Biol Phys. 2009;73:618–625. doi: 10.1016/j.ijrobp.2008.10.008. [DOI] [PubMed] [Google Scholar]
- Rietzel E, Pan T, Chen GT. Four-dimensional computed tomography: image formation and clinical protocol. Med Phys. 2005;32:874–89. doi: 10.1118/1.1869852. [DOI] [PubMed] [Google Scholar]
- Rottman J, Aristophanous M, Chen A, Court L, Berbeco RI. A multi-region algorithm for Markerless beam’s-eye view lung tumor tracking. Phys Med Biol. 2010;55:5585–5598. doi: 10.1088/0031-9155/55/18/021. [DOI] [PubMed] [Google Scholar]
- Sarker J, Chu A, Mui K, Wolfgang JA, Chen GTW, Sharp GC. Variations in tumor size and position due to irregular breathing in 4D-CT: A simulation study. Med Phys. 2010;37:1254–1260. doi: 10.1118/1.3298007. [DOI] [PMC free article] [PubMed] [Google Scholar]
- Shirato H, et al. Four dimensional treatment planning and fluoroscopic real time tumor tracking for moving tumor. Int J Radiat Oncol Biol Phys. 2000;48:435–442. doi: 10.1016/s0360-3016(00)00625-8. [DOI] [PubMed] [Google Scholar]
- Siker ML, Tomé WA, Mehta MP. Tumor volume changes on serial imaging with megavoltage CT for non–small-cell lung cancer during intensity-modulated radiotherapy: How reliable, consistent, and meaningful is the effect? Int J Radiat Oncol Biol Phys. 2006;66:135–141. doi: 10.1016/j.ijrobp.2006.03.064. [DOI] [PubMed] [Google Scholar]
- Underberg RWM, Lagerwaard FL, Slotman BJ, Cuijpers JP, Senan S. Use of maximum Intensity projections (MIP) for target volume generation in 4DCT scans for lung cancer. Int J Radiat Oncol Biol Phys. 2005;63:253–260. doi: 10.1016/j.ijrobp.2005.05.045. [DOI] [PubMed] [Google Scholar]


