Abstract
Autophagy is reported to have important roles in relation to regulated cell death pathways and neurodegeneration. This study used chronic hypertensive glaucoma rat model to investigate whether the autophagy pathway has a role in the apoptosis of retinal ganglion cells (RGCs) after chronic intraocular pressure (IOP) elevation. Under electron microscopy, autophagosomes were markedly accumulated in the dendrites and cytoplasm of RGCs after IOP elevation. Western blot analysis showed that LC3-II/LC3-I and beclin-1 were upregulated throughout the 8-weeks period after IOP elevation. The pattern of LC3 immunostaining showed autophagy activation in the cytoplasm of RGCs to increase and peak at 4 weeks after IOP elevation. Most of these LC3B-positive RGCs underwent apoptosis by terminal deoxynucleotidyltransferase-mediated biotinylated UTP nick end labeling, and inhibition of autophagy with 3-methyladenine decreased RGC apoptosis. The activated pattern shows that autophagy is initially activated in the dendrites of the RGCs, but, thereafter autophagy is mainly activated in the cytoplasm of RGCs. This may show that autophagy is differently regulated in different compartments of the neuron. This present study showed that autophgy is activated in RGCs and has a role in autophagic cell death after chronic IOP elevation.
Keywords: retinal ganglion cell, glaucoma, autophagy
Chronic and progressive loss of retinal ganglion cells (RGCs), a characteristic of glaucoma, is attributed to RGC apoptosis.1 One hypothesis to explain how RGCs are lost is that intraocular pressure (IOP)-induced axonal transport obstruction within the optic nerve head inhibits retrograde delivery of neurotrophic factors from the superior colliculus to the RGC body, thereby triggering apoptosis.2, 3 Neurotrophic factors are known to promote neuronal survival and regeneration, and when deprivation of retrograde transported neurotrophins occurs, developing neurons die by apoptosis.4, 5 Additionally, ischemia, oxidative stress, glutamate excitotoxicity and glial cell activation have been shown to initiate apoptosis of RGCs in glaucoma.6, 7, 8, 9 However, the mechanism of RGC death in glaucoma is not fully understood.
The role of autophagy in adaptation to starvation has been investigated mainly because of its physiological importance in various organs.10, 11 Autophagy is constitutively expressed in all cell types containing a lysosomal compartment. Autophagy has a housekeeping function and is involved in cytoplasmic homeostasis as it controls the turnover of long-lived proteins, eliminates unwanted and damaged organelles and molecules and produces amino acids when nutrients become limited.12 Conversely, autophagy can be stimulated in response to different stressors, such as starvation, oxidative stress, accumulation of misfolded proteins and hormonal signaling.13, 14 In some cells, overactivated autophagy by stress leads to cell death, which is called autophagic cell death or type II programmed cell death.10
Despite recent advances in characterizing autophagy in several model systems, autophagic processes in the central nervous system remain poorly understood. Some reports show that neurotrophic factor deprivation does not induce autophagy in the mammalian brain, suggesting a specific regulatory system for autophagy in neuronal stress or neuropathogenic degeneration.15, 16 However, neuronal autophagy is important in the maintenance of neuronal homeostasis in other reports, and perturbation of autophagy in axons or dendrites leads to neurodegeneration in various disease conditions.17 Autophagy has been demonstrated to be activated in RGCs after optic nerve transection and acute IOP elevation in few studies.18, 19, 20, 21 However, the role of autophagy in RGC death showed to be protective, whereas detrimental effects were also reported.19, 21, 22, 23 The goal of our study was to understand the function of autophagy in a chronic ocular hypertension model of glaucoma. We used a rat ocular hypertension glaucoma model induced by episcleral vein cauterization, which is similar to human glaucoma. The change of the features of autophagy was sought at various time points after moderate IOP elevation.
Results
RGC loss after IOP elevation
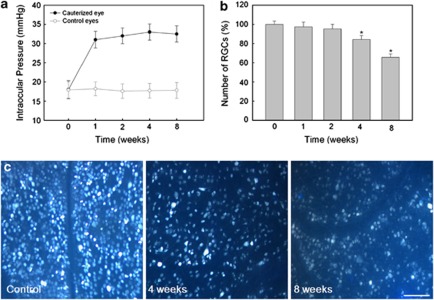
Cauterized eyes sustained IOP elevation for the entire 8-week experiment. Before cauterization, IOP was 17.8±2.34 mm Hg. IOP increased gradually after surgery and was 31.0±2.17 mm Hg at 1 week after cauterization. This elevated IOP in cauterized eye was consistently maintained for 8 weeks (32.4±2.12 mm Hg). The control eyes with sham surgery did not show IOP elevation throughout the experiment (Figure 1a).
Figure 1.
Verifying IOP elevation and reduction of RGCs in a chronic hypertension glaucoma model. (a) The change of IOP after cauterization in shown. The IOP of control and cauterized eyes was measured 0, 1, 2, 4 and 8 weeks after cauterization. The IOP of the cauterized eyes was elevated to 31.0±2.17 mm Hg 1 week after cauterization and remained elevated during the 8-week experimental period (32.4±2.12 mm Hg). (b) Quantification of RGCs after elevation of IOP. The number of RGCs labeled with Fluorogold in control (n=2) and cauterized eyes after 1 (n=2), 2 (n=2), 4 (n=2) and 8 weeks (n=2) are shown. The cell count of RGCs in the cauterized retinas relative to control (set at 100%) was ∼97.0, 84.3 and 65.7% at 1, 4 and 8 weeks after cauterization, respectively. (c) Representative images of Fluorogold retrograde labeling. Bar represents mean±S.D. Post Hoc (Scheffe) method as a multiple comparison analysis was used for statistical evaluation. *P<0.05 compared with the control
Retrograde labeled RGCs were counted by stererotaxically injected Fluorogold (FG; Fluorochrome, Denver, CO, USA) into the superior colliculus at each time period. Approximately 112 000 RGCs were counted in each normal control retina at each experimental time point. With the RGC value of normal controls set at 100% for comparison, retinas of the cauterized eyes showed a gradual loss of RGCs following IOP elevation. At 4 and 8 weeks after IOP elevation, the average number of retrograde labeled RGCs decreased to 84.3 and 65.7% of the average number of RGCs in normal control eyes, respectively (P<0.05; Figure 1b and c).
Ultrastructural features of autophagy after IOP elevation
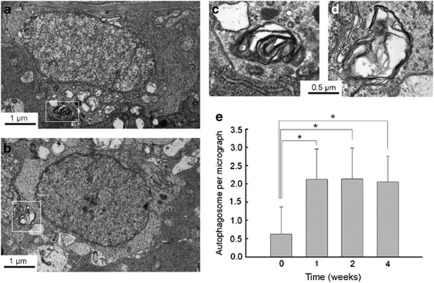
To determine whether autophagic activity was altered after IOP elevation, we first examined retinal sections by transmission electron microscopy (EM). The EM manifestation of double-membrane vacuoles that enclose cytoplasmic structures still represents the gold standard for identifying autophagosomes (APs).24, 25 Double- and multiple-membrane vacuoles containing electron-dense materials or whorls of membranous material, which are properties of APs, were found.25 APs were seen in the cytoplasm of RGCs in the ganglion cell layer (GCL) and were scattered in the dendrites of RGCs in the inner plexiform layer (IPL). We analyzed the APs in the cytoplasm of RGCs in the GCL and in the dendrites of RGCs in the IPL separately.
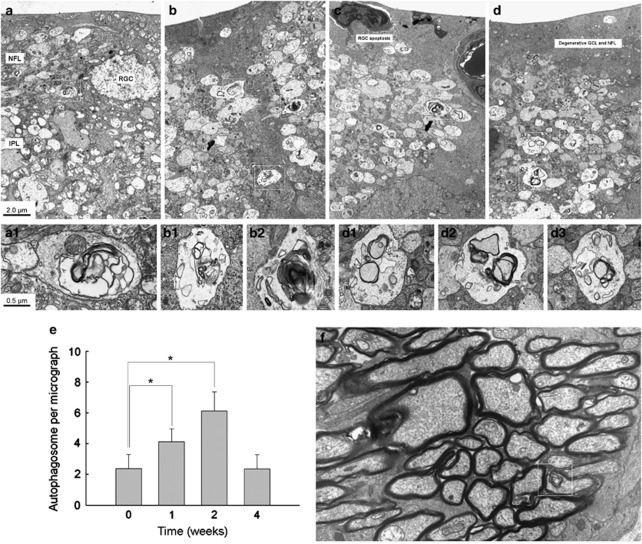
Before IOP elevation, APs were occasionally seen in the cytoplasm of RGCs in the GCL (Figures 2a and c). The average number of APs in the cytoplasm of RGCs was ≈0.7/50 μm2 before IOP elevation. However, after IOP elevation, the number of RGCs displaying APs in the GCL increased (Figures 2b and d). The average number of APs peaked at 1 week after IOP elevation to ≈2.2/50 μm2 (Figure 2e). Increased APs in the cytoplasm of RGCs in the GCL remained increased until 4 weeks after IOP elevation. More APs were observed in the dendrites of RGCs in the IPL. The average number of APs in the IPL was ≈2.1/50 μm2 before IOP elevation (Figure 3a). After IOP elevation, more APs were observed in the dendrites of RGCs (Figures 3b–d). The number of APs peaked at 2 weeks after IOP elevation to ≈6.0/50 μm2 (Figure 3e). At 4 weeks after IOP elevation, the number of APs decreased to near normal levels. In the retrobulbar optic nerve, where the axons of RGCs are densely compacted, only few APs were observed (≈0.3/50 μm2, Figure 3f).
Figure 2.
Transmission electron micrographs of RGCs in the GCL. (a–d) Ultrastructural images show the presence of double- or multiple-membrane autophagic vesicles containing cell organelles (box) in the cytoplasm of RGCs in the GCL of a sham-operated control rat retina (a and c) and cauterized experimental rat retina at 1 week after cauterization (b and d). (e) Comparison of the numbers of autophagic vesicles per transmission electron microscopy micrograph (50 μm2) in the cauterized rat retina. Three eyes used in each experimental period. Bar represents mean±S.D. *P<0.05 compared with the control
Figure 3.
Transmission electron micrographs of dendrites in the IPL. (a–d) Ultrastructural images show the presence of double- or multiple-membrane autophagic vesicles (box) containing cell organelles in the dendrites of RGCs of a sham-operated control rat retina (a) and an experimental rat retina at 1 week (b), 2 weeks (c) and 4 weeks (d) after cauterization. (e) Comparison of the numbers of autophagic vesicles per transmission EM micrograph (50 μm2) in the cauterized rat retina. Three eyes used in each experimental period. Bar represents mean±S.D. *P<0.05 compared with the control. (f) In the retrobulbar portion of the optic nerve, where axon bundles of RGCs are located, no apparent increase of autophagic vesicles were observed. Representative image at 2 weeks after IOP elevation
Expression of Beclin-1 and LC3B-II/LC3B-I after IOP elevation
Beclin-1 and microtubule-associated protein I light chain 3 (LC3)-II/LC3-I are biochemical markers of autophagic initiation. Beclin-1 has a pivotal role in AP formation and LC3-II become components of double-membrane cisterns and/or APs and hence is distributed into membrane fractions.10, 26 Therefore, we prepared retinal tissue from eyes of sham surgery or cauterization and examined the change in expression of Beclin-1 and LC3B-II/LC3B-I proteins. To ensure equal loading of protein samples on immunoblots, β-actin immunoreactivity was measured by western blotting and used as an endogenous control. As shown in Figure 4, β-actin immunoreactivity on immunoblots was not significantly altered in retinal tissue after IOP elevation.
Figure 4.
Western blot analysis of Beclin-1 and LC3B-II/LC3B-I. β-actin immunoreactivity was measured as an endogenous control. The level of Beclin-1 and LC3B-II/LC3B-I before cauterization was set at 1.0. The changes in the cauterized retinas relative to control were evaluated. Immunoreactivity of Beclin-1 showed a significant increase at 2, 4 and 8 weeks after cauterization. LC3B-II/LC3B-I ratio showed a significant increase at 1, 2, 4 and 8 weeks after cauterization. Three eyes used in each experimental period. *P<0.05 compared with the control
Immunoblots of homogenates using an antibody LC3B showed that both LC3B-I and LC3B-II were present in normal control retinas. However, IOP elevation caused more pronounced formation of LC3B-II, beginning shortly following IOP elevation and sustained elevated until 8 weeks after IOP elevation. In contrast, little change of LC3B-I protein was observed. The ratio of LC3B-II to LC3B-I was significantly increased at 1, 2, 4 and 8 weeks following the induction of IOP elevation. Beclin-1 expression was found in control group but that expression increased rapidly after IOP elevation. The time-course of upregulation was similar to that of LC3B-II/LC3B-I ratio, reaching a maximum at 2 weeks and sustained thereafter (Figure 4). Together our data show that autophagy is activated in RGCs after chronic IOP elevation. This upregulation of autophagy occurs until 8 weeks after IOP elevation, which is more than the period when RGC death starts.
LC3 distribution after IOP elevation
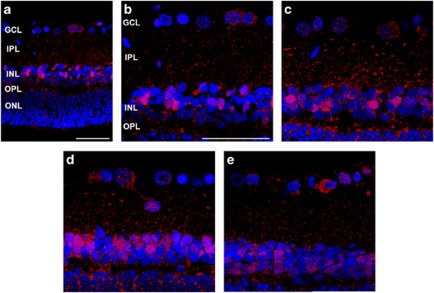
To study autophagic protein cellular distribution, we performed confocal microscopy of LC3B (red) and DAPI (blue) in retinal sections. LC3B immunoreactivity was observed as clusters of small, intensely stained granules, which was distributed in the cytoplasm of RGCs in the GCL and mainly in the IPL and inner nuclear layer (INL) before IOP elevation (Figures 5a and b). After the induction of IOP elevation, LC3B immunoreactivity significantly increased in the GCL, IPL and INL. The most apparent increase of LC3B immunoreactivity was observed in the IPL and INL at 1 week (Figure 5c) and at 2 weeks (Figure 5d) after IOP elevation. After 4 weeks of IOP elevation, the LC3B immunoreactivity decreased in the IPL and INL (Figure 5e).
Figure 5.
Time course of LC3B immunoreactivity revealed by confocal microscopy after cauterization. Sham-operated control (a and b) shows LC3B immunoreactivity in the GCL, IPL and INL. After cauterization, LC3B immunoreactivity gradually increased in the GCL, IPL, and INL at 1 week (c) and 2 weeks (d) after cauterization. Four weeks after cauterization (e), LC3B immunoreactivity decreased markedly in the IPL. Three eyes used in each experimental period. Scale bars: 50 μm
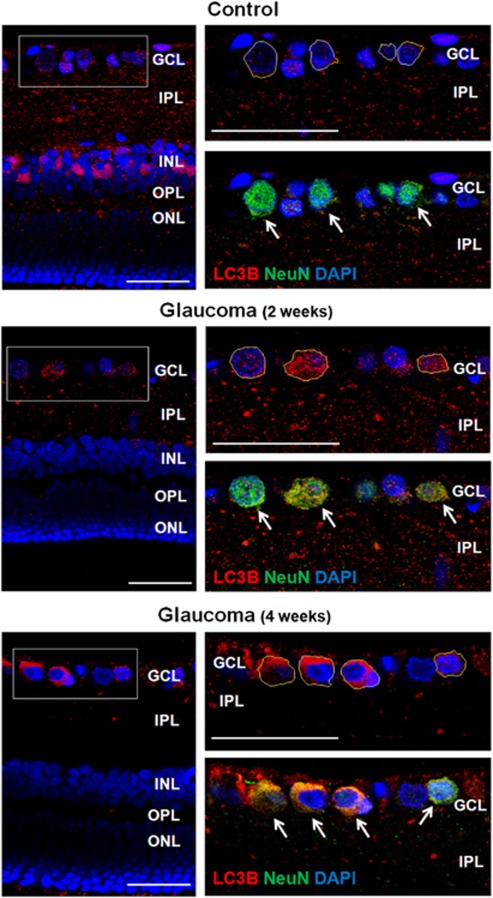
Co-localization with NeuN, a RGC marker, showed that LC3B immunoreactivity in the GCL was in the cytoplasm of RGCs (outlined in yellow lines; Figure 6, top). After 2 weeks of IOP elevation, LC3B immunoreactivity increased in the cytoplasm of RGCs in the GCL (Figure 6, middle). After 4 weeks, LC3B immunoreactivity in the cytoplasm of RGCs increased compared with the immunoreactivity of the control and 2 weeks (Figure 6, bottom). Altogether these data confirm activation of autophagy after IOP elevation. However, the activation of autophagy showed different distribution across the retinal layers. Further, activation of autophagy was significant in the cytoplasm of RGCs after 4 weeks of IOP elevation, which coincide with the period of RGC death.
Figure 6.
Confocal micrographs of double-labeled LC3B and NeuN as a ganglion cell marker (top). In the control, punctuate LC3B immunoreactivity was located mainly in the IPL with little LC3B visible in the cytoplasm of RGCs (RGCs; outlined as yellow line) in the GCL. After 2 weeks of IOP elevation, punctuate LC3B immunoreactivity increased in the cytoplasm of RGCs in the GCL. After 4 weeks of IOP elevation, LC3B immunoreactivity markedly increased in the cytoplasm of RGCs in the GCL and immunoreactivity was decreased in the IPL, where dendrites of RGCs are located. Three eyes used in each experimental period. Scale bars: 50 μm
Relationship between autophagic and apoptotic death
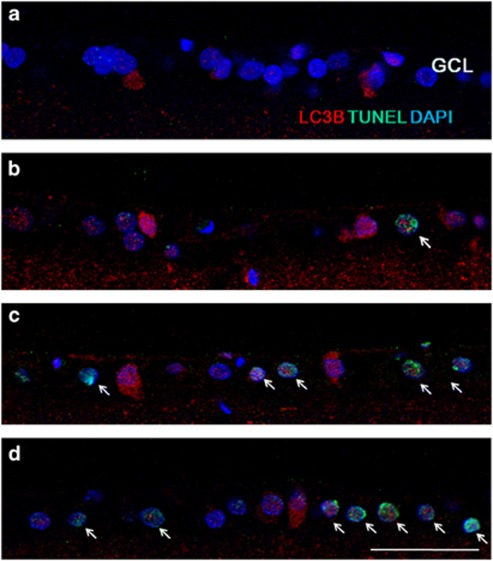
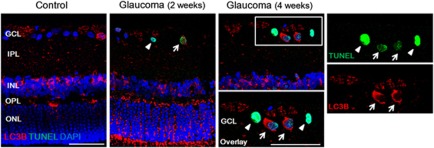
To evaluate the relationship between autophagic and apoptotic mechanisms, we investigated the expression of LC3B and terminal deoxynucleotidyltransferase-mediated biotinylated UTP nick end labeling (TUNEL)-staining. Before IOP elevation, there are few LC3B-positive RGCs and no TUNEL-positive cells in the GCL (Figure 7a). After 1 week of IOP elevation, LC3B immunoreactivity was increased in the cytoplasm of GCL (Figure 7b). Few TUNEL-positive cells are co-stained with LC3B-positive cells. At 4 (Figure 7c) and 8 weeks (Figure 7d) after IOP elevation, most LC3B-positive cells were TUNEL-positive showing RGC apoptosis occurring with autophagy activation. However, not all the TUNEL-positive RGCs showed activation of autophagy. Some RGC underwent apoptosis without activation of autophagy (Figure 8). These results show that activation of autophagy resulted apoptosis in some RGCs, however, other mechanisms of apoptosis are also involved.
Figure 7.
Confocal micrographs of double-labeled LC3B and TUNEL staining. Before IOP elevation (a), there are no TUNEL-positive cells in the GCL. After 1 week of IOP elevation, few TUNEL-positive cells were apparent in the GCL (b). At 4 (c) and 8 weeks (d) after IOP elevation, TUNEL-positive RGCs increased in the GCL and these cells co-stained with LC3B. Three eyes used in each experimental period. Scale bars: 50 μm
Figure 8.
Confocal micrographs of double-labeled LC3B and TUNEL staining. Most of the TUNEL-positive RGCs showed co-staining with LC3B (arrow). However, there was TUNEL-positive RGCs without increased staining of LC3B in the cytoplasm of the RGCs (arrowhead) at all period. Three eyes used in each experimental period. Scale bars: 50 μm
Inhibition of autophagy by 3-methyladenine enhances RGC survival
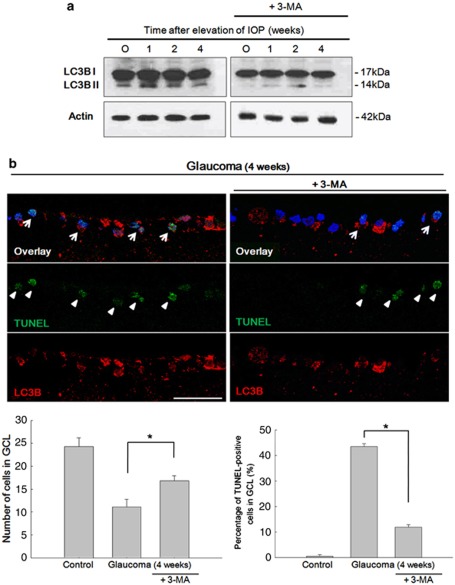
To evaluate whether 3-methyladenine (3-MA) inhibited autophagic activity, we studied the LC3 expression after IOP elevation and treatment with 3-MA. Treatment of 3-MA inhibits autophagy activity in both LC3B-II/LC3B-I ratio by western blot analysis (Figure 9a) and LC3B immunoreactivity by immunohistochemistry (Figure 9b). DAPI-positive cells and TUNEL-positive cells in the GCL were counted under × 400 magnification. DAPI-positive cells in the GCL were 24.28±1.89 cells in control and after 4 weeks of IOP elevation, it was decreased to 11.14±1.67 cells. When 3-MA was applied, DAPI-positive cells in the GCL were significantly increased to 16.86±1.07 cells (P<0.05). The percentage of TUNEL-positive cells in the GCL were increased to 43.5% (4.86±1.21 cells from 11.14±1.67 DAPI-positive cells) after 4 weeks of IOP elevation. After inhibition of autophagy with 3-MA, percentage of TUNEL-positive cells significantly decreased to 11.9% (2.00±1.41 cells from 16.86±1.07 DAPI-positive cells; P<0.05). Together our results demonstrate that autophagy is involved in RGC apoptosis and inhibition of autophagy reduced RGC death after chronic IOP elevation in vivo.
Figure 9.
After treatment with 3-MA. 3-MA treatment significantly inhibited the activity of autophagy in both western blot analysis (a) and immunohistochemistry (b). Quantification of the cells in the GCL showed decreased DAPI-positive cells after 4 weeks of IOP elevation. After inhibition of autophagy by 3-MA, cells in the GCL were significantly increased (bottom left). The percentage of TUNEL-positive cells in the GCL was significantly increased after 4 weeks of IOP elevation. This significantly decreased after inhibition of autophagy by 3-MA (bottom right). Six eyes used in each experimental period. Cell counted under × 400 magnification. Bar represents mean±S.D. *P<0.05 compared with the control. Scale bars: 50 μm
Discussion
In this work we have addressed the activation of autophagy and its role to RGC apoptosis in a chronic hypertensive glaucoma model. Our results suggest that chronic IOP elevation results in the activation of autophagy. There was evidence of increased AP formation after IOP elevation in the cytoplasm of RGCs in the GCL and in the dendrites in the IPL. Numerous double- or multiple-membrane autophagic vesicles were observed by EM. Immunohistochemical analysis showed increased LC3 expression in the GCL, IPL and INL after IOP elevation. Western blot analysis showed upregulation of two key autophagic markers, Beclin-1 and LC3B-II/LC3B-I ratio. The ultrastructural and biochemical results clearly show that the autophagy was significantly activated in RGCs after chronic IOP elevation. The activation of autophagy was marked in the RGCs until 8 weeks after IOP elevation. There were shift of the markers of autophagy from the RGC bodies and dendrites to RGC bodies at 4 weeks after IOP elevation. Most of the LC3B-positive RGC cells in the GCL undergone apoptosis by TUNEL staining. After inhibition of autophagy by 3-MA treatment, TUNEL-positive cells decreased in the GCL, showing that autophagy induces apoptosis in RGCs after chronic IOP elevation.
Glaucoma is a neurodegenerative disease of the optic nerve characterized by the accelerated death of RGCs and their axons. Our study showed that autophagy activation was sustained after chronic IOP elevation. It increased early after IOP elevation, which precede significant RGC loss, and sustained throughout the experimental period. Interestingly, increased APs were prominent in the IPL rather than in the cytoplasm of RGC in GCL by EM in the early periods after IOP elevation. However, after the period of significant RGCs loss, which was about 4 weeks after IOP induction, punctuate LC3B immunoreactivity slightly decreased in the IPL. But, the LC3B immunoreactivity in the cytoplasm of RGCs in the GCL markedly increased at 4 weeks of IOP induction. In our previous reports, we found that chronic IOP elevation was associated with a variety of changes in both cell death and cell survival pathways in RGCs.27 Importantly, intrinsic cell survival mechanisms, which were activated at the early stage of injury, may have a critical role in the control of the apoptotic or survival decision. As the intrinsic cell survival mechanism loses the capacity to resist extrinsic injury caused by chronic ocular hypertension, RGC death predominates. The results of autophagy showed a similar response to chronic IOP elevation. In the early stage of injury, autophagy was activated mainly in the IPL. Autophagy might become activated in response to IOP elevation and neurotrophic factor deprivation in our model to protect and compensate for the stressful conditions in the early stages. The intrinsic survival mechanism previously studied was phosphorylated protein kinase B (PKB/Akt), Bcl-2 and Bcl-xL. Beclin-1 has a BH3-only domain that permits the interaction of this protein with the anti-apoptotic proteins, Bcl-2 and Bcl-xL.28, 29 This interaction could explain the results of autophagy, which show similar responses to the intrinsic survival mechanism found in the retina after chronic IOP elevation. However, after 4 weeks of chronic IOP elevation, activated autophagy was mainly found in the cytoplasm of RGCs; this coincides with the period of significant RGC loss in the GCL. However, owing to consistent and chronic IOP elevation, the neuroprotective attempt of autophagy may have failed and autophagic cell death may have been triggered, which was shown in our results that LC3-positive RGCs were mostly TUNEL-positive after 4 weeks of IOP elevation. However, not all of the TUNEL-positive RGCs showed activation of autophagy. This could mean that different mechanisms other than autophagic cell death may be involved in RGC death after chronic IOP elevation.
The distribution of the activation of autophagy was different throughout the retinal layers. In the early period, autophagy activation was mainly at the IPL and INL. However, thereafter, autophagy activation was mostly found in the cytoplasm of RGCs. No distinct change of APs by EM was found in the axons of the retrobulbar optic nerve. Neurons are highly polarized cells that consist of axons and dendrites, both of which extend many orders of magnitude longer than the diameters of the corresponding cell bodies. It is reported that autophagy may be differently regulated in different compartments of the neuron.17, 30, 31 It remains to be investigated, but this also shows that autophagy may be differently regulated in different compartments of the RGC.
In conclusion, our study demonstrated that chronic IOP elevation might be associated with autophagy activation in the retina of a glaucoma model. The appearance of the autophagy activation was different in the GCL and IPL by each time course after IOP elevation. This activation of autophagy may induce apoptosis of the RGCs and inhibiting autophagy could be a promising clinical target to prevent RGC degeneration in glaucoma.
Materials and Methods
Animals
Adult male Sprague–Dawley rats (7–8 weeks old, 250–300 g) were used in this study. Test and control groups comprised of six animals for each experimental procedure. For transmission electron microscopy, three animals for each experimental period were used; the total number of animals used was 105. All animal experiments complied with the ARVO statement for the Use of Animals in Ophthalmic and Vision Research. And the animals were treated according to the regulations of the Catholic Ethics Committee of the Catholic University of Korea, Seoul and to the National Institutes of Health Guide for the Care and Use of Laboratory Animals (NIH Publications, no. 80–23, revised 1996). All efforts were made to minimize suffering and the number of animals used for this study. Before surgery, rats were anesthetized by intraperitoneal injection of 50 mg/kg tiletamine plus zolazepam (Zoletil; Virbac, Carros, France) and 15 mg/kg xylazine hydrochloride (Rompun; Bayer, Leuverkeusen, Germany). Three episcleral veins were cauterized by a standard technique previously mentioned.27 Briefly, before the procedure, IOP was checked with a tonometer (Tono-Pen; Mentor O&O Inc., Santa Barbara, CA, USA). A small conjunctival incision was made in each quadrant at the limbus, and the extraocular muscles were isolated. Four major limbal draining veins were identified based on deep location under the rectus muscles, relative immobility, larger caliber and branching pattern. Among them, three episcleral veins were cauterized using a surgical microscope (Olympus, Tokyo, Japan) and a cautery (Bovie Medical Co., Melville, NY, USA). Two dorsal episcleral veins under the superior rectus muscle and one temporal episcleral vein under the lateral rectus muscle were cauterized with a 30-gauge tip to avoid possible damage to the neighboring sclera. Planar ophthalmoscopy was used to confirm normal perfusion of the retina. After surgery, chloramphenicol eye drops and oxytetracycline ointment were applied to the eyes. Only the eyes that did not suffer scleral burns with subsequent necrosis or any complications from the surgery were used. IOP was measured directly and carefully by tonometer using a Tono-Pen after topical anesthetization with proparacaine hydrochloride ophthalmic solution (Alcane; Alcon Laboratories, Fort Worth, TX, USA). Animals were kept as calm as possible to minimize effects on the IOP readings. Experimental analysis was performed at 1, 2, 4 and 8 weeks after cauterization.
3-Methyladenine treatment
In three eyes in each group, treatment with 3-MA (Sigma-Aldrich, St. Louis, MO, USA) was performed during the surgery. Thirty micrograms of 3-MA was melted in 10 μl of saline and intravitreal injection was done. Experimental analysis was performed at 1, 2 and 4 weeks after cauterization.
Tissue preparation
At each time point, for immunohistochemical analysis, eyes were quickly enucleated and dissected, and the posterior eye cups were placed in chilled fixative (4% paraformaldehyde in 0.1 M phosphate buffer (PB), pH 7.4). Isolated retinas were divided into small pieces and immersion fixed in the same fixative for 2 h at 4 °C. After washing several times, fixed retinas were cryoprotected in 30% sucrose containing 0.1 M PB for 6 h at 4 °C and stored in this buffer at −70 °C. For western blot analysis, retinal tissues were quickly dissected, frozen in liquid nitrogen and stored at −70 °C.
Counting of RGCs
To retrogradely label RGCs, 4 days before killing, FG was introduced stereotaxically either unilaterally or bilaterally into the superior colliculus. Briefly, after fixing the head of anesthetized rats in a stereotaxic apparatus (Stoelting, Wood Dale, IL, USA) with the skull held horizontally, FG was injected into the superior colliculus using the following coordinates: 6 mm posterior to the rat bregma, 1.2 mm lateral to the midline and 3.8–4.2 mm depth from the top of the skull. These tracers are taken up by the axon terminals of the RGCs in the superior colliculus and transported retrogradely to the somas in the retina. Immediately after death, the superior side of each eye was marked for orientation, and both eyes were enucleated. The anterior segments were removed and the posterior segments were fixed in 4% paraformaldehyde in 0.1 M PB, pH 7.4, for 30 min. The retina was then isolated, divided into four equal quadrants and flat mounted on slides. RGC counting was performed by reference literature.32 Briefly, each retinal quadrant was divided into central, middle and peripheral regions (1, 2 and 3 mm from the optic disc, respectively). Microscopic fields measuring 200 × 250 μm2 were chosen to count labeled RGCs. Labeled ganglion cells were counted with × 200 magnification in 4 central regions, 8 middle regions and 12 peripheral regions in the four quadrants of the retina. Corresponding regions from each retina of experimental and control groups were used for counting.
Transmission electron microscopy
Electron microscopy was conducted with retinal sections from sham-operated control rats and rats with cauterization. Tissue samples were obtained from three eyes of control rats and three eyes of cauterized rats and 10 fields of each eye were examined. Retinal sections (100 μm) were cut with a vibratome, postfixed with 4% glutaraldehyde in 0.1 mmol/l cacodylate buffer (pH 7.4) for 1 h and then with 1% osmium tetroxide in 0.1 mmol/l cacodylate buffer for 2 h. After rinsing with distilled water, the retinal sections were treated with 1% aqueous uranyl acetate overnight, dehydrated in an ascending series of ethanols to 100%, followed by dry acetone and then embedded in Durcupan ACM. Ultrathin sections (0.1 μm) were cut and mounted on Formvar-coated slot grids and stained with 3% lead citrate. It was subsequently examined with a Zeiss transmission electron microscope (Zeiss Inc., Thornwood, NY, USA). Quantification of the double-membrane vacuole-like structure was done by counting the APs in 50 micrographs (2500 μm2 total). The total number of these structures overlying at least one intersection of a Photoshop-generated grid was counted.
Western blot analysis
Control and injured retinas were homogenized in RIPA buffer (1% Triton X-100, 5% SDS, 5% deoxycholic acid, 0.5 M Tris–HCl pH 7.5, 10% glycerol, 1 mM EDTA, 1 mM phenylmethylsulfonyl fluoride (PMSF), 5 μg/ml aprotinin, 1 μg/ml leupeptin, 1 μg/ml pepstatin, 200 mM sodium orthovanadate and 200 mM sodium fluoride). Tissue extracts were incubated for 10 min on ice and clarified by centrifugation at 10 000 × g for 25 min at 4 °C. Total protein in retinal extracts was measured using a standard BCA assay (Pierce, Rockford, IL, USA). Retinal extracts (40 μg total protein) were resuspended in 5 × sample buffer (60 mM Tris–HCl pH 7.4, 25% glycerol, 2% SDS, 14.4 mM 2-mercaptoethanol, 0.1% bromophenol blue) at a 4:1 ratio, boiled for 5 min and resolved by SDS-PAGE. Proteins were transferred onto a nitrocellulose membrane, and blots were stained with Ponseau S (Sigma, St. Louis, MO, USA) to visualize the protein bands and ensure equal protein loading and uniform transfer. Blots were washed and blocked for 45 min with 5% nondried skim milk in TBST buffer (20 mM Tris–HCl pH 7.6, 137 mM NaCl and 0.1% Tween 20). Blots were then probed for 24 h using antibodies against Beclin-1 (Cell Signaling, Boston, MA, USA), LC3B (Sigma), Actin (Sigma, A4700). Blots were then probed with horseradish-peroxidase-conjugated goat anti-rabbit secondary antibody. Bound antibodies were detected using an enhanced chemiluminescence system (Amersham, Piscataway, NJ, USA) and X-ray film. Relative intensity was measured using an ImageMaster VDS (Pharmacia Biotech, Piscataway, NJ, USA) and the fold changes in these protein levels are indicated below the blot. Results are representative of five independent experiments. Data are expressed as mean±S.D.
Immunohistochemistry
To evaluate the cellular localization of APs, the retinal expression of LC3B was assessed. For fluorescence staining, samples were pre-embedded in 3% agar in deionized water. Vibratome sections (50 μm) were collected and washed several times in phosphate-buffered saline (PBS). Sections were incubated in 10% normal donkey serum in PBS for 1 h at room temperature to block nonspecific-binding activity, followed by incubation with the rabbit anti-Beclin-1 (Cell Signaling, 3495) and anti-LC3B (Sigma, L7543) overnight at 4 °C. The next day, after several washes with PBS, sections were incubated with a goat anti-rabbit Alexa 546 (Molecular Probes, Eugene, CA, USA, A11010). For double-labeling studies, sections were incubated with the mouse anti-parvalbumin (Sigma, P3088) or anti-NeuN (Chemicon, Temecula, CA, USA, MAB377) in 0.1 M PBS containing 0.5% Triton X-100 overnight at 4 °C, rinsed for 30 min with 0.1 M PBS and incubated with goat anti-mouse Alexa 488 (Molecular Probes, A11001) for 1 h 30 min at room temperature. After further washes in 0.1 M PB for 30 min, the sections were mounted using VECTARSHIELD mounting medium with DAPI (Vector Laboratories, Burlingame, CA, USA, H-1200). Sections were washed, coverslipped and examined by confocal laser scanning microscopy (Zeiss).
TUNEL staining
Apoptotic cells were evaluated by TUNEL staining. The retinas were dissected from the choroid. The central portion of the superior nasal quadrant, 1.5 mm from the optic disc was trimmed into small pieces. Fifty microns cryosections of retina were embedded in 4% paraformaldehyde and washed with PBS. The tissue was stained by the TUNEL method according to the manufacturer's protocol (In Situ Cell Death Detection Kit; Roche Applied Science, Mannheim, Germany, 11684795910). For double-labeling studies, sections were incubated with the anti-LC3B (Sigma, L7543) overnight at 4 °C. The next day, after several washes with PBS, sections were incubated with a goat anti-rabbit Alexa 546 (Molecular Probes, A11010). After further washes in 0.1 M PB for 30 min, the sections were mounted using VECTARSHIELD Mounting Medium with DAPI (Vector Laboratories, H-1200). Sections were washed, coverslipped and examined by confocal laser scanning microscopy (Zeiss).
Statistical analysis
All data are expressed as mean±S.D. Comparisons between each time point was compared with the control by Student's t-test or Post Hoc (Scheffe) method as a multiple comparison analysis. Results with P<0.05 were considered as statistically significant.
Acknowledgments
This study was supported by a grant of the Korea Healthcare technology R&D Project, Ministry of Health and Welfare, Republic of Korea (A101306).
Glossary
- RGC
retinal ganglion cells
- IOP
intraocular pressure
- EM
electron microscopy
- AP
autophagosomes
- GCL
ganglion cell layer
- IPL
inner plexiform layer
- INL
inner nuclear layer
- LC
microtubule-associated protein I light chain
- 3-MA
3-methyladenine
The authors declare no conflict of interest.
Footnotes
Edited by A Verkhratsky
References
- Quigley HA. Neuronal death in glaucoma. Prog Retin Eye Res. 1999;18:39–57. doi: 10.1016/s1350-9462(98)00014-7. [DOI] [PubMed] [Google Scholar]
- Quigley HA, McKinnon SJ, Zack DJ, Pease ME, Kerrigan-Baumrind LA, Kerrigan DF, et al. Retrograde axonal transport of BDNF in retinal ganglion cells is blocked by acute IOP elevation in rats. Invest Ophthalmol Vis Sci. 2000;41:3460–3466. [PubMed] [Google Scholar]
- Johnson EC, Deppmeier LM, Wentzien SK, Hsu I, Morrison JC. Chronology of optic nerve head and retinal responses to elevated intraocular pressure. Invest Ophthalmol Vis Sci. 2000;41:431–442. [PubMed] [Google Scholar]
- Raff MC, Barres BA, Burne JF, Coles HS, Ishizaki Y, Jacobson MD. Programmed cell death and the control of cell survival. Philos Trans R Soc Lond B Biol Sci. 1994;345:265–268. doi: 10.1098/rstb.1994.0104. [DOI] [PubMed] [Google Scholar]
- Raff MC, Barres BA, Burne JF, Coles HS, Ishizaki Y, Jacobson MD. Programmed cell death and the control of cell survival: lessons from the nervous system. Science. 1993;262:695–700. doi: 10.1126/science.8235590. [DOI] [PubMed] [Google Scholar]
- Guo Y, Johnson E, Cepurna W, Jia L, Dyck J, Morrison JC. Does elevated intraocular pressure reduce retinal TRKB-mediated survival signaling in experimental glaucoma. Exp Eye Res. 2009;89:921–933. doi: 10.1016/j.exer.2009.08.003. [DOI] [PMC free article] [PubMed] [Google Scholar]
- Lieven CJ, Hoegger MJ, Schlieve CR, Levin LA. Retinal ganglion cell axotomy induces an increase in intracellular superoxide anion. Invest Ophthalmol Vis Sci. 2006;47:1477–1485. doi: 10.1167/iovs.05-0921. [DOI] [PubMed] [Google Scholar]
- Park CK, Cha J, Park SC, Lee PY, Kim JH, Kim HS, et al. Differential expression of two glutamate transporters, GLAST and GLT-1, in an experimental rat model of glaucoma. Exp Brain Res. 2009;197:101–109. doi: 10.1007/s00221-009-1896-0. [DOI] [PubMed] [Google Scholar]
- Cho KJ, Kim JH, Park HY, Park CK. Glial cell response and iNOS expression in the optic nerve head and retina of the rat following acute high IOP ischemia-reperfusion. Brain Res. 2011;1403:67–77. doi: 10.1016/j.brainres.2011.06.005. [DOI] [PubMed] [Google Scholar]
- Hotchkiss RS, Strasser A, McDunn JE, Swanson PE. Cell death. N Engl J Med. 2009;361:1570–1583. doi: 10.1056/NEJMra0901217. [DOI] [PMC free article] [PubMed] [Google Scholar]
- Mizushima N, Levine B, Cuervo AM, Klionsky DJ. Autophagy fights disease through cellular self-digestion. Nature. 2008;451:1069–1075. doi: 10.1038/nature06639. [DOI] [PMC free article] [PubMed] [Google Scholar]
- Codogno P, Meijer AJ. Autophagy and signaling: their role in cell survival and cell death. Cell Death Differ. 2005;12 (Suppl 2:1509–1518. doi: 10.1038/sj.cdd.4401751. [DOI] [PubMed] [Google Scholar]
- He C, Klionsky DJ. Regulation mechanisms and signaling pathways of autophagy. Annu Rev Genet. 2009;43:67–93. doi: 10.1146/annurev-genet-102808-114910. [DOI] [PMC free article] [PubMed] [Google Scholar]
- Shintani T, Klionsky DJ. Autophagy in health and disease: a double-edged sword. Science. 2004;306:990–995. doi: 10.1126/science.1099993. [DOI] [PMC free article] [PubMed] [Google Scholar]
- Wang QJ, Ding Y, Kohtz DS, Mizushima N, Cristea IM, Rout MP, et al. Induction of autophagy in axonal dystrophy and degeneration. J Neurosci. 2006;26:8057–8068. doi: 10.1523/JNEUROSCI.2261-06.2006. [DOI] [PMC free article] [PubMed] [Google Scholar]
- Mizushima N, Yamamoto A, Matsui M, Yoshimori T, Ohsumi Y. In vivo analysis of autophagy in response to nutrient starvation using transgenic mice expressing a fluorescent autophagosome marker. Mol Biol Cell. 2004;15:1101–1111. doi: 10.1091/mbc.E03-09-0704. [DOI] [PMC free article] [PubMed] [Google Scholar]
- Komatsu M, Wang QJ, Holstein GR, Friedrich VL, Jr, Iwata J, Kominami E, et al. Essential role for autophagy protein Atg7 in the maintenance of axonal homeostasis and the prevention of axonal degeneration. Proc Natl Acad Sci USA. 2007;104:14489–14494. doi: 10.1073/pnas.0701311104. [DOI] [PMC free article] [PubMed] [Google Scholar]
- Kim SH, Munemasa Y, Kwong JM, Ahn JH, Mareninov S, Gordon LK, et al. Activation of autophagy in retinal ganglion cells. J Neurosci Res. 2008;86:2943–2951. doi: 10.1002/jnr.21738. [DOI] [PubMed] [Google Scholar]
- Rodriguez-Muela N, Germain F, Marino G, Fitze PS, Boya P. Autophagy promotes survival of retinal ganglion cells after optic nerve axotomy in mice. Cell Death Differ. 2011;19:162–169. doi: 10.1038/cdd.2011.88. [DOI] [PMC free article] [PubMed] [Google Scholar]
- Russo R, Berliocchi L, Adornetto A, Varano GP, Cavaliere F, Nucci C, et al. Calpain-mediated cleavage of Beclin-1 and autophagy deregulation following retinal ischemic injury in vivo. Cell Death Dis. 2011;2:e144. doi: 10.1038/cddis.2011.29. [DOI] [PMC free article] [PubMed] [Google Scholar]
- Piras A, Gianetto D, Conte D, Bosone A, Vercelli A. Activation of autophagy in a rat model of retinal ischemia following high intraocular pressure. PLoS One. 2011;6:e22514. doi: 10.1371/journal.pone.0022514. [DOI] [PMC free article] [PubMed] [Google Scholar]
- Knoferle J, Koch JC, Ostendorf T, Michel U, Planchamp V, Vutova P, Tönges L, et al. Mechanisms of acute axonal degeneration in the optic nerve in vivo. Proc Natl Acad Sci USA. 2010;107:6064–6069. doi: 10.1073/pnas.0909794107. [DOI] [PMC free article] [PubMed] [Google Scholar]
- Park KK, Liu K, Hu Y, Smith PD, Wang C, Cai B, et al. Promoting axon regeneration in the adult CNS by modulation of the PTEN/mTOR pathway. Science. 2008;322:963–966. doi: 10.1126/science.1161566. [DOI] [PMC free article] [PubMed] [Google Scholar]
- Klionsky DJ, Abeliovich H, Agostinis P. Guidelines for the use and interpretation of assays for monitoring autophagy in higher eukaryotes. Autophagy. 2008;4:151–175. doi: 10.4161/auto.5338. [DOI] [PMC free article] [PubMed] [Google Scholar]
- Eskelinen EL. Maturation of autophagic vacuoles in Mammalian cells. Autophagy. 2005;1:1–10. doi: 10.4161/auto.1.1.1270. [DOI] [PubMed] [Google Scholar]
- Barth S, Glick D, Macleod KF. Autophagy: assays and artifacts. J Pathol. 2010;221:117–124. doi: 10.1002/path.2694. [DOI] [PMC free article] [PubMed] [Google Scholar]
- Kim HS, Park CK. Retinal ganglion cell death is delayed by activation of retinal intrinsic cell survival program. Brain Res. 2005;1057:17–28. doi: 10.1016/j.brainres.2005.07.005. [DOI] [PubMed] [Google Scholar]
- Liang XH, Kleeman LK, Jiang HH, Gordon G, Goldman JE, Berry G, et al. Protection against fatal Sindbis virus encephalitis by beclin, a novel Bcl-2-interacting protein. J Virol. 1998;72:8586–8596. doi: 10.1128/jvi.72.11.8586-8596.1998. [DOI] [PMC free article] [PubMed] [Google Scholar]
- Tan ML, Ooi JP, Ismail N, Moad AI, Muhammad TS. Programmed cell death pathways and current antitumor targets. Pharm Res. 2009;26:1547–1560. doi: 10.1007/s11095-009-9895-1. [DOI] [PubMed] [Google Scholar]
- Nishiyama J, Miura E, Mizushima N, Watanabe M, Yuzaki M. Aberrant membranes and double-membrane structures accumulate in the axons of Atg5-null Purkinje cells before neuronal death. Autophagy. 2007;3:591–596. doi: 10.4161/auto.4964. [DOI] [PubMed] [Google Scholar]
- Yue Z. Regulation of neuronal autophagy in axon: implication of autophagy in axonal function and dysfunction/degeneration. Autophagy. 2007;3:139–141. doi: 10.4161/auto.3602. [DOI] [PubMed] [Google Scholar]
- Levkovitch-Verbin H, Quigley HA, Martin KR, Zack DJ, Pease ME, Valenta DF. A model to study differences between primary and secondary degeneration of retinal ganglion cells in rats by partial optic nerve transection. Invest Ophthalmol Vis Sci. 2003;44:3388–3393. doi: 10.1167/iovs.02-0646. [DOI] [PubMed] [Google Scholar]


