Abstract
Periodontitis has a polymicrobial etiology within the framework of a complex microbial ecosystem. With advances in sequencing technologies, comprehensive studies to elucidate bacterial community differences have recently become possible. We used 454 sequencing of 16S rRNA genes to compare subgingival bacterial communities from 29 periodontally healthy controls and 29 subjects with chronic periodontitis. Amplicons from both the V1-2 and V4 regions of the 16S gene were sequenced, yielding 1 393 579 sequences. They were identified by BLAST against a curated oral 16S database, and mapped to 16 phyla, 106 genera, and 596 species. 81% of sequences could be mapped to cultivated species. Differences between health- and periodontitis-associated bacterial communities were observed at all phylogenetic levels, and UniFrac and principal coordinates analysis showed distinct community profiles in health and disease. Community diversity was higher in disease, and 123 species were identified that were significantly more abundant in disease, and 53 in health. Spirochaetes, Synergistetes and Bacteroidetes were more abundant in disease, whereas the Proteobacteria were found at higher levels in healthy controls. Within the phylum Firmicutes, the class Bacilli was health-associated, whereas the Clostridia, Negativicutes and Erysipelotrichia were associated with disease. These results implicate a number of taxa that will be targets for future research. Some, such as Filifactor alocis and many Spirochetes were represented by a large fraction of sequences as compared with previously identified targets. Elucidation of these differences in community composition provides a basis for further understanding the pathogenesis of periodontitis.
Keywords: oral microbiome, pyrosequencing, 16S rRNA, periodontitis, bacteria
Introduction
Chronic periodontitis is a common disease of adults, and leads to significant treatment costs and to loss of teeth. It has been associated with a number of systemic diseases and conditions (Scannapieco et al., 2010), such as cardiovascular disease and diabetes, and interactions may contribute to these systemic diseases. Chronic periodontitis has a complex etiology dependent on the bacterial community residing in the gingival sulcus. Bacteria may be directly pathogenic or may stimulate damaging host inflammatory responses. The core oral microbiome appears to consist of <1000 species-level taxa (Dewhirst et al., 2010; Griffen et al., 2011), although any number of species may appear transiently in a site so open to the environment.
Periodontitis is thought to have a polymicrobial etiology, but comprehensive studies to elucidate differences between health and disease for the complex communities that make up the oral microbiome have only recently become possible. Early studies based on cultivation were extremely difficult to perform and yielded confusing and contradictory results. Community members had variable growth requirements and rates, many taxa did not grow well in culture, and nearly all were difficult to identify definitively. Targeted approaches such as DNA hybridization and PCR-based assays provided more power to track variation in levels of individual species, but did not provide a comprehensive view of communities. Using whole-genomic hybridization, Socransky et al. (1998) delineated a set of three species showing strong associations with periodontal disease and with each other: Porphyromonas gingivalis, Treponema denticola and Tannerella forsythia. Subsequently, this list of potential pathogens was expanded using species-specific 16S primers for PCR amplification (Kumar et al., 2003), but these studies did not provide a comprehensive view of bacterial communities. 16S rRNA gene amplification and sequencing has resulted in a major advance. Earlier studies using cloning and Sanger sequencing (Kumar et al., 2005, 2006) suffered from the shallowness of the sequencing effort; it simply wasn't economically possible to obtain enough sequence information to plumb the complexity of the system. The advent of 454 pyrosequencing of 16S rRNA genes has allowed the collection of thousands of sequences per sample (Keijser et al., 2008; Zaura et al., 2009), and provides the power to comprehensively study bacterial community composition at the level of species. We used this technique to compare samples from patients with periodontitis and healthy controls, to further our understanding of bacterial ecology in this disease. Bacterial community differences between health and disease were demonstrated at all taxonomic levels, implicating large numbers of additional species that will be targets for future research. Major shifts at the level of phylum and class in community composition were shown, and these will provide a basis for further understanding host–microbe interactions in periodontitis and health.
Materials and methods
Participants
Subjects with periodontitis and periodontally healthy controls were recruited from the clinics at the OSU College of Dentistry for this institutionally approved study. Inclusion criteria for all subjects were minimum age 35 years, minimum number of teeth 20, no antibiotic therapy or professional cleaning within the past 3 months, not on immunosuppressant medications or steroids, and no diabetes or HIV. For inclusion in the periodontitis group, subjects were required to exhibit at least 4 mm attachment loss and 5 mm probing depth in at least three non-adjacent interproximal sites in at least two quadrants. Healthy controls were required to have no pockets with probing depth >4 mm.
Ethics statement
Participants provided informed consent via a signed statement before participation. The human subjects protocol was approved by the Ohio State University Institutional Review Board (protocol 2007H0064).
Sample collection and preparation
All exams were performed by a single, calibrated examiner (PK)
After the removal of supragingival plaque and drying the target sites, subgingival samples were collected by insertion of four medium paper points for 10 s into three sites. Deep and shallow sites were sampled separately from subjects with periodontitis. Bacteria pooled from the three sites were eluted from the paper points in 300 μl of TE buffer and homogenized with 0.25 g of 0.1 mm glass beads in a BioSpec Products BeadBeater. DNA was purified with QiaAmp DNA mini kits (Qiagen, Valencia, CA, USA).
Preparation of 16S rRNA gene amplicon libraries and sequencing
Oligonucleotide primers targeting both the V1-2 and V4 hypervariable regions were designed based on previously described bacterial universal primers. The sequences were modified to reflect the composition of the oral microbiota using full-length 16S rRNA sequences (Griffen et al., 2011). For V1-2, we used a modification of the 27F primer (Lane, 1991), fused to six-nucleotide multiplexing tags and to the 454 FLX sequencing primer A (5′-GCCTCCCTCGCGCCATCAGxxxxxxGTTTGATCMTGGCTCAG-3′), where the × region represents the multiplexing tag and the SSU rRNA primer is bold. To allow multiplex sequencing, 30 primers, each with a different key tag, were synthesized and HPLC purified (Integrated DNA Technologies, Coralville, IA, USA). The reverse oligonucleotide primer was a fusion of the 454 FLX sequencing primer B and a modified version of primer 342R (Weisburg et al., 1991) (5′-GCCTTGCCAGCCCGCTCAGCTGCTGCCTYCCGTA-3′), where the 16S rRNA region is in bold. For amplifying the V4 region, we used modifications of the primers described on the RDP (Cole et al., 2009) Pyrosequencing website (http://rdp.cme.msu.edu/). The forward primer oligonucleotides contained the sequence 5′-TNAYTGGGYRTAAAG-3′ fused to the barcoded 454 FLX sequencing primer A, whereas the reverse oligonucleotide was 5′-TACYVGGGTATCTAATCC-3′, fused to the 454 FLX sequencing primer B.
Amplification of the V4 region was performed in 50-μl reactions composed of 1 × polymerase buffer, 200 μM each dNTP, 2.5 mM MgSO4, 500 nM forward primers, 300 nM reverse primer, 1 U of Platinum Taq DNA Polymerase High-Fidelity enzyme (Life Technologies, Grand Island, NY, USA) and 20–50 ng of gDNA. Each amplification began with a denaturation step of 94 °C for 2 min. This was followed by 27 cycles of 94 °C for 15 s, 52 °C for 20 s and 68 °C for 30 s. Amplification cycles were followed by a final extension at 68 °C for 3 min. Amplification of the V1-2 region was performed in 50-μl reactions composed of 1 × polymerase buffer, 200 μM each dNTP, 3 mM MgSO4, 300 nM of forward primer, 300 nM reverse primer, 1 U of Platinum Taq DNA Polymerase High Fidelity enzyme and 20–50 ng of gDNA. Each amplification began with a denaturation step of 94 °C for 2 min. This was followed by 25 cycles of 94 °C for 20 s, 53 °C for 30 s and 68 °C for 45 s Amplification cycles were followed by a final extension at 68 °C for 3 min. Negative control reactions without template were always performed.
Amplicons were visualized using 2% (w/v) agarose gels stained with ethidium bromide and were purified using AMPure paramagnetic beads (Agencourt Bioscience Corporation, Beverly, MA, USA), according to manufacturer's protocol, followed by concentration and size-distribution analysis using DNA 1000 chips on an Agilent 2100 Bioanalyzer (Agilent Technologies, Inc., Waldbronn, Germany). Purified amplicons were prepared for sequencing using the unidirectional amplicon library sequencing protocol with the emPCR Kit II (Roche Diagnostics, Indianapolis, IN, USA) followed by sequencing on a 454 Life Sciences Genome Sequencer FLX (Roche Diagnostics, Indianapolis, IN, USA). Overall, 20 samples were analyzed on each of the two halves of each 454 sequencing plate. Data are archived at NCBI Sequence Read Archive (SRA) under Accession SRP009299.
Sequence processing and analysis
The sequences were parsed by barcodes using the Ribosomal Database Project's Pipeline Initial Process. V4 amplicons were screened for the presence of both forward and reverse primers, allowing up to two mismatches for each primer, no ambiguous base calls and a 200-base minimum sequence length. V1-2 amplicons were screened with up to two mismatches of the forward primer, zero ambiguous base calls and a 200-base minimum sequence length.
BLAST searches (Altschul et al., 1990) were carried out against our in-house created database of oral 16S rRNA sequences (Griffen et al., 2011). Queries that matched the closest database sequence at ⩾98% identity over an alignment of at least 150 bp were assigned to the respective species-level taxa. The remaining unassigned sequences were clustered at 1% divergence using BLAST and a custom PHP script. Clusters with 25 or more members were identified and classified as previously described (Griffen et al., 2011). The data were normalized as percent of total for each taxon for each sample and taxa averaged for the V1 and V4 sequences.
Statistical analysis
In order to determine which taxonomic groups were significantly different between health and disease, we compared the healthy control samples with the disease deep pocket samples using a Mann–Whitney–Wilcoxon signed rank test (function wilcox_test in the coin package of R). We adjusted the obtained P-values by a Benjamini–Hochberg false discovery rate correction (function p.adjust in the stats package of R). The median correction factor for significant species was 6.69-fold (range 3.36–592). We ranked taxa that had adjusted p-values of <0.05 by the mean difference of abundance between the two types of site.
To generate smooth mean rarefaction curves from our samples, we used a weighted mean method. We determined the number of species per sample that were identified for every 20 sequences up to 500 and every 500 after that. At each point before samples ‘dropping out' because of having fewer total sequences than the next point, we calculated a weighting factor equal to the overall mean divided by the mean omitting samples that would be dropped by the next point. We calculated a cumulative weighting factor by multiplying the weighting factor for that point by any previous weighting factor and used that to adjust the mean for the next point.
To compare Gram staining, cultivation status and biodiversity between the three kinds of sites, we used linear mixed effects models with random intercept terms accounting for the non-independence of the shallow and deep samples from the same patients (function lme in the nlme package of R). The models were weighted to account for unequal variances between sites. Post hoc tests were paired and unpaired t-tests.
Fast UniFrac analysis
To construct a reference tree, full-length 16S rRNA sequences obtained from the CORE database (Griffen et al., 2011) aligned according to secondary structure were supplemented with 38 partial sequences obtained during this study that represented novel taxa. The resulting alignment contained 1029 sequences. A maximum likelihood tree was constructed using RAxML v7.0.4, under a GAMMA model of nucleotide substitution, optimized by 100 independent searches. As a first step in Fast UniFrac analysis, the V4, V1 and the combined V1–V4 datasets (Vx) were independently blasted against the oral reference dataset using the command blastall -p blastn -n T -d OSUdb -i Vx -e 1e-30 -b 5 -m 9 -o blast_output.txt. To create the sample ID mapping file for Fast UniFrac, we used the python script ‘create_unifrac_env_file_BLAST.py' installed with the PyCogent toolkit. The reference tree, the sample ID mapping file and a category mapping file that contain the individual samples metadata were analyzed using the online FastUniFrac software under the unweighted and weighted options (Hamady et al., 2009).
Results
Subgingival bacterial communities were sampled from 29 periodontally healthy control individuals and from shallow and deep pockets of 29 patients with chronic periodontitis. Clinical metrics for the participants are detailed in the Table 1. No significant differences were observed between the healthy and periodontitis group for age or smoking status, although the periodontitis group included a larger fraction of males. As expected, periodontal indices including a marker of inflammation (bleeding on probing) and probing depths were greater for deep sites in the group with periodontitis than for healthy sites.
Table 1. Summary of meta-data on patient and control populations. Numbers shown are mean±s.d.
| Healthy controls |
Periodontitis patients |
P values | ||
|---|---|---|---|---|
| Shallow sites | Deep sites | |||
| Age | 54.1±12.4 years | 51.3±12.6 years | 0.39a | |
| Smoking | 0 of 29 | 6 of 29 | 0.10b | |
| Gender | 10 male, 19 female | 19 male, 10 female | 0.035b | |
| Attachment lossc | ⩽1 mm | ⩾4 mm | – | |
| Probing depth (sampled sites) | 2.81±0.50 mm | 3.20±0.52 mm | 6.15±1.30 mm | <0.0001d |
| Bleeding on probing (sampled sites) | 9.2±23.4% | 29.9±36.0% | 52.9±46% | <0.0001d |
Student's t-test (assuming equal variance).
Fisher's exact test.
Only thresholds recorded.
Linear mixed models.
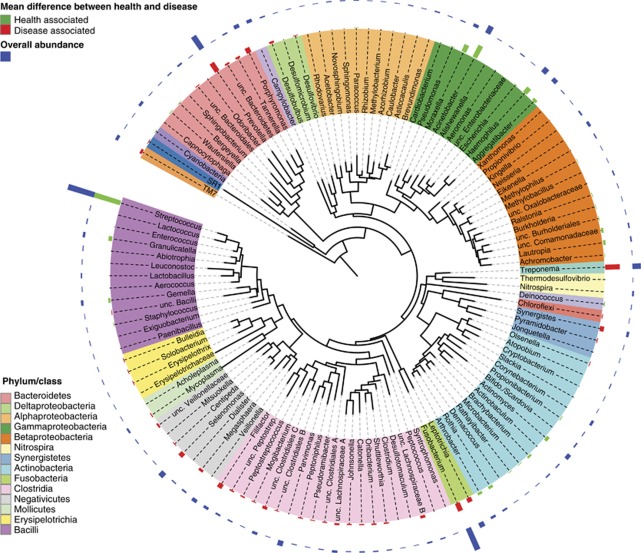
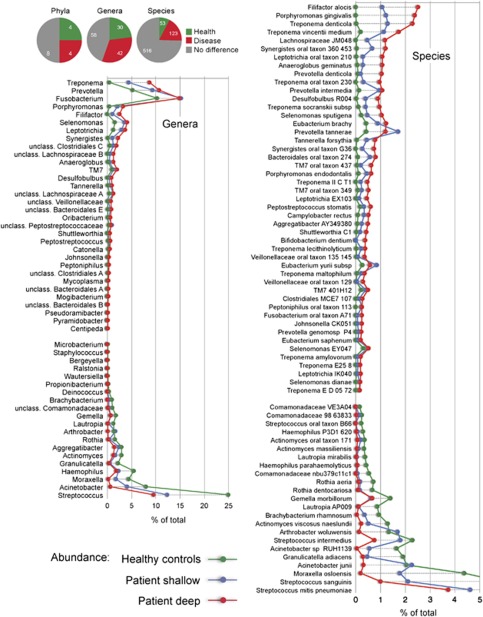
Amplicons from both the V1-2 and V4 hypervariable regions of the 16S gene were sequenced. Breakdown by hypervariable region is detailed below. A total of 16 phyla, 106 genera and 596 species-level taxa were detected. Cumulative counts were normalized and averaged for the two sequenced regions, and expressed as percent of total. Differences between health- and periodontitis-associated bacterial communities were observed at all phylogenetic levels. The phyla Spirochaetes, Synergistetes, and Bacteroidetes were highly associated with disease, whereas the Proteobacteria were found at higher levels in healthy controls. Within the phylum Firmicutes, the class Bacilli was health-associated, whereas the Clostridia, Negativicutes and Erysipelotrichia were associated with disease. A phylogenetic tree at the level of genus is shown in Figure 1. Overall abundance and the magnitude of the difference between health and disease are indicated by bars. Figure 2 shows levels of the most abundant genera and species that differed in health and disease.
Figure 1.
Circular maximum likelihood phylogenetic tree at level of genus. The inner band shows genera colored by phylum or class (see key for taxa with multiple members), the next band shows significant mean differences between healthy controls and deep pockets (colored green for genera higher in healthy pockets and red for genera higher in disease pockets), and the outer band shows overall relative abundance. The tree was constructed in iTOL (Letunic and Bork, 2007).
Figure 2.
Differences between health and disease at level of phylum, genus and species. Pie charts show the number of taxa that were significantly different. The graphs show levels for genera that were ⩾0.1% different and species that were ⩾0.2% different in health and periodontitis samples. Taxa were sorted according to magnitude of change. P⩽0.05 after FDR correction for all taxa shown.
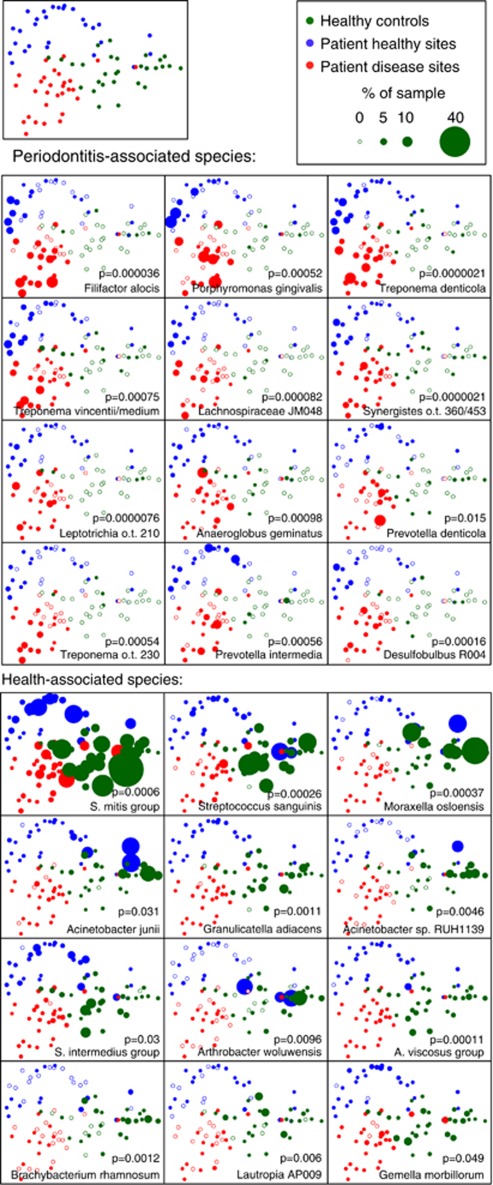
Figure 3 shows 2-dimensional graphs of a principal coordinates analysis (PCoA) of the weighted UniFrac distance between each pair of samples. Bacterial community profiles were highly significantly different among healthy subjects and shallow (healthy) sites and deep (disease) sites in subjects with periodontitis.
Figure 3.
PCoA plots of the UniFrac distance for samples by disease status. Samples from healthy control subjects and deep and shallow sites from subjects with periodontitis are shown. All plots show the ordination of all the samples. The upper-left panel shows unweighted points, and the lower arrays show points weighted by abundance for the 12 species most strongly associated with periodontitis and health. Empty symbols indicate zero abundance of the species.
The ANOSIM test on the UniFrac distances showed P<0.0001 for all pair-wise comparisons among the three groups (one-way comparisons between subjects and two-way nested comparisons within subjects). To visualize the distribution of bacteria among samples, for the top 12 disease-associated and health-associated species, the PCoA was replotted and data points were scaled by the abundance of species of interest in each sample (Figure 3).
Cultivation status
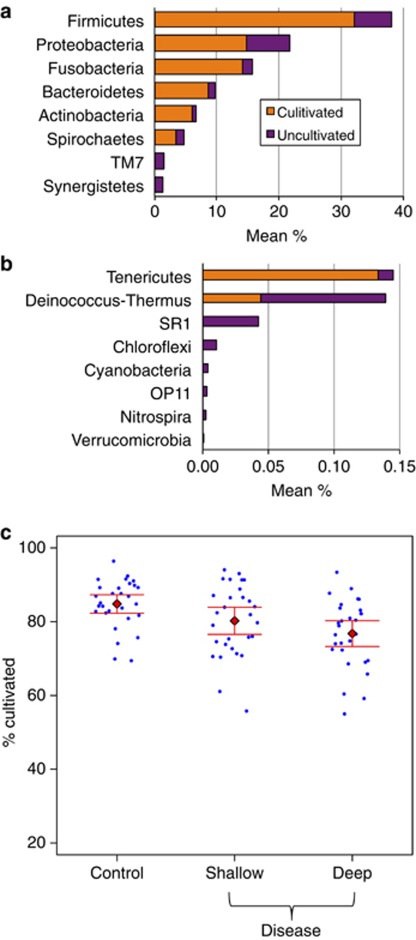
Figures 4a and b show the abundance of cultivated and uncultivated species in common and rare phyla. The preponderance of species, especially in the most common phyla, have been cultivated. Figure 4c depicts the overall abundance of cultivated and uncultivated species by sample, showing that there is considerable sample-to-sample variation, but overall a tendency to have more uncultivated species in the disease condition. Counting species without factoring abundance, over half (25/47) of the disease-associated species shown in Figure 2 are currently uncultivated, but only one-third (8/23) of the health-associated species are uncultivated.
Figure 4.
Relative abundance and fraction of sequences mapped to cultivated species. (a) Overall abundance of cultured and uncultured organisms for abundant phyla. (b) Overall abundance of cultured and uncultured organisms for rare phyla. (c) Percentage of cultivated species by sample type. More uncultivated sequences were observed in disease samples (panel c, P<0.05 for all post hoc paired tests). Overall 81% of sequences mapped to cultivated species.
Gram-stain status
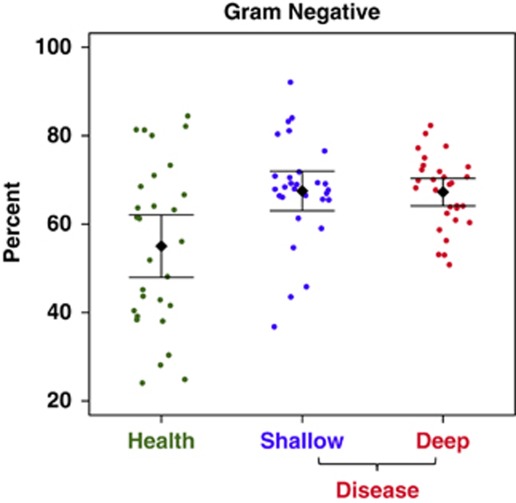
We surmised the probable Gram stain reaction of organisms in our database by literature searches, and used this information to apply to the clinical sequences. Figure 5 depicts a graph of the percentage of Gram-negative organisms in each sample. Again, there is substantial variation between samples, but also a trend toward higher levels of Gram-negative organisms in disease (P=0.002, control vs deep pocket, t-test with unequal variance).
Figure 5.
Gram status by disease status. A small but significant shift to more gram-negative status in periodontitis is seen in this scatter plot with means and 95% CI.
Diversity
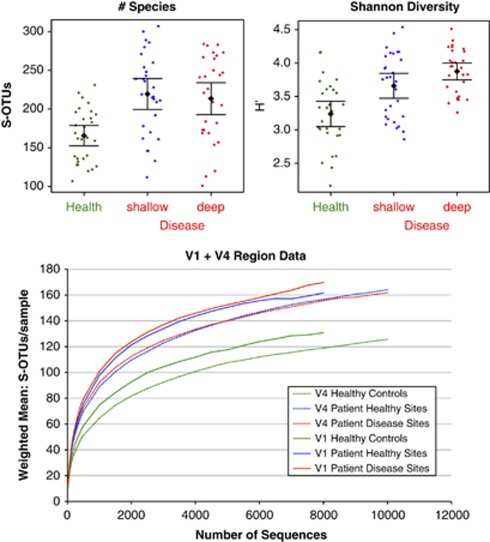
To determine how completely the community diversity was represented by our sequencing efforts, rarefaction curves are shown in Figure 6. Figure 6a shows a tendency towards increased species richness (number of species per sample) in subjects with periodontitis relative to healthy controls (P=0.00003 for control vs shallow pocket, P=0.00022 for control vs deep pocket, t-tests with unequal variance). The Shannon diversity index (Shannon, 1948) (that reflects both richness and evenness) also increased with disease (P=0.002 for control vs shallow pocket, P=0.0000006 for control vs deep pocket, t-tests with unequal variance).
Figure 6.
Diversity in periodontitis and health. Mean number of species is greater in subjects with periodontitis (upper-left panel), and Shannon Diversity Index (species evenness) is greatest in deep sites (upper-right panel). Rarefaction curves are shown in the lower panel for V1-2 and V4 sequence data.
Comparison of data derived from the V1-2 and the V4 regions
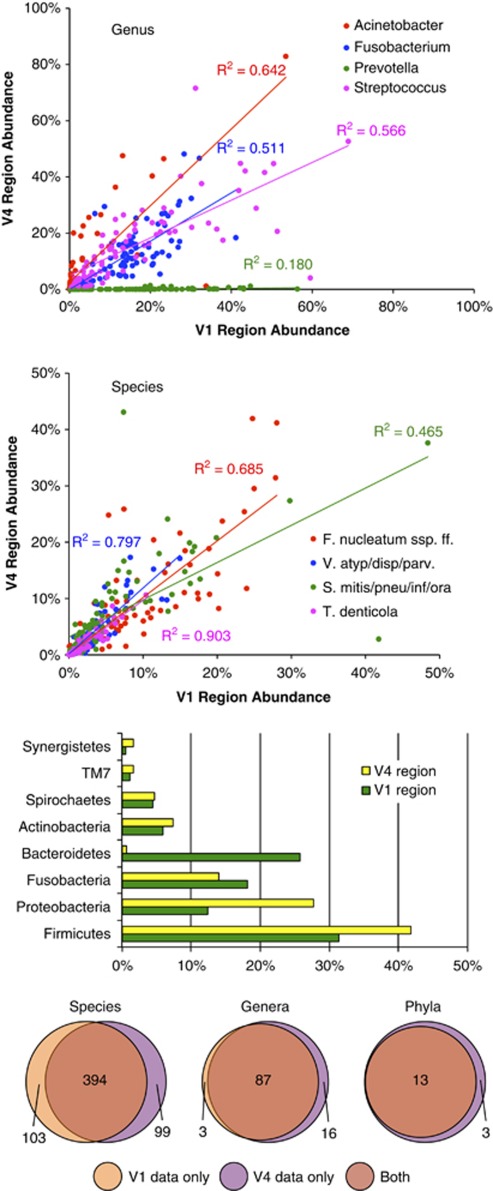
Figure 7 shows a comparison of community profiles obtained from V1-2 and V4 amplicons. Yield was 516 478 sequence reads from the V1-2 region and 877 101 from the V4 region. The mean number of sequences per sample was 5520±2030 (s.d.) for the V1-2 region, and 9737±2303 for the V4 region. Overall 93% of the V1-2 reads and 97% of the V4 reads were identified, to species OTU level as defined in the CORE database (Griffen et al., 2011). Figure 7 shows scatter plots with fitted lines and R2 values for all samples at genus and species level for several abundant taxa. Good agreement was seen between data from the two regions, except in the case of the genus Prevotella, for which there was very little V4 data. Figure 7 also shows abundance data from the V1-2 and V4 regions for the most prevalent phyla and Venn diagrams of the total number of taxa found in each of the data sets at the levels of species, genus and phylum.
Figure 7.
Comparison of community profiles obtained from the V1-2 and V4 variable regions. The top two panels show correlations for highly abundant genera and species. The species abbreviations refer to Fusobacterium nucleatum, subspecies fusiforme, the Veillonella atypical/dispar/parvula group, the Streptococcus mitis/pneumoniae/infantis/oralis group, and Treponema denticola. The bar graph shows abundance or the most prevalent phyla. The bottom panel is a Venn diagram showing the intersection for the two regions at the level of species, genus and phylum. The V1-2 region is referred to as V1 in the graphics.
Discussion
Recent advances in DNA sequencing and bioinformatics technologies have made possible two orders of magnitude higher resolution of bacterial community composition. This study, carried out using 454 pyrosequencing of subgingival samples from a group of individuals with chronic periodontitis and matched periodontally healthy controls, showed fundamental and clear differences in community composition that were not evident using less-powerful approaches. This work confirms previous findings that certain species are more common in disease, but provides a much broader picture of overall community differences and a much deeper look at community complexity, thereby expanding knowledge of putative pathogenic species.
Global differences between health- and disease-associated communities were clearly visualized by the separation of groups in PCoA using the UniFrac distance (Figure 3) comparing the phylogenetic similarity of bacterial communities. All three groups of samples were highly significantly different, and healthy periodontal sites in patients with disease were intermediate between healthy gingiva in disease-free subjects and deep pockets in patients.
We were able to make additional general observations about the bacterial population shifts accompanying periodontitis. Measures of diversity, both the number of species and the combination of richness and evenness reflected in the Shannon index, were higher in periodontitis than in health (Figure 6). Health-associated species were not generally lost, but accounted for a smaller fraction of the total community. Considered from the bacterial point of view, this more diverse community represents a more stable and healthy ecosystem. This diversity may result from subverting host defenses that would limit community composition to non-pathogenic commensals. In contrast, in dental caries bacterial community composition becomes less diverse during disease progression (Gross et al., 2010), as species are lost in a dietary substrate-driven lowering of pH from lactate production that has been termed an ‘ecological catastrophe' (Marsh, 2003) for both commensals and the host.
The historic view of periodontitis-associated subgingival communities is that they are predominantly Gram negative, and health-associated communities are Gram positive. However, this appears to be an over simplification, and it has been suggested that staining artifacts may account for the earlier assessment (Wade, 2011). At least one Gram positive, Filifactor alocis, is potentially important in disease, but all communities are mixed with respect to Gram-stain reaction. The small increase in proportion of Gram negatives in disease as compared with health is predominantly accounted for by decreases in the proportions of two health-associated species of streptococci.
In contrast to an earlier view that the oral microbiome consists of large numbers of uncultivated species (Paster et al., 2001), the majority of sequences could be mapped to cultivated species (with a 98% identity threshold) as shown in Figure 4. The number of species ranged between 100 and 300 in a single individual, and a total of 692 species were detected overall. Some recent sequencing efforts have estimated much higher numbers of species and a higher fraction of uncharacterized species (Keijser et al., 2008; Pushalkar et al., 2011). There are several potential explanations for the differences observed. The previous studies sampled different locations in the mouth and examined different regions of the 16S gene. Also the methods of data analysis that we used, although potentially not identifying very rare species, may avoid considering rare transient species or artifacts generated by PCR or sequencing. We used stringent filters for the sequence data and then searched against a highly curated locally hosted database of 16S sequences that was constructed to minimize ambiguity. There were somewhat more organisms present representing uncultivated groups in the disease-group samples. This difference was relatively small in magnitude and less than inter-sample variability, but statistically supported.
The details of the differences among groups at the level of genus and species are shown in Figures 2 and 3. Such clear-cut differences between periodontitis and health at the level of phylum and genus are a new finding, and suggest that fundamental shifts in the functional profile of the community are occurring. Our data confirms the association of specific species with disease, including P. gingivalis, T. denticola and T. forsythia (Socransky et al., 1998). However, we also observed a large number of additional species that show significant associations with disease (Figure 2). Additionally, although we find that P. gingivalis and T. denticola are two of the top three disease-associated species, Filifactor alocis appears to be at least as prevalent and strongly disease-associated. Meanwhile, T. forsythia only ranks as the sixteenth most abundant disease-associated organism. The role of P. gingivalis in periodontitis has been heavily studied, but the Spirochetes, Filifactor alocis and a number of uncultivated species clearly deserve more attention. Some of the disease-associated species are present in samples from healthy individuals, and increase in disease (Figure 2). Perhaps the more interesting species are those that are only present in disease, since they seem more likely to account for pathogenesis. The major health-associated species are suppressed but not lost in disease, suggesting that a simple probiotic approach of introducing healthy species may not be effective without addressing the presence of pathogens.
A fundamental problem with epidemiologic research is establishing causality, and one possible explanation for the presence of many of the disease-associated species is that the deep pockets in periodontitis form novel habitats that allow additional species to find niches. However, as seen in Figures 2 and 3, the preponderance of disease-associated organisms is also found in the shallow pockets of subjects with disease. This suggests that the community shifts that are observed are not solely due to the presence of deeper pockets with lower oxygen concentrations. Potentially, the shallow pockets in persons with disease may represent an intermediate stage in disease development. If so, the presence of the pathogenic bacteria even without disease symptoms could be prognostic for future disease. Further studies will be needed to test these possibilities.
In the current study, we went beyond previous work by sequencing two regions of the 16S gene. This approach was made possible by the fact that we classified sequences by BLAST matching to full-length sequences in our CORE database (Griffen et al., 2011). Although there was fairly high correlation between results with the two regions, there were some key differences between the results, such as the paucity of sequences from phylum Bacteroidetes in the V4 data. This was not due to primer mismatch, as the V4 primers that we used matched the Bacteroidetes sequences in our database well (exact match to 90% of Bacteroidetes vs 88% of all others). Potentially, the base sequence between the primers may be less amplifiable in Bacteroidetes. Overall, our results suggest that sequencing of multiple regions of the 16S gene may be important in sampling the full diversity of bacterial populations.
These results provide a much more complete picture of the structure of the microbiome in periodontitis and health than was previously available. Although we confirm previous observations of species associated with periodontitis, we also extend those findings, implicating large numbers of additional species that will be targets for future research and elucidating major shifts in phylogenetic community composition that could provide the basis for further understanding host–microbe interactions in health and disease.
Acknowledgments
This work was supported by NIDCR Grant no. R01DE010467. We would like to thank Danny Dayeh, James DiFranco, Jennifer Harris and Migun Shakya for technical support. JHC, ZKY and MP were sponsored by the US Department of Energy Office of Science, Biological and Environmental Research programs at Oak Ridge National Laboratory (ORNL). ORNL is managed by UT-Battelle, LLC, for the US Department of Energy under contract DE-AC05-00OR22725.
References
- Altschul SF, Gish W, Miller W, Myers EW, Lipman DJ. Basic local alignment search tool. J Mol Biol. 1990;215:403–410. doi: 10.1016/S0022-2836(05)80360-2. [DOI] [PubMed] [Google Scholar]
- Cole JR, Wang Q, Cardenas E, Fish J, Chai B, Farris RJ, et al. The ribosomal database project: improved alignments and new tools for rRNA analysis. Nucleic Acids Res. 2009;37:D141–D145. doi: 10.1093/nar/gkn879. [DOI] [PMC free article] [PubMed] [Google Scholar]
- Dewhirst FE, Chen T, Izard J, Paster BJ, Tanner AC, Yu WH, et al. The human oral microbiome. J Bacteriol. 2010;192:5002–5017. doi: 10.1128/JB.00542-10. [DOI] [PMC free article] [PubMed] [Google Scholar]
- Griffen AL, Beall CJ, Firestone ND, Gross EL, DiFranco JM, Hardman JH, et al. CORE: a phylogenetically-curated 16S rDNA database of the core oral microbiome. PLoS ONE. 2011;6:e19051. doi: 10.1371/journal.pone.0019051. [DOI] [PMC free article] [PubMed] [Google Scholar]
- Gross EL, Leys EJ, Gasparovich SR, Firestone ND, Schwartzbaum JA, Janies DA, et al. Bacterial 16S sequence analysis of severe caries in young permanent teeth. J Clin Microbiol. 2010;48:4121–4128. doi: 10.1128/JCM.01232-10. [DOI] [PMC free article] [PubMed] [Google Scholar]
- Hamady M, Lozupone C, Knight R.2009. Fast UniFrac: facilitating high-throughput phylogenetic analyses of microbial communities including analysis of pyrosequencing and PhyloChip data. ISME J 417–27. [DOI] [PMC free article] [PubMed]
- Keijser BJ, Zaura E, Huse SM, van der Vossen JM, Schuren FH, Montijn RC, et al. Pyrosequencing analysis of the oral microflora of healthy adults. J Dent Res. 2008;87:1016–1020. doi: 10.1177/154405910808701104. [DOI] [PubMed] [Google Scholar]
- Kumar PS, Griffen AL, Barton JA, Paster BJ, Moeschberger ML, Leys EJ. New bacterial species associated with chronic periodontitis. J Dent Res. 2003;82:338–344. doi: 10.1177/154405910308200503. [DOI] [PubMed] [Google Scholar]
- Kumar PS, Griffen AL, Moeschberger ML, Leys EJ. Identification of candidate periodontal pathogens and beneficial species by quantitative 16S clonal analysis. J Clin Microbiology. 2005;43:3944–3955. doi: 10.1128/JCM.43.8.3944-3955.2005. [DOI] [PMC free article] [PubMed] [Google Scholar]
- Kumar PS, Leys EJ, Bryk JM, Martinez FJ, Moeschberger ML, Griffen AL. Changes in periodontal health status are associated with bacterial community shifts as assessed by quantitative 16S cloning and sequencing. J Clin Microbiol. 2006;44:3665–3673. doi: 10.1128/JCM.00317-06. [DOI] [PMC free article] [PubMed] [Google Scholar]
- Lane D.199116S/23S rRNA sequencingIn: Stackebrant E, Goodfellow M (eds).Nucleic Acid Techniques in Bacterial Systematics John Wiley & Sons: New York; 115–175. [Google Scholar]
- Letunic I, Bork P. Interactive Tree Of Life (iTOL): an online tool for phylogenetic tree display and annotation. Bioinformatics. 2007;23:127–128. doi: 10.1093/bioinformatics/btl529. [DOI] [PubMed] [Google Scholar]
- Marsh PD. Are dental diseases examples of ecological catastrophes. Microbiology. 2003;149:279–294. doi: 10.1099/mic.0.26082-0. [DOI] [PubMed] [Google Scholar]
- Paster BJ, Boches SK, Galvin JL, Ericson RE, Lau CN, Levanos VA, et al. Bacterial diversity in human subgingival plaque. J Bacteriol. 2001;183:3770–3783. doi: 10.1128/JB.183.12.3770-3783.2001. [DOI] [PMC free article] [PubMed] [Google Scholar]
- Pushalkar S, Mane SP, Ji X, Li Y, Evans C, Crasta OR, et al. Microbial diversity in saliva of oral squamous cell carcinoma. FEMS Immunol Med Microbiol. 2011;61:269–277. doi: 10.1111/j.1574-695X.2010.00773.x. [DOI] [PMC free article] [PubMed] [Google Scholar]
- Scannapieco FA, Dasanayake AP, Chhun N. Does periodontal therapy reduce the risk for systemic diseases. Dent Clin North Am. 2010;54:163–181. doi: 10.1016/j.cden.2009.10.002. [DOI] [PubMed] [Google Scholar]
- Shannon CE.1948A mathematical theory of communication Bell Syst Tech J 27379–423.623–656. [Google Scholar]
- Socransky SS, Haffajee AD, Cugini MA, Smith C, Kent RL., Jr Microbial complexes in subgingival plaque. J Clin Periodontol. 1998;25:134–144. doi: 10.1111/j.1600-051x.1998.tb02419.x. [DOI] [PubMed] [Google Scholar]
- Wade WG. Has the use of molecular methods for the characterization of the human oral microbiome changed our understanding of the role of bacteria in the pathogenesis of periodontal disease. J Clin Periodontol. 2011;38 Suppl 11:7–16. doi: 10.1111/j.1600-051X.2010.01679.x. [DOI] [PubMed] [Google Scholar]
- Weisburg WG, Barns SM, Pelletier DA, Lane DJ. 16S ribosomal DNA amplification for phylogenetic study. J Bacteriol. 1991;173:697–703. doi: 10.1128/jb.173.2.697-703.1991. [DOI] [PMC free article] [PubMed] [Google Scholar]
- Zaura E, Keijser BJ, Huse SM, Crielaard W. Defining the healthy “core microbiome” of oral microbial communities. BMC Microbiol. 2009;9:259. doi: 10.1186/1471-2180-9-259. [DOI] [PMC free article] [PubMed] [Google Scholar]


