Abstract
Background
Barrett's esophagus (BE) is one of the most common premalignant lesions and can progress to esophageal adenocarcinoma (EA). The numerous molecular events may play a role in the neoplastic transformation of Barrett’s mucosa such as the change of DNA ploidy, p53 mutation and alteration of adhesion molecules. However, the molecular mechanism of the progression of BE to EA remains unclear and most studies of mitochondrial DNA (mtDNA) mutations in BE have performed on BE with the presence of dysplasia.
Methods/Findings
Thus, the current study is to investigate new molecular events (Barrett’s esophageal tissue-specific-mtDNA alterations/instabilities) in mitochondrial genome and causative factors for their alterations using the corresponding adjacent normal mucosal tissue (NT) and tissue (BT) from 34 patients having Barrett’s metaplasia without the presence of dysplasia. Eighteen patients (53%) exhibited mtDNA mutations which were not found in adjacent NT. mtDNA copy number was about 3 times higher in BT than in adjacent NT. The activity of the mitochondrial respiratory chain enzyme complexes in tissues from Barrett’s metaplasia without the presence of dysplasia was impaired. Reactive oxygen species (ROS) level in BT was significantly higher than those in corresponding samples.
Conclusion/Significance
High ROS level in BT may contribute to the development of mtDNA mutations, which may play a crucial role in disease progression and tumorigenesis in BE.
Introduction
Patients with Barrett’s esophagus (BE) have a 30 to 125-fold higher risk of developing esophageal adenocarcinoma (EA) than those without this lesion. The presence of BE confers a 0.5∼1% per year risk of the development of EA [1]–[5]. The prevalence of esophageal cancer is increasing in the world and has a poor prognosis mainly because of presentation at late stage. Progression to esophageal cells to cancer follows the metaplasia-dysplasia-adenocarcinoma sequence. Barrett’s metaplasia of esophagus is defined as replacement of the normal squamous epithelium of distal esophagus by metaplastic glandular epithelium containing intestinal-type goblet cells. The numerous molecular events may play a role in the neoplastic transformation of Barrett’s mucosa such as the change of DNA ploidy, p53 mutation and alteration of adhesion molecules. However, the molecular mechanism of the progression of BE to EA remains unclear.
The mitochondrion is an important micro-organelle that produces the energy for cell development, differentiation and growth by inducing apoptosis [6]. mtDNA repair system is inefficient and there is a higher exposure to reactive oxygen species (ROS) produced in the process of adenosine triphosphate (ATP) synthesis. ROS are commonly released in chronic inflammatory tissue. mtDNA is one of the target of ROS and free radicals [7]. With inflammation and excess stress ROS can overwhelm the antioxidant system, which result in damage to mtDNA [6], [8]. Accumulation in mutations in mtDNA, leading to an impairment of mitochondrial function, has been implicated in the etiology of aging, several degenerative pathologies, and tumorigenesis based on the presence of novel hetero-and homoplasmies [9]. Somatic mtDNA mutations play a role in oncogenic transformation and they also can contribute to tumor progression by enhancing the metastatic potential of tumor cells [10]. Thus, the current study is to investigate new molecular events (Barrett’s metaplasia tissue-specific-mtDNA alterations/instabilities) in mitochondrial genome and causative factors for their alterations using the corresponding adjacent normal mucosal tissues and metaplasia tissue from Barrett’s metaplasia without the presence of dysplasia.
Results
mtDNA Sequence Alterations
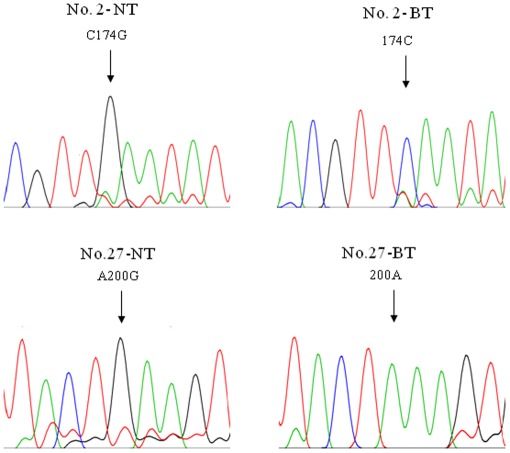
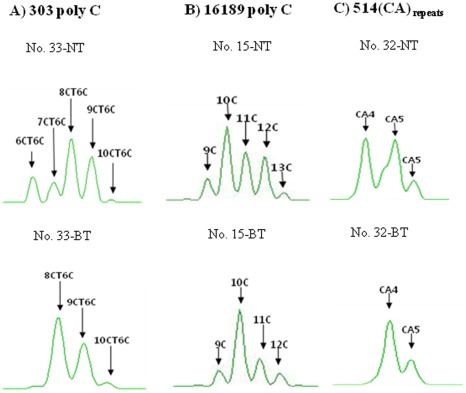
In a set of analyses of the mtDNA control region obtained from adjacent NT and BT, characteristic heteroplasmic substitution mutations in the mtDNA control region were observed in two patients (6%), respectively (Table 1, Fig. 1). mtDNA length heteroplasmic mutation at poly C stretch of 303 poly C, 16189 poly C and 514 (CA) repeat were observed in 18 patients (53%) (Table 1, Fig. 2). Overall, BT-specific mtDNA mutations were observed in 53% (18/34) of all patients.
Table 1. mtDNA substitution and length heteroplasmic mutations in Barrett’s metaplasia tissue (BT) and adjacent normal mucosal tissue (NT).
| Mutationstatus | mtDNAgenesorregions | Samples from patients with Barrett’s esophagus | PatientID | No. | % | |
| NT | BT | □ | □ | □ | ||
| Substitution | Control/HV2 | C174G/T | 2 | 1 | ||
| Control/HV2,HV1 | A200G, T16136C, T16172C, A16183C | 27 | 1 | |||
| Subtotal | 2 | 5.9 | ||||
| Length hetero- plasmic mutation | 303 Poly C | 8CT6C+9CT6C+10CT6C | 8CT6C+9CT6C+10CT6C+11CT6C | 1 | 1 | |
| 8CT6C+9CT6C+10CT6C | 7CT6C+8CT6C+9CT6C+10CT6C+11CT6C+12CT6C | 2 | 1 | |||
| 7CT6C+8CT6C+9CT6C | 7CT6C+8CT6C | 5 | 1 | |||
| 8CT6C+9CT6C+10CT6C+11CT6C+12CT6C | 8CT6C+9CT6C+10CT6C+11CT6C+12CT6C+13CT6C+14CT6C | 9 | 1 | |||
| 6CT6C+7CT6C+8CT6C | 6CT6C+7CT6C+8CT6C+9CT6C+10CT6C | 12 | 1 | |||
| 15C+16C+17C+18C+19C+20C | 15C+16C+17C+18C | 13 | 1 | |||
| 7CT6C+8CT6C+9CT6C | 14C+15C+16C+17C+18C | 16 | 1 | |||
| 8CT6C+9CT6C | 8CT6C+9CT6C+10CT6C | 34 | 1 | |||
| 16189 Poly C | 9C+10C+11C+12C+13C | 9C+10C+11C+12C | 15 | 1 | ||
| 4CT4C+5CT4C | 3CT4C+5CT4C | 17 | 1 | |||
| 9C+10C+11C+12C | 10C+11C+12C | 21 | 1 | |||
| 10C+11C | 9C+10C+11C | 31 | 1 | |||
| 514 CA | CA4+CA5 | CA4 | 32 | 1 | ||
| 303 Poly C | 7CT6C+8CT6C+9CT6C+10CT6C | 5CT6C+6CT6C+7CT6C+8CT6C+9CT6C | 8 | 1 | ||
| 16189 Poly C | 9C+10C+11C+12C+13C | 10C+11C+12C+13C | ||||
| 303 Poly C | 8CT6C+9CT6C+10CT6C+11CT6C | 7CT6C+8CT6C+9CT6C+10CT6C | 26 | 1 | ||
| 16189 Poly C | 5CT4C | 4CT4C+5CT4C | ||||
| 303 Poly C | 8CT6C+9CT6C+10CT6C+11CT6C+12CT6C | 13C+14C+15C+16C+17C | 27 | 1 | ||
| 16189 Poly C | 9C+10C+11C+12C+13C | 10C+11C+12C+13C | ||||
| 303 Poly C | 6CT6C+7CT6C+8CT6C+9CT6C+10CT6C | 8CT6C+9CT6C+10CT6C | 33 | 1 | ||
| 514CA | CA4+CA5 | CA4 | ||||
| Subtotal | 18 | 52.9 | ||||
| Total | 18 | 52.9 | ||||
Figure 1. mtDNA substitution mutations only found in Barrett’s metaplasia tissue.
Sequencing chromatograms showed Barrett’s metaplasia tissue (BT)-specific mtDNA mutations which were only observed in BT. Heteroplasmic mtDNA mutations were observed in HV2 from patient’s No. 2 and 27. These heteroplasmic mutations were not found in the corresponding adjacent normal mucosal tissue (NT).
Figure 2. mtDNA length heteroplasmic mutations in Barrett’s metaplasia tissue.
A gene scan analysis of the poly C stretch region at nucleotide position (np) 303 - 315 (A), np 16184 - 16193 (B) and (CA) repeat starting at np 514 (C) from Barrett’s metaplasia tissues (BT) compared to those from adjacent normal mucosal tissue (NT) demonstrated typical length heteroplasmic mutations in the poly C stretch regions from patient’s No. 33, 15 and 32 respectively.
Spectrum of Length Heteroplasmic Mutations
A gene scan (capillary electrophoresis) showed length heteroplasmies in 303 poly C, 16189 poly C and 514 CA repeats which were confirmed by TA cloning. The pattern of BT-specific length heteroplasmic mutation at 303 poly C region was distributed into 8CT6C+9CT6C+10CT6C+11CT6C, 7CT6C +8CT6C +9CT6C +10CT6C+11CT6C+12CT6C, 7CT6C+8CT6C, 8CT6C+9CT6C+10CT6C+11CT6C+12CT6C+13CT6C+14CT6C, 6CT6C+7CT6C+8CT6C+9CT6C+10CT6C, 15C +16C +17C +18C, 14C +15C +16C +17C +18C, 8CT6C+9CT6C+10CT6C (2.9%/each) (Table 1, Fig. 2). The pattern of BT-specific length heteroplasmic mutation at 514 (CA) repeats in HV2 regions disclosed 4(CA) repeats (2.9%) (Table 1). BT-specific length heteroplasmic mutation at 16189 poly C displayed four types of patterns: 9C +10C +11C +12C, 3CT4C+5CT4C, 10C +11C +12C, 9C +10C +11C (2.9%/each) (Table 1). Specimens that showed dissimilarities in length heteroplasmy between patient adjacent NT and BT were 23% (8 cases) for 303 poly C, 2.9% (1 case) for 514 (CA) repeats and 11% (4 cases) for 16189 poly C. Three patients had BT-specific length heteroplasmic mutations arising in both 303 poly C and 16189 poly C stretch regions. One patient had BT-specific length heteroplasmic mutations from both 303 poly C and 514 (CA) repeats (Table 1).
mtDNA Copy Number
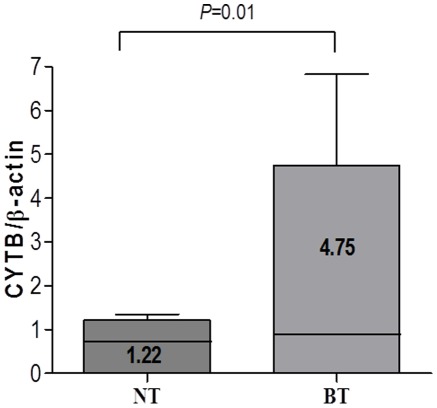
The mtDNA copy number (molecules/ul) from BT and adjacent NT showed 4.75±12.14, 1.22±0.78 (Fig. 3). The mtDNA copy number was significantly increased in BT than adjacent NT (P = 0.01).
Figure 3. Significant increase in mtDNA copy number in Barrett’s metaplasia tissue.
Quantitation of mtDNA copy number was calculated from the ratio of copy number (copies/µl) from mtDNA cytochrome b and nuclear ß-actin gene using real-time PCR. The average mtDNA copy number was significantly increased in Barrett’s metaplasia tissues (BT) compared to those from adjacent normal mucosal tissues (NT) (P = 0.01).
Hydrogen Peroxide Content
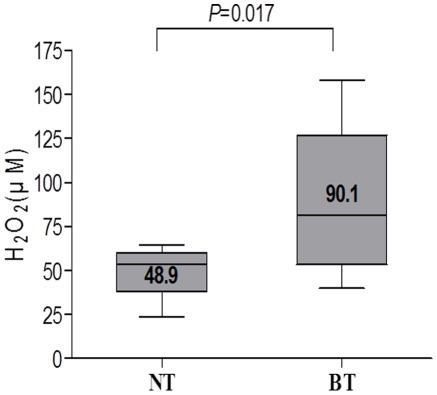
Hydrogen peroxide was measured from BT and corresponding adjacent NT specimen to investigate the cause of BT-specific mtDNA mutations founded in the current study. The level of hydrogen peroxide significantly elevated in supernatants from BT (90.1±50.7 lM/mg protein) compared with those from adjacent NT (48.9±17.6 lM/mg protein) (Fig. 4). The level of hydrogen peroxide in the BT was significantly higher than those from the corresponding samples (P = 0.017).
Figure 4. Production of high level of reactive oxygen species in Barrett’s metaplasia tissue.
Quantitative determination of reactive oxygen species (hydrogen peroxide) from supernatants of Barrett’s metaplasia tissue (BT) and adjacent normal mucosal tissue (NT) was measured by commercial kit (Bioxytech H2O2-560). The level of hydrogen peroxide was significantly elevated in supernatants from BT compared with those from adjacent NT (P = 0.017).
Quantitation of mtDNA Large (4977 bp) Deletion
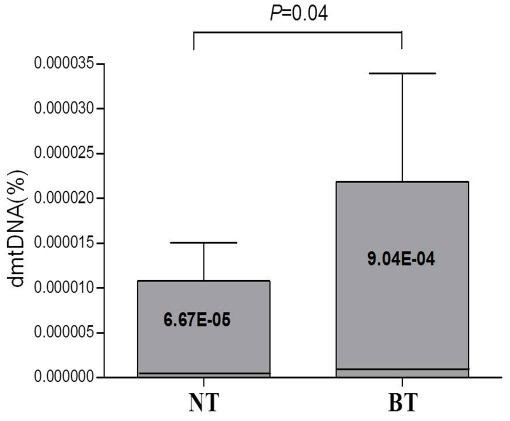
mtDNA large (4977 bp) deletion in BT and matched adjacent NT were quantified using gene scan and real-time PCR which were developed in the current study. The amounts of mtDNA large deletion were significantly increased in BT compared with those from adjacent NT (P = 0.04) (Fig. 5).
Figure 5. Increase of mtDNA large (4977 bp) deletions in Barrett’s metaplasia tissue.
The amounts of mtDNA large deletions were significantly increased in Barrett’s metaplasia tissue (BT) compared with those from matched adjacent normal tissue (NT).
Functional Alteration of Respiratory Chain Enzyme Complex Activity in Barrett’s Tissue
The activity of mitochondrial respiratory chain enzyme complexes in Barrett’s tissue was impaired in comparison with those of the adjacent normal mucosa: Decreased enzyme activity in respiratory chain complexes I, II and III was observed in Barrett’s tissue (Table S3).
Discussion
Carcinogenesis is a long-term, multistep process driven by genetic and epigenetic changes in susceptible cells, which gain a selective growth advantage and undergo clonal expression [11]. BE is a premalignant condition that predisposes to the development of EA. It is detected on endoscopy and confirmed histologically by the presence in the lower esophagus of a metaplastic mucosa, the so-called specialized epithelium, which resembles incomplete intestinal metaplasia in the stomach. The similarities with incomplete intestinal metaplasia is present on histology, mucin histochemistry and immunohistochemistry with various differentiation markers (cytokeratins and MUC antigens). On morphology, the carcinogenetic process of Barrett’s mucosa progresses through increasing grades of epithelial dysplasia. Dysplasia, a synonym of intraepithelial neoplasia, is the only marker that can be used at the present time to delineate a population of patients at high risk of cancer.
Although high-grade dysplasia is considered a precursor to invasive adenocarcinoma, detection of this abnormal mucosa remains controversial and currently requires esophagoscopy with biopsy. It has been suggested that epithelial markers, such as increased activity of mucosal ornithine decarboxylase, sulfomucin production, nuclear DNA aneuploidy, and recently molecular analysis, have also been proposed to identify patients at increased risk for malignant degeneration [12].
Similar to other malignant tumors, carcinogenesis of EA is characterized by several genetic and epigenetic alterations with genetic instability (e.g., loss of heterozygote and/or ploidy), abnormal expression profiles of oncogenes (e.g., c-myc, VEGF and its receptors) and alterations in the DNA-methylation pattern (e.g., hypermethylation of p16, TIMP-3, DAPK, SOCS1 and SOCS3, and hypomethylation of CDX1. Molecular changes are early events in Barrett’s pathogenesis. The prevalence of these molecular alterations increases during the malignant transformation from BE to dysplasia and EA. Although for the majority of hitherto identified genes, the predictive or prognostic value remains unclear. Nearly all of the new markers are not yet validated in prospective controlled or randomized studies [13].
Among the numerous molecular events that have been shown to play a role in the neoplastic transformation of Barrett’s mucosa, only changes in DNA ploidy, increased proliferation, and alterations of the p53 gene have been suggested to be of potential help in the carcinogenesis [14]. As mentioned in introduction, mtDNA mutation has been regarded as oncogenic factors [15]. However, the study on mitochondrial dysfunction and mtDNA mutation was paucity in BE. The mitochondrion is an important microrganelle that produces the energy for cell development, differentiation and cell growth by inducing apoptosis. Human mtDNA contains 16,569 base pairs and represents 0.1∼1.0% of the total genomic DNA. A mammalian cell contains approximately 1,000 mitochondria, and each mitochondrion contains 2 to 10 DNA copies. There is a 10∼20 fold greater susceptibility of mtDNA to genetic mutation because mtDNA does not contain introns in comparison to nuclear DNA, the mtDNA repair system is inefficient and there is a higher exposure to ROS produced in the process of ATP synthesis. ROS plays an important role as potential carcinogens in the pathogenesis of GERD, BE and gastritis [16]. Oxidative damage has long been related to mucosal damages of gastrointestinal tracts and their ensuing carcinogenesis. In spite of treatment with anti-secretory medications for reflux esophagitis, considerable portions of patient did not achieve the complete mucosal healings or suffered from sustaining symptoms or development of dread complication like BE, suggesting other damaging factors or impaired mucosal resistance are also involved in their pathogenesis [17], [18].
BE occurs due to chronic inflammation which is mainly caused by GERD. An increase in ROS production frequently happens in chronic inflammatory cells and tissue. Thus, the current study attempted to detect BT-specific mtDNA alterations with the assumption that mtDNA aberrations are caused by ROS abundantly produced in chronically inflamed BT. mtDNA mutations in the current study were detected exclusively in BT samples but not in adjacent NT. These mtDNA mutations were observed as base substitutions and length heteroplasmy in the control region containing. The oxidative stress elicited by chronic inflammation increases the number of mtDNA mutations in BT and might correlate with a precancerous status [19]. The level of ROS was significantly higher in the supernatants obtained from BT compared with those from the adjacent NT. This high level of ROS might damage the mitochondria, leading to mtDNA mutations. mtDNA control region contains the mtDNA production regulating fraction and HV region known as a ‘hot spot’ of gene mutation in various degenerative diseases and tumors [20].
Recent reports have showed that severe morphological and functional alterations of cells and tissue are accompanied by a decrease of mtDNA copy number [6]. This is known to be a consequence of mtDNA mutation in the region near the replication origin of mtDNA. In contrast, it has been reported that the number of mtDNA copies increases if ATP synthesis is hindered by aging or chronic inflammation [6]. Concurrent with these reports, the number of mtDNA copies measured in BT was approximately four times higher than those in corresponding adjacent NT in the current study.
Recently one study reports that the frequency of specimens with the 4977 bp deletion increased in relation to the degree of dysplasia, so the mtDNA 4977 bp deletion may be useful as a biomarker to detect the severity [9]. The current study also confirms that the amounts of mtDNA large deletion were significantly increased in BT compared with those from either matched adjacent NT.
Importantly, mutations in the control region might alter the rate of DNA replication by modifying the binding affinity of significant trans-activating factors. These mtDNA alterations in BT might further impair a respiratory chain defect resulting in increasing the mtDNA copy number to compensate for the deficiency in ATP. During this perturbation, mitochondria might produce a large amount of ROS, which causes the vicious cycle observed in other chronic inflammatory diseases [17].
BT-specific mtDNA mutations frequently occurred in both the mtDNA control and minisatellite regions due to excessive production of ROS. High level of ROS in BT may contribute to development of mtDNA mutations, which may play a crucial role in pathophysiology of BE and furthermore progression to EA. Although many risk factors are considered in BE and EA, antioxidant treatment seems to be the therapeutics in the prevention or treatment of BE and moreover it plays the preventive role in disease progression.
Materials and Methods
Patient Specimens and Tissue Staining
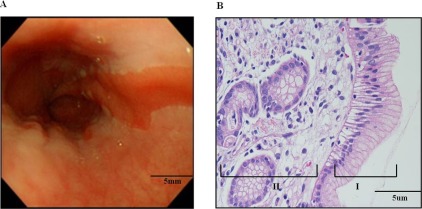
Thirty-four patients were enrolled after receiving Institutional Review Board approval and informed consent. Matched Barrett’s metaplasia tissue (BT) and adjacent normal mucosal tissue (NT) was obtained during the endoscopic procedure (Table S1). A diagnosis of BE was based on findings of endoscopy and specialized intestinal metaplasia on Hematoxylin and Eosin (H&E) stained tissue. Following standard tissue preparation, tissue was embedded in paraffin and was sliced with a microslicer. Sliced tissue was embedded into slides and stained with H&E (Fig. 6).
Figure 6. Endoscopic finding and histological examination of Barrett’s metaplasia.
Endoscopic finding of esophagus shows irregular Z-line, elongated salmon patched tongue like projection of distal columnar epithelium (A). Histological examination (x200) of esophageal lesion reveals surface glandular epithelium with tall columnar cells punctuated by round to oval goblet cells (I). The columnar epithelium resembles intestinal epithelium but is not identical in nature. Barrett’s metaplasia is also characterized by universal presence of chronic inflammation (II) (B).
Direct Sequencing of mtDNA Control Region
BT was obtained in a test tube containing 5 ml phosphate buffered saline (PBS, pH 7.4), sliced into small pieces with a sterilized mesh, and dissolved in protease K and tissue lysis buffer solution, from which DNA was extracted. Extracted total DNA was then dissolved in TE buffer (10 mM Tris-HCl, 1 mM Na2EDTA, pH 8.0) and was quantified with the use of a spectrophotometer. Published protocol was used to amplify and sequence mtDNA control region [20]. The mtDNA sequences obtained were analyzed using the Revised Cambridge Reference Sequence (http://www.mitomap.org/), Blast2 program (http://www.ncbi.nlm.nih.gov/blast/bl2seq/wblast2.cgi) and MitoAnalyzer (http://www.cstl.nist.gov/biotech/strbase/mitoanalyzer.html) to determine mtDNA aberrations (Table S2).
Determination of mtDNA Length Heteroplasmies in the Control Region
mtDNA minisatellites are located in the mtDNA non-coding hypervariable regions (HV) 1 and 2. Size-based amplified product separation by capillary electrophoresis based on published protocol was performed in order to detect length heteroplasmic mutations of 16189 poly C (16184CCCCCTCCCC16193, 5CT4C), 303 poly C (303CCCCCCCTCCCCC315, 7CT5C) and 514 (CA) repeat (514CACACACACA523, (CA)5 repeats) [20], [21] (Table S2).
TA Cloning for Confirmation of Length Heteroplasmic Mutations
The procedure including a set of primer pairs and PCR conditions was carried out according to the published protocol [22]. Each purified PCR product of 303 poly C, 16189 poly C and 514 (CA) repeat was inserted into pGEM-T Easy Vector (Promega, Madison, WI, USA). Competent E. coli (JM 109 cells) were then transformed with the plasmids containing the PCR product inserts. White colonies (8 to 12) including recombinant plasmids were selected and cultured. After plasmids extraction, length heteroplasmic mutations were determined by DNA sequencing (Table S2).
Quantification PCR for Determination of mtDNA Copy Number
To generate a standard curve for quantification of mtDNA, purified PCR product of CYTB and β-actin gene as internal standard were inserted into pGEM-T easy vector and E. coli JM 109 cells (Promega) were transformed in order to obtain recombinant plasmids. A mixture of 25 µl containing 12.5 µl of 2×Quantitect SYBR green PCR master mix (Qiagen, Valencia, CA, USA), 400 µM CYTB primers F14909 (5′-TACTCACCAGACGCCTCAACCG-3′) and R15396 (5′-TTATCGGA ATGGGAGGT GATTC-3′) and 6 ng of total DNA was used for PCR with the Rotor-Gene real-time centrifugal DNA amplification system (Corbett Research, Sydney, Australia). For PCR, hot start reactions at 50°C for 2 min and at 95°C for 15 min were followed by 35 cycles of 20 sec at 94°C, 30 s at 56°C, 30 s at 72°C and a melting reaction with a decrease of 1°C per cycle between 72°C and 92°C. The mtDNA copy number was calculated using the following formula: {X µg/µl plasmid DNA/4419 (plasmid length)×660}×6.022×1023 = Y molecules/ul. The X represents the concentration of plasmid DNA and the Y represents copy number. The mtDNA copy number was reported as the ratio of CYTB and β-actin gene.
Quantitative Determination of Hydrogen Peroxide
BT and adjacent NT were homogenized in 500 µl of ice-cold deionized water. An aliquot of homogenate was taken for protein measurement. After centrifugation at 2000×g for 15 min, an aliquot of 200 µl from supernatant was transferred to new tube. Hydrogen peroxide content (lM/mg protein) from supernatant is measured using the commercial kit (Bioxytech_ H2O2-560TM, OXIS International, Foster City, CA, USA) according to the manufacturer’s instructions.
mtDNA Large(4977 bp) Deletion
For generation of a fluorescent labeled 113 bp fragment of the undeleted mtDNA primers int1F-3448(5′-HEX-CCCTTCGCTGACGCCATA-3′) and int2R-3560 (5′-AGTAGAAGAGCGATGGTGAGAGC-3′) were used. Primers del1F-8395 (5′-HEX-CACCATAATTACCCCCATACTCCTTA-3′) and del2R-13494 (5′-GAGGAAAGG TATTCCTGCTAATGC-3′) were designed to flank the deletion breakpoints and were used to amplify a fluorescent labeled 123 bp amplicon of deleted mtDNA. For PCR, a 50 µl mixture containing 50 ng DNA, 200 µM dNTPs, 25 pmol primary primers, 2.5 U Taq DNA polymerase (TaKaRa LA Taq) and 5 µl 10× buffer. An initial denaturation step at 96°C for 5 min was followed by 20(int) cycles and 45(del) cycles of 15 s at 95°C, 20 sec at 60°C, 20 sec at 72°C and a 5 min extension step at 72°C. Specific fragments for intact and deleted mtDNA were amplified in two different PCR reactions in a thermal cycler (GeneAmp 2400, Applied Biosystems, Weiterstadt, Germany). After PCR was finished, a 1 µl aliquot of each PCR product and 0.5 µl of the internal size standard GS500 (Applied Biosystems) labeled with the fluorescent dye ROX (Applied Biosystems) were added to deionized formamide. Denaturation was performed at 96°C for 10 min followed by a cooling step at −22°C for 2 min. Denatured PCR products were separated by capillary electrophoresis using the ABI Prism 3130XL genetic analyzer (Applied Biosystems). When the run was completed, specific fragments were displayed as peaks in an electropherogram using the Gene Scan Analysis Software 3.1.
Quantitative PCR was conducted with a Rotor-Gene real-time centrifugal DNA amplification system (Corbett Research), at a final reaction volume of 25 µl containing 12.5 µl of 2×QuantiTect SYBR Green PCR master mix (Qiagen), DW, 10 pmol each of the forward primer del-lF (5′-CACCATAATTACCCCCATACTCCTTA-3′) and reverse primers del-2R (5′ GAGGAAAGGTATTCCTGCTAATGC-3′) and other mixture int-1F (5′-CCCTTCGCTGACGCCATA-3′), int-2R (5′-AGTAGAAGAGCGATGGTGAGAGC-3′) for 2 µl of template DNA. After denaturation at 95°C for 15 min, the reaction mixture was cycled 45 cycles at 95°C for 15 sec, 58°C for 30 sec and 72°C for 90 sec. PCR was performed for 45 cycles (deletion primer-1F/2R) and 20 cycles (intact primer-1F/2R). The percentage of the 4977 bp deletion was calculated according to the following formula: f (dmtDNA) = Admt/Amt×1.9608CDmt/1.9613CDdmt×123/113. The followings are abbreviations and explanations for aforementioned formula: f (dmtDNA), frequency of the 4977 bp deletion; Admt, value of peak area of deletion-specific peak; Amt, value of peak area of specific peak of intact mtDNA; CDdmt, number of cycles necessary to detect the 4977 bp deletion; CDmt, number of cycles necessary to detect intact mtDNA.
Determination of Activity of Mitochondrial Respiratory Chain Enzyme Complexes
Cell homogenates were diluted to 1 g/L total protein with 20 mmol/L potassium phosphate buffer (pH 7.2) before respiratory chain complex analysis. Assay conditions were based on previously published spectrophotometric methods [23].
Statistical Analysis
Descriptive data were expressed as mean ± standard deviation. The non-parametric Kruskal-Wallis test was used for the determination of statistical difference in the mtDNA copy number and hydrogen peroxide content between three specimens (BT and adjacent NT). P-value that is lower than 0.05 was considered as statistically significant.
Acknowledgments
The authors would like to thank all patients who participated in the study.
Supporting Information
Age and sex distribution of subjects.
(DOC)
Primers for mtDNA control region PCR, direct sequencing, and gene scan.
(DOC)
Respiratory chain complex I- IV activities in primary Barrett’s metaplasia tissues and adjacent normal tissues.
(DOC)
Footnotes
Competing Interests: The authors have declared that no competing interests exist.
Funding: This work was supported by the Basic Science Research Program through the National Research Foundation of Korea (NRF) funded by the Ministry of Education, Science and Technology (No.2010-0024326). The funders had no role in study design, data collection and analysis, decision to publish, or preparation of the manuscript.
References
- 1.Haggitt RC. Barrett’s esophagus, dysplasia, and adenocarcinoma. Hum Pathol. 1994;25:982–993. doi: 10.1016/0046-8177(94)90057-4. [DOI] [PubMed] [Google Scholar]
- 2.Jankowski JA, Provenzale D, Moayyedi P. Esophageal adenocarcinoma arising from Barrett’s metaplasia has regional variations in the west. Gastroenterology. 2002;122:588–590. doi: 10.1053/gast.2002.31599. [DOI] [PubMed] [Google Scholar]
- 3.Zagorowicz E, Jankowski J. Molecular changes in the progression of Barrett’s oesophagus. Postgrad Med J. 2007;83:529–535. doi: 10.1136/pgmj.2006.052910. [DOI] [PMC free article] [PubMed] [Google Scholar]
- 4.Sharma P, Marcon N, Wani S, Bansal A, Mathur S, et al. Non-biopsy detection of intestinal metaplasia and dysplasia in Barrett’s esophagus: a prospective multicenter study. Endoscopy. 2006;38:1206–1212. doi: 10.1055/s-2006-944974. [DOI] [PubMed] [Google Scholar]
- 5.Sommerer F, Vieth M, Markwarth A, Rohrich K, Vomschloss S, et al. Mutations of BRAF and KRAS2 in the development of Barrett’s adenocarcinoma. Oncogene. 2004;23:554–558. doi: 10.1038/sj.onc.1207189. [DOI] [PubMed] [Google Scholar]
- 6.Park SY, Shin MG, Kim HR, Oh JY, Kim SH, et al. Alteration of mitochondrial DNA sequence and copy number in nasal polyp tissue. Mitochondrion. 2009;9:318–325. doi: 10.1016/j.mito.2009.04.006. [DOI] [PubMed] [Google Scholar]
- 7.Park HW, Ahn Y, Jeong MH, Cho JG, Park JC, et al. Chronic atrial fibrillation associated with somatic mitochondrial DNA mutations in human atrial tissue. J Clin Pathol. 2007;60:948–950. doi: 10.1136/jcp.2007.047134. [DOI] [PMC free article] [PubMed] [Google Scholar]
- 8.Lin PH, Lee SH, Su CP, Wei YH. Oxidative damage to mitochondrial DNA in atrial muscle of patients with atrial fibrillation. Free Radic Biol Med. 2003;35:1310–1318. doi: 10.1016/j.freeradbiomed.2003.07.002. [DOI] [PubMed] [Google Scholar]
- 9.Tan BH, Skipworth RJ, Stephens NA, Wheelhouse NM, Gilmour H, et al. Frequency of the mitochondrial DNA 4977 bp deletion in oesophageal mucosa during the progression of Barrett’s oesophagus. Eur J Cancer. 2009;45:736–740. doi: 10.1016/j.ejca.2009.01.013. [DOI] [PubMed] [Google Scholar]
- 10.Ishikawa K, Takenaga K, Akimoto M, Koshikawa N, Yamaguchi A, et al. ROS-generating mitochondrial DNA mutations can regulate tumor cell metastasis. Science. 2008;320:661–664. doi: 10.1126/science.1156906. [DOI] [PubMed] [Google Scholar]
- 11.Hanahan D, Weinberg RA. The hallmarks of cancer. Cell. 2000;100:57–70. doi: 10.1016/s0092-8674(00)81683-9. [DOI] [PubMed] [Google Scholar]
- 12.Pera M, Trastek VF, Pairolero PC, Cardesa A, Allen MS, et al. Barrett’s disease: pathophysiology of metaplasia and adenocarcinoma. Ann Thorac Surg. 1993;56:1191–1197. doi: 10.1016/0003-4975(95)90050-0. [DOI] [PubMed] [Google Scholar]
- 13.Tischoff I, Tannapfel A. Barrett’s esophagus: can biomarkers predict progression to malignancy? Expert Rev Gastroenterol Hepatol. 2008;2:653–663. doi: 10.1586/17474124.2.5.653. [DOI] [PubMed] [Google Scholar]
- 14.Flejou JF. Barrett’s oesophagus: from metaplasia to dysplasia and cancer. Gut. 2005;54(Suppl 1):i6–12. doi: 10.1136/gut.2004.041525. [DOI] [PMC free article] [PubMed] [Google Scholar]
- 15.Sui G, Zhou S, Wang J, Canto M, Lee EE, et al. Mitochondrial DNA mutations in preneoplastic lesions of the gastrointestinal tract: a biomarker for the early detection of cancer. Mol Cancer. 2006;5:73. doi: 10.1186/1476-4598-5-73. [DOI] [PMC free article] [PubMed] [Google Scholar]
- 16.Baumann S, Keller G, Puhringer F, Napieralski R, Feith M, et al. The prognostic impact of O6-Methylguanine-DNA Methyltransferase (MGMT) promotor hypermethylation in esophageal adenocarcinoma. Int J Cancer. 2006;119:264–268. doi: 10.1002/ijc.21848. [DOI] [PubMed] [Google Scholar]
- 17.Lee S, Shin MG, Jo WH, Kim MJ, Kim HR, et al. Association between Helicobacter pylori-related peptic ulcer tissue and somatic mitochondrial DNA mutations. Clin Chem. 2007;53:1390–1392. doi: 10.1373/clinchem.2007.088047. [DOI] [PubMed] [Google Scholar]
- 18.Lee JS, Oh TY, Ahn BO, Cho H, Kim WB, et al. Involvement of oxidative stress in experimentally induced reflux esophagitis and Barrett’s esophagus: clue for the chemoprevention of esophageal carcinoma by antioxidants. Mutat Res. 2001;480–481:189–200. doi: 10.1016/s0027-5107(01)00199-3. [DOI] [PubMed] [Google Scholar]
- 19.Nishikawa M, Oshitani N, Matsumoto T, Nishigami T, Arakawa T, et al. Accumulation of mitochondrial DNA mutation with colorectal carcinogenesis in ulcerative colitis. Br J Cancer. 2005;93:331–337. doi: 10.1038/sj.bjc.6602664. [DOI] [PMC free article] [PubMed] [Google Scholar]
- 20.Shin MG, Levin BC, Kim HJ, Kim HR, Lee IK, et al. Profiling of length heteroplasmies in the human mitochondrial DNA control regions from blood cells in the Korean population. Electrophoresis. 2006;27:1331–1340. doi: 10.1002/elps.200500551. [DOI] [PubMed] [Google Scholar]
- 21.Shin MG, Kim HJ, Kim HR, Lee IK, Kook H, et al. Mitochondrial DNA minisatellites as new markers for the quantitative determination of hematopoietic chimerism after allogeneic stem cell transplantation. Leukemia. 2007;21:369–373. doi: 10.1038/sj.leu.2404502. [DOI] [PubMed] [Google Scholar]
- 22.Shin MG, Kajigaya S, McCoy JP, Levin BC, Young NS. Marked mitochondrial DNA sequence heterogeneity in single CD34+ cell clones from normal adult bone marrow. Blood. 2004;103:553–561. doi: 10.1182/blood-2003-05-1724. [DOI] [PubMed] [Google Scholar]
- 23.Birch-Machin MA, Briggs HL, Saborido AA, Bindoff LA, Turnbull DM. An evaluation of the measurement of the activities of complexes I-IV in the respiratory chain of human skeletal muscle mitochondria. Biochem Med Metab Biol. 1994;51:35–42. doi: 10.1006/bmmb.1994.1004. [DOI] [PubMed] [Google Scholar]
Associated Data
This section collects any data citations, data availability statements, or supplementary materials included in this article.
Supplementary Materials
Age and sex distribution of subjects.
(DOC)
Primers for mtDNA control region PCR, direct sequencing, and gene scan.
(DOC)
Respiratory chain complex I- IV activities in primary Barrett’s metaplasia tissues and adjacent normal tissues.
(DOC)


