

Abstract
Few large-scale studies have been done to characterize the normal human brain white matter growth in the first years of life. We investigated white matter maturation patterns in major fiber pathways in a large cohort of healthy young children from birth to age two using diffusion parameters fractional anisotropy (FA), radial diffusivity (RD) and axial diffusivity (RD). Ten fiber pathways, including commissural, association and projection tracts, were examined with tract-based analysis, providing more detailed and continuous spatial developmental patterns compared to conventional ROI based methods. All DTI data sets were transformed to a population specific atlas with a group-wise longitudinal large deformation diffeomorphic registration approach. Diffusion measurements were analyzed along the major fiber tracts obtained in the atlas space. All fiber bundles show increasing FA values and decreasing radial and axial diffusivities during the development in the first two years of life. The changing rates of the diffusion indices are faster in the first year than the second year for all tracts. RD and FA show larger percentage changes in the first and second years than AD. The gender effects on the diffusion measures are small. Along different spatial locations of fiber tracts, maturation does not always follow the same speed. Temporal and spatial diffusion changes near cortical regions are in general smaller than changes in central regions. Overall developmental patterns revealed in our study confirm the general rules of white matter maturation. This work shows a promising framework to study and analyze white matter maturation in a tract-based fashion. Compared to most previous studies that are ROI-based, our approach has the potential to discover localized development patterns associated with fiber tracts of interest.
Keywords: white matter maturation, axonal myelination, early brain development, diffusion properties, DTI atlas, fiber tracking, functional regression analysis
Introduction
Human brain white matter maturation is a complex and long lasting process that begins in the fetal period and continues into adulthood. The most significant period of white matter myelination occurs between midgestation and the second postnatal year (Yakovlev and Lecours, 1967, Brody et al., 1987), and accompanies neuronal synaptogenesis and gray and white matter growth (Huttenlocher and Dabholkar, 1997, Glantz et al., 2007, Knickmeyer et al., 2008). Myelin, the insulating lipid-layers wrapped around axons by oligodendrocytes, is essential for fast impulse propagation. Myelination broadly occurs in two partially overlapping stages in which oligodendroglial proliferation and differentiation is followed by myelin deposition around axons (Knickmeyer et al., 2008). White matter myelination is associated with the development of cognitive functions during the human life span (Klingberg et al., 1999, Nagy et al., 2004, Brauer et al., 2011) and is increasingly recognized as playing a role in neuronal plasticity as well (Bengtsson et al., 2005, Lee et al., 2010). Pruning of exuberant axons, including cell death and axonal retraction, continues throughout white matter development as well (Innocenti and Price, 2005, Luo and O'Leary, 2005). Functional properties such as the compound action potential may also influence the white matter structural development (Drobyshevsky et al., 2005). Characterization of normal white matter growth in early years of life has great clinical relevance and could provide important clues to understanding neurodevelopmental and neuropsychiatric disorders, many of which originate from early disturbances during brain structural and functional maturation (Gilmore et al., 2010).
Previous postmortem studies have shown that CNS myelination follows predictable topographical and chronological sequences with myelination occurring in the proximal pathways before distal pathways, in sensory pathways before motor pathways, in projection pathways before association pathways, in central sites before poles, and in occipital poles before frontotemporal poles (Flechsig, 1920, Yakovlev and Lecours, 1967, Brody et al., 1987). The rapidly emerging field of magnetic resonance imaging (MRI) has made it possible to study white matter maturation in vivo. Conventional structural MRI with T1- and T2-weighted signal intensities reveal similar general spatial and temporal maturation sequences as postmortem observations (Barkovich et al., 1988, Bird et al., 1989, Paus et al., 2001). However these studies rely on signal contrast to infer changes in brain structure or biochemistry, which may not be specific to white matter development (Deoni et al., 2011).
Diffusion tensor MR imaging (DTI) provides substantial insights into white matter pathways in the living brain by measuring water diffusion properties in brain tissue (Basser et al., 1994, Le Bihan et al., 2001). Diffusion anisotropy, such as fractional anisotropy (FA), and apparent diffusion coefficients, such as mean (MD), axial (AD), and radial diffusivity (RD), are common diffusion measurements to characterize fiber structural features. These measurements are possible indicators of axonal organization and degree of myelination (Hüppi et al., 1998, Neil et al., 1998, Beaulieu, 2002, Neil et al., 2002, Song et al., 2002). Evidence from in-vivo and in-vitro studies suggest that anisotropic water diffusion in neural fibers is related to the dense packing of axons and their membranes that hinder water diffusion perpendicular to the long axis of the fibers relative to the parallel direction, whereas myelin may modulate the degree of anisotropy in a given fiber tract (Beaulieu, 2002). Animal studies have shown RD to be better representative of histologic changes in demyelination and dysmyelination models (Song et al., 2003, Harsan et al., 2006, Budde et al., 2007, Zhang et al., 2009). An animal study in rabbits reported that postnatal maturation of the compound action potential (CAP) had a developmental pattern similar to FA, and developmental expansion of immature oligodendrocytes may contribute to structural and functional maturation of white matter fiber tracts before myelination (Wimberger et al., 1995, Drobyshevsky et al., 2005). Diffusion parameters have been shown to provide relevant information reflective of white matter maturation (Hüppi et al., 1998, Neil et al., 2002, Lobel et al., 2009). DTI together with fiber tractography (Conturo et al., 1999, Mori and van Zijl, 2002) has been used in many recent white matter development studies, mainly in childhood and adolescence (Schmithorst et al., 2002, Snook et al., 2005, Ding et al., 2008, Lebel et al., 2008, Asato et al., 2010, Verhoeven et al., 2010). Results show that white matter maturation continues into young adults with increasing FA and decreasing RD.
Although the general pattern of adult myelination is present by the end of the second year and myelination continues at a slower rate into adulthood (Hüppi et al., 1998, Sampaio and Truwit, 2001, Mukherjee et al., 2002, Schneider et al., 2004, Hermoye et al., 2006), few in-vivo large scale studies have been done to characterize the normal axonal growth in early years, especially the first two years of life. Studies of premature infants with a small number of healthy neonates for comparison found dramatic myelination and significant gray and white matter volume increases in the peri- and neo-neonatal periods (Hüppi et al., 1998, Peterson, 2003, Partridge et al., 2004, Haynes et al., 2005). Gilmore et al. (Gilmore et al., 2007) showed that maturation of corpus callosum and corticospinal white matter proceeds rapidly in neonatal brains after birth. A study of early white matter maturation focused on one–to-four-month old healthy infants (Dubois et al., 2006, Dubois et al., 2008) and revealed that diffusion indices are correlated with age for most but not all fiber tracts. This study classified fiber bundles to different maturation stages where anterior limb internal capsule (ALIC) and cingulum mature slowest, followed by optic radiations, inferior longitudinal and arcuate fascicles, then by spino-thalmaic tract and fornix, and the cortico-spinal tract mature fastest. A ROI-based study with three-week to two-year-old infants (Gao et al., 2009a) found consistent spatiotemporal development of white matter with increase in FA and decrease in AD and RD, moreover, the second year change of diffusion indices are more subtle compared to the first year change.
Three main processes are thought to crucially influence diffusion measurements changes during development (Dubois et al., 2006, Dubois et al., 2008): 1) fiber organization in fascicles, which would lead to decreased RD and increased AD, and therefore increased FA but relatively unchanged mean diffusivity; 2) the proliferation of glial cell bodies and intracellular compartments (cytoskeleton, etc), associated with a decrease in RD and AD and unchanged FA; 3) axonal myelin synthesis that would correspond to decreased RD and unchanged AD and therefore increased FA. Since the membrane proliferation and myelin synthesis are two partially overlapped stages and the age interval in our study is about one year that may not distinguish cell proliferation and myelin synthesis, we regarded the two developmental processes as one: myelination with decreased RD and AD and increased FA, where the RD change has larger degree compared to changes in AD and FA. The two maturation processes, fiber organization and axonal myelination, are considered in this current work. We expect that FA would increase and RD would decrease given myelination and organization, and AD would also decrease even the two processes might cause inconsistent changes in AD (Gao et al., 2009a).
The aim of our work was to investigate the white matter developmental pattern as indicated in the diffusion parameters FA, RD, and AD in the major fiber pathways of healthy young children using quantitative tractography. Previous white matter maturation studies in infants less than age two are limited by small sample size, and only examine overall diffusion measurements or measurements on several discrete sites along fiber pathways. In the current work, we collected 295 DTI scans from a large cohort of 211 healthy pediatric subjects after birth, and at ages one and two years. Ten major white matter pathways including 21 fiber tracts were identified on a population specific DTI atlas built by unbiased group-wise registration (Goodlett et al., 2006, Goodlett et al., 2009). These major fiber bundles could be tracked more reliably than other tracts with complex structures, such as brain stem and cerebellar tracts due to limitations of infant brain data acquisition. Diffusion indices of FA, radial and axial diffusivities were calculated and statistical analyses were performed along tracts (Corouge et al., 2006, Goodlett et al., 2009). Tract specific spatiotemporal white matter maturation patterns were assessed.
Materials and Methods
Subjects
This study was approved by the Institutional Review Board of the University of North Carolina (UNC) School of Medicine. Children analyzed in this work are controls in an ongoing longitudinal study of prenatal and neonatal brain development in children at high risk for neurodevelopmental disorders. Subjects were recruited during the second trimester of pregnancy from the outpatient obstetrics and gynecology clinics at UNC hospitals. Exclusion criteria were the presence of abnormalities on fetal ultrasound or major medical or psychotic illness in the mother. Children who had successful DTI scans were included in this study. Additional exclusion criteria for this analysis included spending > 24 h in the neonatal intensive care unit after birth, history of major medical illness, and major abnormality on MRI. After applying the above exclusion criteria, 295 high quality scans are available for 211 children including 163 neonates (2–4 weeks of age), 77 one year olds, and 55 two year olds. Demographic information and distribution of scan availability are found in Table 1 and 2.
Table 1.
Demographic characteristics for participants
| Gender | |
| Male Female |
98 113 |
| Ethnicity | |
| Caucasian African American Other (Hispanic, Asian) |
164 44 3 |
| Gestational age at birth (weeks) | 38.80±1.8 |
| Age at scan 1 (weeks) | 3.02±2.00 |
| Age at scan 2 (weeks) | 54.60±3.92 |
| Age at scan 3 (weeks) | 106.25±4.36 |
| Birth weight (g) | 3361.8±542.1 |
| APGAR score (5-minute) at scan 1 | 8.84±0.54 |
| Maternal education (total in years) | 14.8±3.5 |
Table 2.
Distributions of scan availability
| Available scans | N |
|---|---|
| Neonate scan only | 102 |
| 1 year scan only | 24 |
| 2 year scan only | 15 |
| Neonate + 1 year scan | 30 |
| Neonate + 2 year scan | 17 |
| 1 year + 2 year scan | 9 |
| Neonate + 1 year + 2 year scan | 14 |
Image Acquisition and DIT Preprocessing
All imaging was performed on a head-only 3T scanner (Allegra, Siemens Medical Solutions, Erlangen, Germany). All subjects were scanned without sedation. Before neonates were imaged, they were fed, swaddled and fitted with ear protection. Children at 1 and 2 years were mildly sleep deprived (i.e., parents were asked to wake the child 1 h early that day and to skip a nap) before the scan; once asleep they were fitted with earplugs or earphones and placed in the MRI scanner with head in a vacuum-fixation device. Neonatal scans were performed with a neonatal nurse present, and a pulse oximeter to monitor heart rate and oxygen saturation. For older children, a member of the research team remained in the scanner room to monitor the child throughout the scan.
A single shot echo-planar spin echo diffusion tensor imaging sequence was used with the following variables: TR=5,200 msec, TE=73 msec, slice thickness=2mm, in-plane resolution=2×2 mm2, and 45 slices. One image without diffusion gradients (b=0) and diffusion-weighted images (DWIs) along 6 gradient directions with a b value of 1,000 mm2/sec were acquired. The sequence was repeated 5 separate times to improve signal-to-noise ratio. The acquisition protocol was set from the beginning our longitudinal study and the parameters were kept the same throughout the study for all subjects with age range from neonate to 6 years old. Diffusion images were screened offline for motion artifacts, missing and corrupted sections by using an automatic DWI analysis quality control tool DTIPrep (http://www.nitrc.org/projects/dtiprep/). The five repeated sequences were combined into a single DWI volume after correction for motion and removal of outliers and FA and diffusivity maps were then estimated using standard weighted least square fitting (Liu et al., 2010).
DTI Atlas Mapping and Tractography
The fiber tract analyses were employed in a population specific DTI atlas space, which requires image registration and atlas construction. Unbiased atlas building (Joshi et al., 2004) with large deformation diffeomorphic metric mapping (LDDMM) registration (Miller et al., 2002) were used after a linear registration (Goodlett et al., 2009). In this longitudinal study, the high variability and large growth of the human brain in the first year makes it difficult to compute a joint atlas of neonates, 1 year and 2 year old subjects in one procedure, without over fitting and blurring at the non-linear registration stage. Consistent with previous findings, there was major brain volume growth and shape change in the first year and much less change in the second year (Knickmeyer et al., 2008, Datar et al., 2009). As a solution, we applied a two-step procedure for mapping all image data for all time points to a common coordinate space.
We first computed a neonate FA atlas Aneo along with the correspondence mappings (φk,neo) by applying the atlas building procedure to neonatal FA images (Joshi et al., 2004). Similarly, a combined FA atlas of one year and two year subjects, A12 was computed with invertible mappings φk,12. Subsequently, the neonate atlas Aneo was registered to the atlas A12 using an invertible transformation φAneo_to_A12. Every one year or two year subject k is linked to the common atlas space of A12 by applying its transformation φk,12. For a neonate subject, the final transformation is a cascaded combination of the transformation to the neonate atlas space φk,neo, followed by the transformation from the neonate to the 1year–2year atlas φAneo_to_A12, resulting in the respective individual diffeomorphic transformations to the original tensor maps. The composition of the two transforms (φk,neoO φAneo_to_A12) is such that it preserves diffeomorphism. The final tensor atlas is created by applying the respective individual diffeomorphic transformations to the original tensor maps, reorientation of tensors with preserve principal direction (PPD) approach (Sampaio and Truwit, 2001), and interpolation and group averaging using the Riemannian metric framework (Fletcher et al., 2004, Arsigny et al., 2006).
The fiber tractography is done on the DTI atlas. We applied the freely available ‘FiberTracking’ software (http://www.ia.unc.edu/dev), which relies on a deterministic tractography algorithm originally presented and refined by (Fillard et al., 2003). The tractography algorithm uses a streamline integration method based on fourth order Runge-Kutta integration of the principal Eigen-vector field to define streamline paths through the tensor volume. We start with defining volumetric Regions of Interests (ROIs) manually (see Appendix Table 1) in the atlas space to initialize the tractography algorithm using source to target definition strategies as presented in (Catani et al., 2002, Mori and van Zijl, 2002). The resulting sets of streamlines are stored as list of polylines, which carry the full tensor information at each location. Ten major white matter pathways were constructed and analyzed on the DTI atlas including 21 fiber tracts in total: commissural bundles of genu, body and splenium of corpus callosum (CC); projection fiber tracts of bilateral ALIC, PLIC, motor and sensory tracts; association tracts of bilateral uncinate fasciculus tracts, inferior longitudinal fasciculus (ILF), and arcuate fasciculus tracts with three sub-tracts in each hemisphere: arcuate-superior, arcuate-inferior-temporal, and arcuate-superior-temporal tracts. Similar to the work in (Dubois et al., 2009), we did not get continuous arcuate tracts between frontal and temporal lobes, mainly due to the particularly low maturation, insufficient diffusion anisotropy and limitations of the infant DTI acquisition. Comparisons between atlas-based tracts and tracts computed from individual subjects have been done in a recent work of our coauthors (Gouttard et al., 2012). 90% fiber points of five examined atlas-based tracts have average distances around 2mm to fibers tracked in individual spaces.
Assembling Tract-based Diffusion Properties
For each tract defined in atlas space, the tract geometry is transformed back to individual subjects using the inverse of the diffeomorphic transformations, (φk,12)−1 and (φk,neoO φAneo_to_A12)−1 respectively. Each point as part of a fiber tract bundle in atlas space gets therefore mapped to corresponding locations in images of individual subjects. The diffusion information from each subject is collected at each sample point along tracks via trilinear interpolation. In other words, we obtain a back-mapped fiber tract for each subject, thereby keeping a consistent atlas tract geometry across subjects while replacing the diffusion information with values mapped from each subject (Goodlett et al., 2009). We therefore avoid any resampling or nonlinear alignment of tract geometries, which would be necessary when comparing individual tractography results. By collecting diffusion measures for each subject in the parameterized space of the atlas tract for each subject, we obtain a congregation of functions of diffusion along tracts (see Figure 1), which represent the statistical variability of the population (Corouge et al., 2006). This representation is input to subsequent tract-based statistical analysis using methodologies described in the following.
Fig.1.

Flow chart of the DTI tract-based analysis. The first part is DTI preprocessing including the computation of DTI indices of FA, RD and AD. The second part is atlas construction 1) construction of neonate atlas, 2) construction of 1&2 year atlas, and 3) transforming the neonate atlas to 1&2 year atlas for a final atlas. The third part maps all individuals to the final atlas. The fourth part shows procedures of the tract profile calculation. The last part includes procedures of tract-based analysis.
Figure 2 shows the sagittal and coronal views of the 21 fiber bundles. The genu CC is the anterior part CC with tracts ending in prefrontal cortex. The body CC is defined in the central body CC with bundles connecting bilateral motor/sensory cortices. The splenium CC is the posterior CC with tracts ending in occipital cortex. The PLIC tracts start from cerebral peduncle, passing through posterior internal capsule (IC), centrum semiovale, and ends in motor sensory cortex. The ALIC tracts start from cerebral peduncle, passing through anterior IC, and ends in prefrontal cortex. The motor and sensory tracts are part of PLIC including tracts connecting cerebral peduncle and motor and sensory cortex respectively. The arcuate tract includes three sub-tracts: arcuate-superior tract connecting from the rostral inferior parietal lobe to the lateral ventral part of the frontal cortex, comparable with the superior longitudinal fasciculus subcomponent III in (Schmahmann and Pandya, 2007), and also comparable with the anterior indirect segment of the arcuate fasciculus in (Catani et al., 2005); arcuate-inferior-temporal tract linking the middle and inferior temporal lobe and rising up towards the temporo-parietal junction and then towards the frontal region; arcuate-superior-temporal tract running from the superior temporal lobe rises upwards to turn towards the frontal lobe. The uncinate fasciculus links the frontal and temporal lobes. The ILF tract runs along the boundary of inferior and posterior cornua of the lateral ventricles.
Fig.2.

3D visualization of 10 fiber pathways (including 21 tracts bilaterally) in sagittal (left and right) and coronal views. C1, genu corpus callosum (CC); C2, body CC; C3, splenium CC. A1a, arcuate-inferior-temporal tract; A1b, arcuate-superior-temporal tract; A1c, arcuate-superior tract; A2, uncinate fasciculus; A3, inferior longitudinal fasciculus (ILF); P1, posterior limb internal capsule (PLIC); P2, anterior limb internal capsule (ALIC); P3, motor tract; P4 sensory tract.
Statistical Analysis
Tract-based analyses were performed using the functional regression model to analyze developmental patterns(Green and Silverman, 1994, Ramsay and Silverman, 2002). Diffusion properties along a fiber tract were smoothed using polynomial splines with roughness penalty. A functional mixed-model regression was used to fit the diffusion property with age and gender (Guo, 2002). The covariate effects and the covariance are functions of location of the specific tract. We used L2-norm-based global test statistic to test for the significance of the age and gender effects on DTI functions and derived its asymptotic p-values (Zhang and Chen, 2007). The test was done repeatedly for each fiber tract and each diffusion property (FA, RD and AD). Major age and gender effects in the first two years, age effect in the first year, age effect in the second year, and the difference between first year change and second year change were tested based on the model.
Results
Summary Statistics of the Diffusion Indices along Fiber Tracts
Figure 3 shows the scatter plots of average FA, RD and AD of each fiber tract vs. the postnatal age in weeks, and the overall mean diffusion indices within each age group of seven representative tracts. It is clear that FA increases with age and RD and AD decrease with age and that the changes in the first year are larger than the second year. Table 3 shows the average and standard deviation of FA, RD and AD over each fiber tract of each age group, and the average percentage changes of diffusion indices in the first year vs. neonate and the changes in the second year vs. the first. Among all fiber tracts, FA increases 9% to 44% in the first year of life and more than half of the tracts show an increase larger than 25%. FA increases 5–9% in the second year. In the first year RD decreases 14% to 40%, and about two thirds of the tracts show changes more than 25%. RD decreases 4–12% in the second year. AD decreases 7% to 24% in the first year and 0–6% in the second year. These results indicate that RD and FA have more prominent changes in the first two years compared to AD.
Fig. 3.

Scatter plots of average FA, RD and AD along seven representative tracts vs. postnatal age. Horizontal lines represent the over all mean of the average values in one age group.
Table 3.
Summary statistics of FA, RD and AD over each fibe tract.
| FA | Neo vs. 1-year | 1-year vs. 2-year | Neo vs. 2-year | |||
|---|---|---|---|---|---|---|
| Neo (avg/sthev) |
avg change% |
1-year (avg/sthev) |
avg change% |
2-year (avg/sthev) |
Avg change% |
|
| Genu | .280/.0239 | 44.3 | .405/.0228 | 7.41 | .435/.0221 | 55.0 |
| body CC | .243/.0198 | 38.4 | .336/.0200 | 9.04 | .367/.0175 | 50.9 |
| splenium | .359/.026 | 37.0 | .492/.0289 | 7.37 | .528/.0240 | 47.1 |
| Arc L InfTemp | .195/.0213 | 37.5 | .269/.0195 | 9.12 | .293/.0197 | 50.1 |
| Arc R InfTemp | .256/.0237 | 9.75 | .280/.0190 | 9.14 | .306/.0186 | 19.8 |
| Arc L SupTemp | .161/.0203 | 29.6 | .209/.0190 | 8.95 | .227/.0234 | 41.2 |
| Arc R SupTemp | .181/.0168 | 24.8 | .226/.0183 | 8.74 | .246/.0177 | 35.7 |
| Arc L SupArc | .216/.0236 | 31.4 | .284/.0244 | 7.88 | .306/.0260 | 41.7 |
| Arc R SupArc | .191/.0211 | 22.7 | .235/.0259 | 6.84 | .251/.0272 | 31.1 |
| uncinate L | .209/.0163 | 40.9 | .295/.0255 | 6.89 | .315/.0234 | 50.6 |
| uncinate R | .193/.0176 | 36.4 | .263/.021 | 7.59 | .283/.0175 | 46.8 |
| ILF L | .219/.0220 | 40.6 | .308/.0164 | 7.71 | .331/.0170 | 51.4 |
| ILF R | .200/.0215 | 40.7 | .282/.0165 | 7.16 | .302/.0192 | 50.8 |
| PLIC L | .297/.0217 | 23.7 | .367/.0195 | 6.57 | .391/.0172 | 31.8 |
| PLIC R | .232/.0212 | 42.8 | .331/.0173 | 7.38 | .356/.0162 | 53.3 |
| ALIC L | .229/.0210 | 31.8 | .301/.0175 | 9.37 | .329/.0165 | 44.2 |
| ALIC R | .277/.0226 | 23.3 | .341/.0174 | 9.20 | .373/.0174 | 35.7 |
| motor L | .288/.0270 | 14.4 | .329/.0265 | 7.19 | .353/.0244 | 22.6 |
| motor R | .263/.0237 | 37.6 | .362/.0206 | 5.60 | .382/.0179 | 45.3 |
| sensory L | .279/.0248 | 8.21 | .302/.0260 | 7.29 | .324/.0204 | 16.1 |
| sensory R | .313/.0253 | 13.1 | .352/.0241 | 7.06 | .379/.0233 | 21.0 |
| RD | Neo vs. 1-year | 1-year vs. 2-year | Neo vs. 2-year | |||
|---|---|---|---|---|---|---|
| Neo E-3 (avg/sthev) |
avg change% |
1-year E-3 (avg/sthev) |
avg change% |
2-year E-3 (avg/sthev) |
Avg change% |
|
| genu | 1.28/.100 | −39.4 | .774/.0393 | −11.5 | .685/.0377 | −46.4 |
| body CC | 1.18/.0854 | −31.3 | .812/.0498 | −8.28 | .745/.0356 | −37.0 |
| splenium | 1.16/.0872 | −39.8 | .699/.0464 | −9.38 | .633/.0371 | −45.5 |
| Arc L InfTemp | 1.17/.0722 | −30.7 | .813/.0268 | 7.44 | .752/.0232 | −35.8 |
| Arc R InfTemp | 1.11/.0723 | −24.7 | .832/.0322 | −7.58 | .769/.0293 | −30.4 |
| Arc L SupTemp | 1.13/.0587 | −26.8 | .824/.0237 | −5.13 | .781/.0266 | −30.5 |
| Arc R SupTemp | 1.12/.0621 | −25.5 | .833/.0297 | −5.74 | .785/.0260 | −29.8 |
| Arc L SupArc | 1.13/.0672 | −28.7 | .809/.0318 | −6.97 | .752/.0314 | −33.6 |
| Arc R SupArc | 1.16/.0759 | −27.8 | .838/.0296 | −5.69 | .791/.0311 | −32.0 |
| uncinate L | 1.10/.0532 | −27.6 | .794/.0253 | −6.50 | .743/.0226 | −32.3 |
| uncinate R | 1.10/.0531 | −24.1 | .837/.0316 | −5.88 | .788/.0246 | −28.5 |
| ILF L | 1.23/.0871 | −33.8 | .815/.0298 | −7.03 | .757/.0930 | −38.4 |
| ILF R | 1.24/.0938 | −33.5 | .829/.0368 | −6.93 | .771/.0337 | −38.1 |
| PLIC L | .961/.0602 | −23.8 | .733/.0512 | −7.49 | .678/.0371 | −29.5 |
| PLIC R | .997/.0597 | −24.9 | .748/.0399 | −6.56 | .699/.0258 | −29.9 |
| ALIC L | 1.07/.0623 | −29.7 | .753/.0209 | −6.66 | .703/.0216 | −34.4 |
| ALIC R | .100/.0575 | −26.1 | .742/.0241 | −8.64 | .678/.0216 | −32.5 |
| motor L | .981/.0614 | −23.6 | .749/.0422 | −6.38 | .701/.0359 | −28.5 |
| motor R | .951/.0589 | −26.8 | .696/.0322 | −5.93 | .655/.0270 | −31.1 |
| sensory L | .982/.0599 | −19.5 | .790/.0486 | −6.06 | .742/.0417 | −24.4 |
| sensory R | .914/.0603 | −18.8 | .743/.0660 | −7.87 | .684/.0432 | −25.2 |
| AD | Neo vs. 1-year | 1-year vs. 2-year | Neo vs. 2-year | |||
|---|---|---|---|---|---|---|
| Neo E-3 (avg/sthev) |
avg change% |
1-year E-3 (avg/sthev) |
avg change% |
2-year E-3 (avg/sthev) |
Avg change% |
|
| genu | 2.02/.105 | −23.6 | 1.54/.0511 | −6.02 | 1.45/.0607 | −28.2 |
| body CC | 1.71/.0913 | −18.9 | 1.38/.0619 | −2.83 | 1.35/.0470 | −21.2 |
| splenium | 2.06/.0918 | −20.9 | 1.63/.0433 | −1.75 | 1.60/.0429 | −22.3 |
| Arc L InfTemp | 1.58/.0748 | −22.8 | 1.22/.0388 | −3.55 | 1.18/.0356 | −25.6 |
| Arc R InfTemp | 1.63/.0671 | −22.6 | 1.26/.0482 | −3.68 | 1.22/.0457 | −25.5 |
| Arc L SupTemp | 1.43/.0757 | −22.4 | 1.11/.0312 | −2.44 | 1.09/.0325 | −24.3 |
| Arc R SupTemp | 1.46/.0596 | −20.8 | 1.16/.0432 | −2.85 | 1.13/.0317 | −23.0 |
| Arc L SupArc | 1.54/.0634 | −19.6 | 1.23/.0512 | −3.71 | 1.19/.0451 | −226 |
| Arc R SupArc | 1.53/.0724 | −22.3 | 1.19/.0444 | −3.42 | 1.15/.0414 | −24.9 |
| uncinate L | 1.51/.0562 | −16.2 | 1.27/.0398 | −3.14 | 1.23/.0379 | −18.9 |
| uncinate R | 1.48/.0437 | −14.6 | 1.27/.0479 | −2.8 | 1.23/.0355 | −17.1 |
| ILF L | 1.72/.0865 | −24.2 | 1.29/.0488 | −3.56 | 1.24/.0473 | −26.9 |
| ILF R | 1.69/.0943 | −17.9 | 1.36/.0430 | −4.51 | 1.30/.0431 | −21.7 |
| PLIC L | 1.53/.0551 | −13.7 | 1.32/.0637 | −3.10 | 1.28/.0482 | −16.3 |
| PLIC R | 1.42/.0573 | −11.0 | 1.26/.0475 | −2.53 | 1.23/.0329 | −13.3 |
| ALIC L | 1.53/.0716 | −20.1 | 1.22/.0347 | −2.21 (p=.022) | 1.20/.0347 | −21.8 |
| ALIC R | 1.56/.0606 | −18.5 | 1.27/.0377 | −3.12 | 1.23/.0353 | −21.0 |
| motor L | 1.54/.0636 | 18.3 | 1.25/.0558 | −2.58 | 1.22/.0433 | −20.4 |
| motor R | 1.43/.0531 | −12.6 | 1.25/.0441 | −2.53 | 1.22/.0336 | −14.8 |
| sensory L | 1.54/.0600 | −17.5 | 1.27/.0640 | −2.53 (p=.003) | 1.24/.0566 | −19.6 |
| sensory R | 1.51/.0584 | −13.4 | 1.30/.0790 | −3.27 | 1.26/.0570 | −16.2 |
Paired t-tests of average diffusion parameters over each tract were exhaustively performed between every pair of two tracts in each age group to evaluate diffusion properties between tracts and tract asymmetries. In total, the test was repeated 3 (parameters) × 21 × 20 (tract pairs) × 3 (age groups) = 3780 times. Results of paired t-test of the average diffusion parameters show that most of pairs, especially pairs from different types of tracts (e.g., an association tract and a projection tract) show significant different FA, RD and AD values with p<0.00013 (corrected for multiple comparisons). The relative relations of diffusion properties between tracts concluded from the statistical analysis and Table 3 are described in the following paragraphs.
In the neonate, the splenium of the CC has the highest FA, the genu of the CC has the highest RD, and the genu and splenium have the highest AD; projection tracts show smaller RD than all other tracts. Among the callosal tracts, splenium has larger FA followed by genu and then by the body of the CC; the body of the CC has smaller AD than genu and splenium; and genu has larger RD than body and splenium. Results indicate that callosal tracts have more organized axonal structures or lower myelination degree in neonates, with the splenium and genu more organized than body CC, and the genu less matured compared to body and splenium. In association tracts, ILF shows larger AD values but smaller RD values suggesting that ILF might have more organized white matter structure compared to other association tracts.
In the one-year-old, the genu and splenium of the CC have the largest FA and AD; association tracts show larger RD than CC (except body CC) and projection tracts, and they (except ILF) have smaller FA than all other tracts; projection tracts continuously have smaller RD than all other tracts except the splenium CC. Among callosal tracts, the body of the CC shows smaller FA and AD and larger RD compared to the genu and splenium. Among association tracts, IFL shows higher AD values than others.
In year two, CC bundles continue to exhibit higher FA and AD than other tracts and reach similar RD values as projection tracts; association tracts show similar patterns as in the first year with larger RD and smaller FA than other tracts. Overall results indicate that association fibers are less mature than others at age two, suggesting that maturation is a prolonged process.
It is interesting to note that the relative relationship of a tract’s FA and AD values are consistent at each age, for example the genu has the highest FA values at each age, while the left arcuate-inferior-temporal tract has the lowest. Similarly, the splenium has the highest AD value at each age, while the left arcuate-inferior-temporal tract is among the lowest at each age. This is not the case for RD, for which the tracts have a much more varied relationship at each age. These observations indicate that the organization of fiber tracts keep similar patterns in the first two years of life whereas the relative axonal myelination degrees of fiber bundles vary with age. For example, the callosal bundles have the least degree of myelination in terms of the largest RD at neonate, but develop in the first year and show similar RD values as projection tracts in the first and second year.
In the first year, the genu of the CC has the largest FA change, sensory and the right arcuate-inferior-temporal tracts have the smallest FA changes; callosal bundles show the largest RD changes and sensory tracts show the smallest RD changes among all tracts. In the second year, callosal FA changes are similar to other tracts and genu CC has the largest RD change (11.5%) among all tracts but the change is much less as compared to the first year (39.4%). These observations suggest that callosal fibers experience faster maturation rates than other fibers in the first year, and the genu CC continues to have faster maturation rate than others in the second year even it is dramatically reduced as compared to the first year.
Significant level was set by p<0.006 to determine the asymmetry of bilateral tracts for the correction of multiple comparisons (three age groups, three parameters and nine pairs of bilateral tracts). All tracts show significant FA asymmetry in neonates, 1 year and 2 years old. Most tracts show significant RD asymmetry in three age groups, except for the arcuate superior-temporal tract in neonates and age two and for the uncinate fasciculus in neonates. Most tracts show significant AD asymmetry in three age groups, except for the arcuate superior-temporal tract in neonates, motor and uncinate fasciculus in age one and two. Though the initial FA values at neonates of left arcuate subcomponent tracts show either lower or higher values than the right, the FA changes of left arcuate tracts in the first year are consistently higher than the right. Left arcuate-inferior-temporal tract has larger RD change than right even the left one shows higher neonatal RD values than the right.
Qualitative Topography of Diffusion Parameters
Figure 4 plots diffusion profiles along 12 representative fiber tracts (three callosal tracts and all other tracts on the left hemisphere) at each age group. Qualitative inspection of FA, RD and AD along fiber tracts reveals developmental patterns that are consistent with general topographical rules of white matter maturation (Yakovlev and Lecours, 1967, Kinney et al., 1988). For example, callosal tracts show higher FA and AD values in central regions compared to peripheral regions (see the plots of the genu, body and splenium CC in Figure 4(a) and (c)). Genu and splenium of CC tracts have slightly lower RD close to mid-sagittal brain (see the plots of the genu and splenium CC in Figure 4(b)), indicating that variations of FA and AD along the tract might be mainly caused by different organization, i.e., axons in the mid-sagittal region are more organized than in cortical regions. For all three time points, PLIC tracts have larger FA values and smaller RD values (see the plots of PLIC in Figure 4(a) and (b)) in posterior IC, corresponding to locations closer to the max x-axis in the profile, than cortex, locations closer to the origin of the x-axis. Similar pattern exists for ALIC tracts. Motor and sensory tracts show larger FA and smaller RD values in the regions close to cerebral peduncle, corresponding to locations closer to the max x-axis, than in distal cortical regions, closer to the origin of the x-axis. The temporal portion of uncinate fasciculus, closer to the max x-axis, has larger FA values compared to the frontal portion, closer to the origin of the x-axis. The occipital portion of the IFL, closer to the max x-axis, shows larger FA values and slightly lower RD values as compared to the temporal portion, closer to the origin of the x-axis.
Fig. 4.


Tract-based FA, RD and AD profiles of 12 representative tracts and age and gender effects on the diffusion measures. Solid lines are predicted values of the observed data. Note: in each plot, p1 is the p value of age effect in the first year, p2 is the p vale of age effect in the second year, p12 is the p value of the difference between the first year change and second year change, and pG is the p value of gender effect. The p values of main age effect in the first two years are 0s for all tracts.
We also observed that RD and AD followed more uniform distributions along all tract profiles at each age group compared to the anisotropy index FA, indicating that directional diffusivity measures are less sensitive to tract location or organization compared to the anisotropy measure. Directional diffusivities along association tracts (including bilateral arcuate fasciculus, uncinate fasciculus, inferior longitudinal fasciculus) have almost uniform distributions.
Age Related Effects
Tract-based mixed model functional analysis indicates that there are major age effects of all three diffusion indices for all fiber tracts in the first and second year. FA increases whereas both RD and AD decrease with age in the first two years. For each tract, the diffusion changes, including FA increases and RD and AD decreases, in the first year are significantly larger than in the second year. After correcting for multiple comparisons (21 tracts in total, and three measures for each tract), there are significant age effects of all diffusion indices for all fiber tracts in the first year. All tracts have major age effects of FA in the second year as well. Most tracts show significant RD changes in the second year except for left PLIC and left sensory tracts. There are fewer observations in AD. Most callosum and association tracts have significant AD changes in the second year except bilateral arcuate-superior-temporal tracts and body CC. Among projection tracts, only right ALIC and right motor tracts show significant AD changes in the second year. Above results indicate that the PLIC and sensory tracts have shorter maturation intervals than other tracts, whereas the right ALIC tract (especially regions in prefrontal cortex) tends to continue developing in the second year. Together with results on whole tract averages (see Table 3), which show that motor tracts have larger RD changing rate compared to sensory tracts in the first year (23.6%/26.8 % vs 19.5%/18.8%), evidence indicates that motor tracts may have delayed maturation compared to sensory tracts.
There are regional differences in both maturation degree and speed along a fiber bundle. Most regions on a tract have significant diffusion changes with the amount varying along the tract in the first year. Several local regions do not show significant changes in the second year. For callosal bundles, the first year FA change is larger in the central regions compared to the peripheral portions. The tract edges, regions close to the cortex, of most association tracts do not have increased FA, or the increased values are less compared to the middle parts of the tracts. These patterns are consistent with the general rule that central brain regions tend to mature faster than peripheral regions. For all projection tracts, portions close to the cerebral peduncle show smaller (compared to central regions, i.e., posterior IC region) or do not show significant RD and AD changes, indicating a higher maturation degree at birth in regions near brain stem compared to distal regions.
Gender Effects
We found that gender effect only exists on several right fiber tracts, and none of the left tracts show gender effect during the first two years. The right sensory tract shows a gender effect (p=0.0425) on FA (male<female). The right arcuate-superior (male>female), right motor tracts (male>female) and right uncinate fasciculus (male<female) have gender effects on AD with p values of 0.028, 0.0114 and 0.0231 respectively.
Discussion
We have conducted the largest study of early white matter development to date in 211 healthy young children from birth to age two. Ten fiber pathways including commissure, association and projection tracts (21 tracts in total) were examined with tract-based analysis, which provided more detailed and continuous spatial developmental patterns compared to conventional ROI based methods. All fiber tracts show increasing FA (16.1–55.0%) and decreasing RD (24.4–46.4%) and AD (13.3–28.2%) in the first two years of life, and FA and RD have larger changes than AD. The changing rates of the diffusion indices are faster in the first year than the second year for all tracts. Callosal tracts have lower myelination degree and more organized axonal structures than other tracts in neonates, and exhibit larger RD changes in the first year. Projection tracts including motor and sensory tracts achieve higher maturation degree at birth and develop more slowly than other tracts. Association tracts continuously have lower maturation degree in the first two years. Tract-based analysis revealed different local developmental patterns of each fiber bundle. For example, callosal bundles show larger FA changing rates in central regions than peripheral regions. Motor and sensory tracts show larger FA and RD changing rates in sites close to cortical regions compared to sites close to cerebral peduncle. The gender effects on the diffusion measures are small.
In general CC tracts show lower myelination degree at birth and develop more rapidly than other tracts in the first year. The splenium of the CC is one of the tracts that have the largest FA and smallest RD in the first year, and maintains this high level of maturation degree in the second year. This pattern continues at least until late adolescence (Lobel et al., 2009). The genu of the CC has relative small RD until the second years of life. The rapid maturation of splenium CC compared to the genu CC is consistent with the functional developmental order: the presence of visual function requiring inter-hemispheric communication in occipital/visual cortex is prior to higher order functions in prefrontal regions. Motor and sensory tracts have maturational trajectories different from CC and association tracts involved with higher-order functions. PLIC, sensory and motor tracts achieve higher maturation degree at birth and follow a slower growing rate compared to all others. Association bundles including arcuate, uncinate fasciculus and ILF tracts show lower maturation degree at birth, but relatively faster maturation rates (larger RD changes) in the first year compared to motor and sensory tracts. Arcuate tracts are related with language function (Duffau et al., 2002, Rilling et al., 2008). ILF tracts connect occipital and temporal lobes and have been considered to be involved with language semantics (Duffau et al., 2005, Mandonnet et al., 2007, Agosta et al., 2010) and verbal memory (Shinoura et al., 2011). Uncinate fasciculus tracts connect temporal and frontal lobes, which are considered to be commonly implicated in emotional and behavioral regulation (Nakamura et al., 2005, Johnson et al., 2011).”
Above evidences confirm that white matter myelination is associated with the development of cognitive functions during the human life span (Yakovlev and Lecours, 1967). It has been proposed that a tract is not completely functional until it is myelinated, and that myelination represents the anatomic correlate of neurophysiological maturation (Richardson, 1982). Our results show that motor tracts have larger rate of RD change compared to sensory tracts in the first year, suggesting that motor tracts develop later than sensory, which is consistent with the functional maturation order. Along ALIC tracts, the frontal portions have smaller FA and larger RD values, indicating a lower maturation degree than mid-brain and occipital regions in the first two years. A recent functional connectivity study (Gao et al., 2009b) revealed that the frontal components in the “default mode network” show similar distribution to adults until age two whereas the posterior components are close to adult pattern at neonate. Both structural connectivity and resting-state functional connectivity indicate a prolonged maturation of the frontal regions compared to other brain regions.
Our results of age dependent increasing FA and decreasing diffusivities in the first two years of life are consistent with previous literature (Neil et al., 1998, Gao et al., 2009a, Lobel et al., 2009). Our study provides more detailed anatomical localization with tract-based analysis compared to existing studies whose results were obtained from selected local sites in white matter. Although all 21 major fiber bundles studied in this work show significant age effect of the three diffusion indices, the maturation degree reflected by diffusion indices varies along the same tract. Most regions on a tract have significant diffusion property changes with the amount varying along the tract (in general larger in the central regions) in the first year. Many local regions along tracts do not show changes in the second year.
The diffusion property changes are significantly greater in the first year compared to the second. Although FA of projection tracts show significant increases in the second year, only right ALIC and right motor tracts show significant changes in AD in the second year after correction for multiple comparisons. These results suggest that either the fiber organization is becoming relatively more prominent and the AD decrease caused by myelination is being cancelled out by the AD increase due to fiber organization, or that myelination in the left projection fibers slows down – probably does not stop in the second year. While sensory tracts do not have significant RD and AD changes (after multiple comparison correction) in the second year, but motor tracts do, indicating that sensory tracts have shorter maturation interval than motor tracts.
Additionally, we found that maturation related changes of FA and RD are greater than AD. RD has been considered to be more representative with histologic changes in demyelination (Song et al., 2003, Harsan et al., 2006, Budde et al., 2007). For myelination, one of the overlapped processes membrane proliferation may cause decreased RD and AD, but relatively unchanged FA, and myelination synthesis may induce decreased RD and unchanged AD and increased FA. Therefore myelination combining the two processes may lead to greater RD decreases compared to AD, and greater RD changes than FA changes. However we found similar percentage changes of FA and RD in the first two years. We thus speculate that organization in fascicles contributes to the observed development of diffusion properties, which may cause decreased RD, increased AD and greater increased FA. The AD increase was not revealed suggesting that axonal myelination is a dominant process in white matter maturation in the examined age group. Biological basis of diffusion measures and their changes is not quite clear. Maturational decrease of brain water content also parallels with the decay of radial and axial diffusivities. However the amount of water loss is less than the drop of diffusivity measures (Mukherjee et al., 2002). Therefore the large observed decrease of RD and AD reflects more than just tissue water loss.
We found small gender effects in several right fiber tracts: males show smaller FA in the right sensory tract, larger AD in right arcuate-superior and motor tracts, and smaller AD in right uncinate fasciculus. This is the first report of gender effect on white matter at early age of life. Gender differences in white matter may be modulated by myelination in early life. Non-myelination related development, such as neurochemical maturation, hormone changes and synapse formation during childhood and adolescence might be another potential contribution of gender effects in white matter, which cannot be detected in early childhood.
Tracts show asymmetric diffusion properties at each age group and the developmental pattern is also asymmetric. Arcuate fasciculus tracts show asymmetric growth patterns, where left tracts show larger FA changes compared to right, and left arcuate-superior tract has >20% larger FA values than right in the first year. Studies in infant brain reported higher FA in the left parietal segment of the arcuate fasciculus (Dubois et al., 2009), while other studies have demonstrated a rightward asymmetry of cortical and subcortical structures in utero brain development (Sun et al., 2005, Kasprian et al., 2008). Studies in adults have shown leftward volume, fiber density and FA asymmetry of the arcuate fasciculus (Nucifora et al., 2005, Vernooij et al., 2007, Takao et al., 2010). Our findings of leftward development of arcuate fasciculus suggest that the lateralized brain function, language processing (Dirks, 1964), might appear in the first two years of life. FA of left PLIC is 10–28% larger than right in the first two years though left PLIC shows less FA change in the right. The localized asymmetry in PLIC favoring left over right has been reported by a study with 42 normal subjects aged 0 to 18 (Verhoeven et al., 2010).
We have observed locally reduced FA values surrounding the central body CC, which may be explained by the limitation of tensor models. The body CC includes crossing fiber tracts extending to both medial motor/sensory and lateral cortical regions. FA extracted from single tensor models in fiber crossing regions may under-estimate the diffusion anisotropy. The higher average RD in body CC compared to genu CC may also be explained by the limitation of tensor models in crossing fiber regions. Multi-tensor models and high angular diffusion imaging techniques would overcome this limitation. Some limitations of DTI acquisition, such as low number of diffusion gradient directions, relatively high b-value for infants, motion artifacts by non-sedated infants, may hinder the discover of more subtle white matter developmental changes. The diffusion parameters may not be completely independent to each other. For example, FA is dependent on tensor eigenvalues, therefore RD and AD. Multivariate statistical model is a direction to go in the future studies.
Data investigated in this study are not purely longitudinal. Inter-subject variation may not be completely taken care of even after image registration, and therefore might affect the detected developmental patterns. A methodological limitation in this study is the construction of longitudinal DTI atlas. The two-step building of a DTI atlas covering the age range from neonates to two years into one common coordinate system might yield some limitations on the precision of fiber tract localizations. Active new methodology developments in atlas mapping will demonstrate how to overcome the large geometric variability across subjects and over time in large-scale studies given limited image quality as available.
Our analysis depends on diffusion profiles extracted from atlas-based tracts, providing more spatial specific information of fiber bundles compared to other approaches such as TBSS (Smith et al., 2006). Our functional statistical analysis requires the sample points along the diffusion profiles to represent consistent spatial locations across individuals. Therefore the sample points warped back to individual space would not be evenly distributed any more, which may produce different performance compared to other approaches that evenly sample the profiles in individual spaces.
In summary, we detected rapid maturation of ten major white matter pathways in the first two years of life with a novel tract-based functional analysis of DTI data. This work shows a promising framework to study and analyze white matter maturation in a tract-based fashion. Overall developmental patterns revealed in our study are consistent with general rules of temporospatial white matter maturation. All tracts show significant increasing FA and decreasing RD and AD in the first two years of life, and the changing rates of the diffusion indices are significantly faster in the first year than the second year. The first two years of life show a rapid white matter development that are very likely related to rapid gray matter growth and functional maturation, indicating a critical neuronal developmental period of life.
Acknowledgements
This work was supported by the National Institutes of Health (P50 MH064065, MH070890, NA-MIC U54 EB005149, and BRP R01 NS5055754, NIH P30 HD03110, MH091645).
Appendix
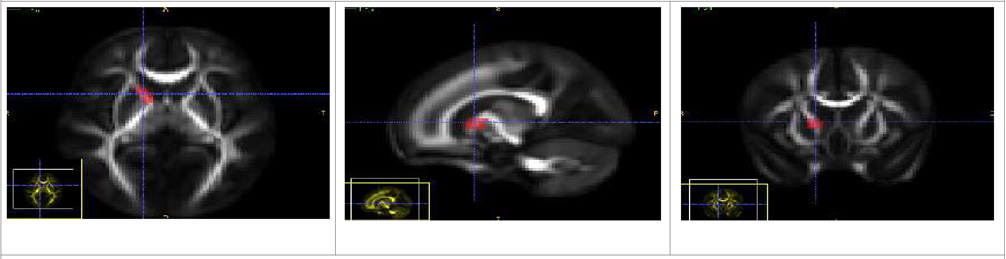
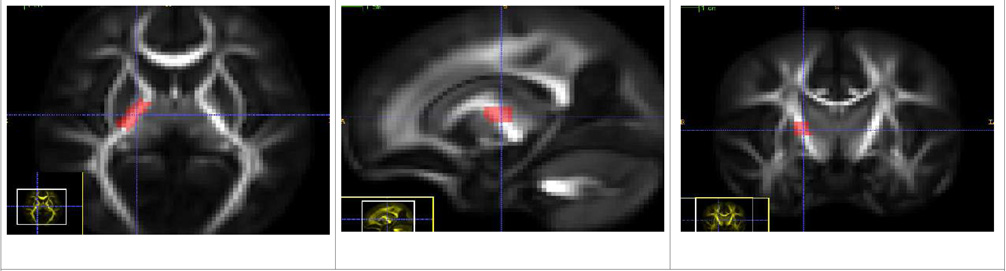
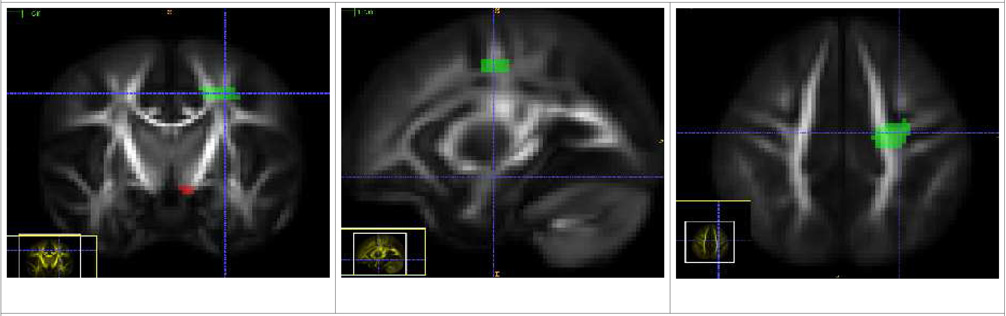
Definition of Fiber Tracts
Ten major white matter pathways, including commissure, projection and association 21 fiber tracts in total, were constructed and analyzed on the DTI atlas. Table 3 illustrates the definition and region selection for the ten pathways and 21 fiber bundles: body, genu and splenium of corpus callosum (CC), bilateral ALIC and PLIC tracts, bilateral motor and sensory tracts, bilateral uncinate fasciculus tracts, bilateral inferior longitudinal fasciculus (ILF) tracts, bilateral arcuate fasciculus tracts with three sub-tracts in each hemisphere: arcuate-superior, arcuate-inferior-temporal, and arcute-superior-temporal.
Table A1.
Descriptions of manually defined Regions of Interest along with snapshots
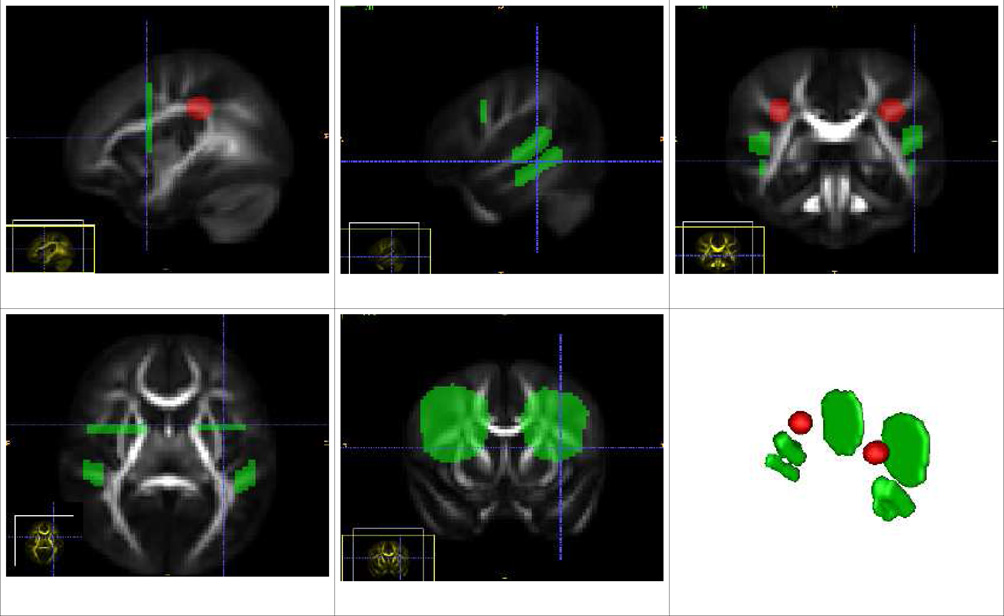
| Body of Corpus Callosum (CC), Genu of CC, Splenium of CC |
| CC: The source ROI is defined in the central body of the corpus callosum as seen in the first coronal slice below. The target ROI is defined to restrict the bundle at the motor cortex. |
| Genu: The source ROI is in the anterior part of the Corpus Callosum (second axial slice below) and the target is to mark the ends of genu at the prefrontal cortex. |
| Splenium: The source ROI marks the posterior part of Corpus Callosum and the target marks the ends in the somatosensory cortical region (third axial slice). |
| The fourth sagittal slice shows all the three source ROIs together. |
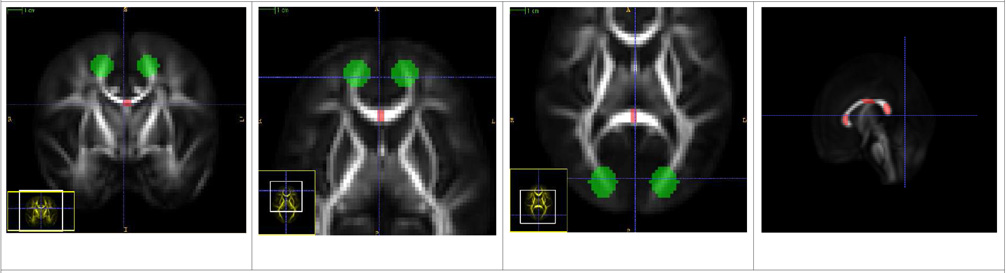 |
| Anterior Limb of Internal Capsule Tract (Left and Right) - ALIC |
| There is a single source ROI which is placed in the anterior limb of the Internal Capsule bundle. The tracts mostly seem to go towards the frontal lobe. |
 |
| Posterior Limb of Internal Capsule Tract (Left and Right) - PLIC |
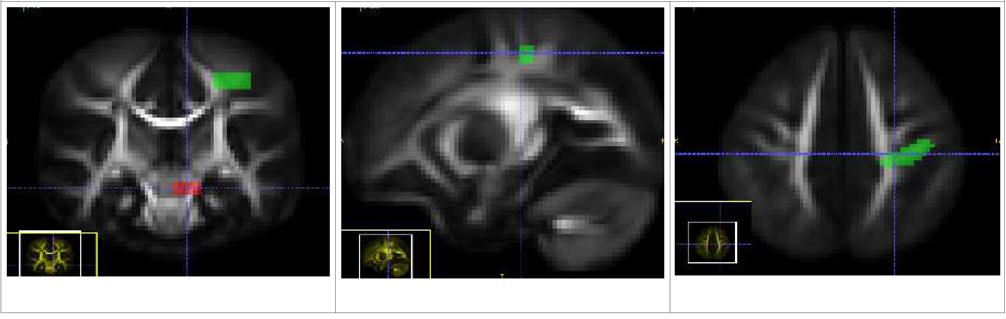
| There is a single source ROI which is placed in the posterior limb of the Internal Capsule bundle. The tracts mostly seem to go towards the parietal lobe. |
 |
| Motor Tract (Left and Right) |
| The source ROI is placed below the thalamus, at the base of the larger Internal Capsule bundle. The target ROI limits it to fiber tracts also passing through the motor cortex and mostly following the superior-inferior pathway. |
 |
| Sensory Tract (Left and Right) |
| Like the Motor tract, the source ROI is placed below the thalamus, at the base of the larger Internal Capsule bundle. The target ROI limits it to tracts passing through the somatosensory cortical region and also mostly following the superior-inferior pathway. The sensory tract displays a compound of thalamocortical tract and corticopontine tract from the postcentral gyrus. |
 |
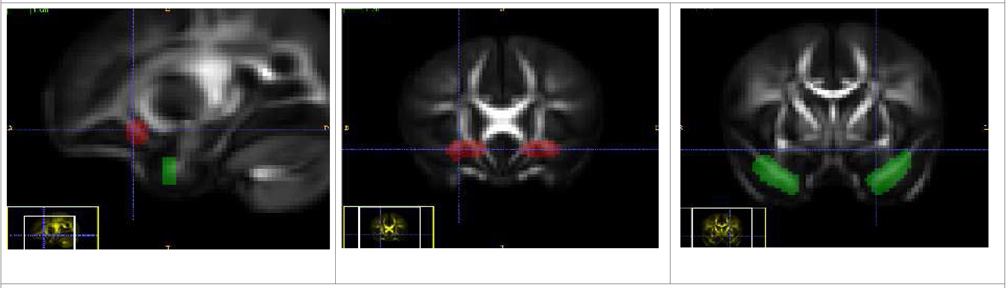
| Uncinate Fasciculus Tract (Left and Right) |
| The source ROI is placed in the prefrontal cortical region of the frontal lobe and the target ROI in the temporal lobe, close to the hippocampus and amygdala. This makes the uncinate connect regions in the frontal and temporal lobes. |
 |
| Inferior Longitudinal Fasciculus Tract (Left and Right) - ILF |
| The source ROI is placed in the temporal lobe and the target ROI is in the occipital lobe, such that the tract runs connecting the two ROIs. |
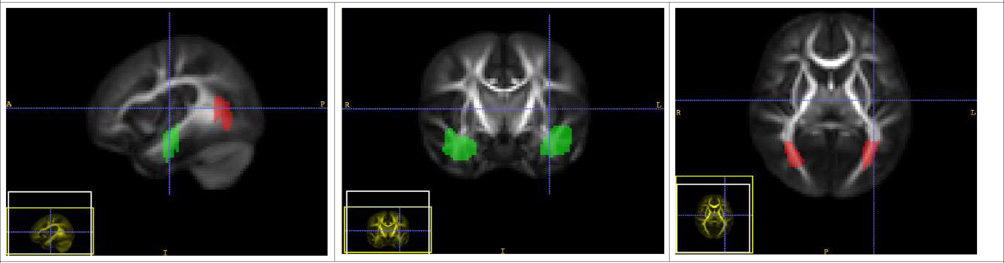 |
| Arcuate Fasciculus Tract (Left and Right) |
| The source ROI is placed at the white matter beneath the temporoparietal junction. There are three target ROIs, the first is positioned in the frontal cortex, and the second and third placed in the temporal lobe. The three target ROIs give three sub-pathways within arcuate. The first is named Arcuate-Superior arcuate, which provides connections from the temporoparietal junction to the frontal cortex and runs superior to the other two. The second is Arcuate-Inferior-Temporal tract, which connects the temporal lobe and rises up towards the junction and then towards the frontal region. The third is Arcuate-Superior-Temporal tract, which also runs from the temporal lobe and rises upwards to turn towards the frontal lobe. The second and third lie in an inferior and superior position with respect to each other and hence the names. |
 |
Footnotes
Publisher's Disclaimer: This is a PDF file of an unedited manuscript that has been accepted for publication. As a service to our customers we are providing this early version of the manuscript. The manuscript will undergo copyediting, typesetting, and review of the resulting proof before it is published in its final citable form. Please note that during the production process errors may be discovered which could affect the content, and all legal disclaimers that apply to the journal pertain.
References
- Agosta F, Henry RG, Migliaccio R, Neuhaus J, Miller BL, Dronkers NF, Brambati SM, Filippi M, Ogar JM, Wilson SM, Gorno-Tempini ML. Language networks in semantic dementia. Brain. 2010;133:286–299. doi: 10.1093/brain/awp233. [DOI] [PMC free article] [PubMed] [Google Scholar]
- Arsigny V, Fillard P, Pennec X, Ayache N. Log-Euclidean metrics for fast and simple calculus on diffusion tensors. Magn Reson Med. 2006;56:411–421. doi: 10.1002/mrm.20965. [DOI] [PubMed] [Google Scholar]
- Asato MR, Terwilliger R, Woo J, Luna B. White matter development in adolescence: a DTI study. Cereb Cortex. 2010;20:2122–2131. doi: 10.1093/cercor/bhp282. [DOI] [PMC free article] [PubMed] [Google Scholar]
- Barkovich AJ, Kjos BO, Jackson DE, Norman D. Normal maturation of the neonatal and infant brain: MR imaging at 1.5 T. Radiology. 1988;166:173–180. doi: 10.1148/radiology.166.1.3336675. [DOI] [PubMed] [Google Scholar]
- Basser PJ, Mattiello J, LeBihan D. MR diffusion tensor spectroscopy and imaging. Biophys J. 1994;66:259–267. doi: 10.1016/S0006-3495(94)80775-1. [DOI] [PMC free article] [PubMed] [Google Scholar]
- Beaulieu C. The basis of anisotropic water diffusion in the nervous system - a technical review. NMR Biomed. 2002;15:435–455. doi: 10.1002/nbm.782. [DOI] [PubMed] [Google Scholar]
- Bengtsson SL, Nagy Z, Skare S, Forsman L, Forssberg H, Ullen F. Extensive piano practicing has regionally specific effects on white matter development. Nat Neurosci. 2005;8:1148–1150. doi: 10.1038/nn1516. [DOI] [PubMed] [Google Scholar]
- Bird CR, Hedberg M, Drayer BP, Keller PJ, Flom RA, Hodak JA. MR assessment of myelination in infants and children: usefulness of marker sites. AJNR Am J Neuroradiol. 1989;10:731–740. [PMC free article] [PubMed] [Google Scholar]
- Brauer J, Anwander A, Friederici AD. Neuroanatomical prerequisites for language functions in the maturing brain. Cereb Cortex. 2011;21:459–466. doi: 10.1093/cercor/bhq108. [DOI] [PubMed] [Google Scholar]
- Brody BA, Kinney HC, Kloman AS, Gilles FH. Sequence of central nervous system myelination in human infancy. I. An autopsy study of myelination. J Neuropathol Exp Neurol. 1987;46:283–301. doi: 10.1097/00005072-198705000-00005. [DOI] [PubMed] [Google Scholar]
- Budde MD, Kim JH, Liang HF, Schmidt RE, Russell JH, Cross AH, Song SK. Toward accurate diagnosis of white matter pathology using diffusion tensor imaging. Magn Reson Med. 2007;57:688–695. doi: 10.1002/mrm.21200. [DOI] [PubMed] [Google Scholar]
- Catani M, Howard RJ, Pajevic S, Jones DK. Virtual in vivo interactive dissection of white matter fasciculi in the human brain. Neuroimage. 2002;17:77–94. doi: 10.1006/nimg.2002.1136. [DOI] [PubMed] [Google Scholar]
- Catani M, Jones DK, ffytche DH. Perisylvian language networks of the human brain. Ann Neurol. 2005;57:8–16. doi: 10.1002/ana.20319. [DOI] [PubMed] [Google Scholar]
- Conturo TE, Lori NF, Cull TS, Akbudak E, Snyder AZ, Shimony JS, McKinstry RC, Burton H, Raichle ME. Tracking neuronal fiber pathways in the living human brain. Proc Natl Acad Sci U S A. 1999;96:10422–10427. doi: 10.1073/pnas.96.18.10422. [DOI] [PMC free article] [PubMed] [Google Scholar]
- Corouge I, Fletcher PT, Joshi S, Gouttard S, Gerig G. Fiber tract-oriented statistics for quantitative diffusion tensor MRI analysis. Med Image Anal. 2006;vol. 10:786–798. doi: 10.1016/j.media.2006.07.003. [DOI] [PubMed] [Google Scholar]
- Datar M, Cates J, Fletcher PT, Gouttard S, Gerig G, Whitaker R. Particle based shape regression of open surfaces with applications to developmental neuroimaging. Med Image Comput Comput Assist Interv. 2009;12:167–174. doi: 10.1007/978-3-642-04271-3_21. [DOI] [PMC free article] [PubMed] [Google Scholar]
- Deoni SC, Mercure E, Blasi A, Gasston D, Thomson A, Johnson M, Williams SC, Murphy DG. Mapping infant brain myelination with magnetic resonance imaging. J Neurosci. 2011;31:784–791. doi: 10.1523/JNEUROSCI.2106-10.2011. [DOI] [PMC free article] [PubMed] [Google Scholar]
- Ding XQ, Sun Y, Braass H, Illies T, Zeumer H, Lanfermann H, Fiehler J. Evidence of rapid ongoing brain development beyond 2 years of age detected by fiber tracking. American Journal of Neuroradiology. 2008;vol. 29:1261–1265. doi: 10.3174/ajnr.A1097. [DOI] [PMC free article] [PubMed] [Google Scholar]
- Dirks D. Perception of dichotic and monaural verbal material and cerebral dominance for speech. Acta Otolaryngol. 1964;58:73–80. doi: 10.3109/00016486409121363. [DOI] [PubMed] [Google Scholar]
- Drobyshevsky A, Song SK, Gamkrelidze G, Wyrwicz AM, Derrick M, Meng F, Li L, Ji X, Trommer B, Beardsley DJ, Luo NL, Back SA, Tan S. Developmental changes in diffusion anisotropy coincide with immature oligodendrocyte progression and maturation of compound action potential. J Neurosci. 2005;25:5988–5997. doi: 10.1523/JNEUROSCI.4983-04.2005. [DOI] [PMC free article] [PubMed] [Google Scholar]
- Dubois J, Dehaene-Lambertz G, Perrin M, Mangin JF, Cointepas Y, Duchesnay E, Le Bihan D, Hertz-Pannier L. Asynchrony of the early maturation of white matter bundles in healthy infants: quantitative landmarks revealed noninvasively by diffusion tensor imaging. Hum Brain Mapp. 2008;vol. 29:14–27. doi: 10.1002/hbm.20363. [DOI] [PMC free article] [PubMed] [Google Scholar]
- Dubois J, Hertz-Pannier L, Cachia A, Mangin JF, Le Bihan D, Dehaene-Lambertz G. Structural asymmetries in the infant language and sensori-motor networks. Cereb Cortex. 2009;19:414–423. doi: 10.1093/cercor/bhn097. [DOI] [PubMed] [Google Scholar]
- Dubois J, Hertz-Pannier L, Dehaene-Lambertz G, Cointepas Y, Le Bihan D. Assessment of the early organization and maturation of infants' cerebral white matter fiber bundles: a feasibility study using quantitative diffusion tensor imaging and tractography. Neuroimage. 2006;vol. 30:1121–1132. doi: 10.1016/j.neuroimage.2005.11.022. [DOI] [PubMed] [Google Scholar]
- Duffau H, Capelle L, Sichez N, Denvil D, Lopes M, Sichez JP, Bitar A, Fohanno D. Intraoperative mapping of the subcortical language pathways using direct stimulations. An anatomo-functional study. Brain. 2002;125:199–214. doi: 10.1093/brain/awf016. [DOI] [PubMed] [Google Scholar]
- Duffau H, Gatignol P, Mandonnet E, Peruzzi P, Tzourio-Mazoyer N, Capelle L. New insights into the anatomo-functional connectivity of the semantic system: a study using cortico-subcortical electrostimulations. Brain. 2005;128:797–810. doi: 10.1093/brain/awh423. [DOI] [PubMed] [Google Scholar]
- Fillard P, Gilmore J, Piven J, Lin W, Gerig G. Quantitative Analysis of White Matter Fiber Properties along Geodesic Paths. Medical Image Computing and Computer-Assisted Intervention. 2003:16–23. [Google Scholar]
- Flechsig P. Anatomie des menschlichen Gehirns und Rückenmarks auf myelogenetischer Grundlage. Leipzig: Thieme; 1920. [Google Scholar]
- Fletcher PT, Lu C, Pizer SM, Joshi S. Principal geodesic analysis for the study of nonlinear statistics of shape. IEEE Trans Med Imaging. 2004;23:995–1005. doi: 10.1109/TMI.2004.831793. [DOI] [PubMed] [Google Scholar]
- Gao W, Lin W, Chen Y, Gerig G, Smith JK, Jewells V, Gilmore JH. Temporal and spatial development of axonal maturation and myelination of white matter in the developing brain. AJNR Am J Neuroradiol. 2009a;vol. 30:290–296. doi: 10.3174/ajnr.A1363. [DOI] [PMC free article] [PubMed] [Google Scholar]
- Gao W, Zhu H, Giovanello KS, Smith JK, Shen D, Gilmore JH, Lin W. Evidence on the emergence of the brain's default network from 2-week-old to 2-year-old healthy pediatric subjects. Proc Natl Acad Sci U S A. 2009b;vol. 106:6790–6795. doi: 10.1073/pnas.0811221106. [DOI] [PMC free article] [PubMed] [Google Scholar]
- Gilmore JH, Kang C, Evans DD, Wolfe HM, Smith JK, Lieberman JA, Lin W, Hamer RM, Styner M, Gerig G. Prenatal and neonatal brain structure and white matter maturation in children at high risk for schizophrenia. Am J Psychiatry. 2010;167:1083–1091. doi: 10.1176/appi.ajp.2010.09101492. [DOI] [PMC free article] [PubMed] [Google Scholar]
- Gilmore JH, Lin W, Corouge I, Vetsa YS, Smith JK, Kang C, Gu H, Hamer RM, Lieberman JA, Gerig G. Early postnatal development of corpus callosum and corticospinal white matter assessed with quantitative tractography. Am J Neuroradiol. 2007;vol. 28:1789–1795. doi: 10.3174/ajnr.A0751. [DOI] [PMC free article] [PubMed] [Google Scholar]
- Glantz LA, Gilmore JH, Hamer RM, Lieberman JA, Jarskog LF. Synaptophysin and postsynaptic density protein 95 in the human prefrontal cortex from mid-gestation into early adulthood. Neuroscience. 2007;149:582–591. doi: 10.1016/j.neuroscience.2007.06.036. [DOI] [PMC free article] [PubMed] [Google Scholar]
- Goodlett C, Davis B, Jean R, Gilmore J, Gerig G. Improved correspondence for DTI population studies via unbiased atlas building. Med Image Comput Comput Assist Interv. 2006;vol. 9:260–267. doi: 10.1007/11866763_32. [DOI] [PubMed] [Google Scholar]
- Goodlett CB, Fletcher PT, Gilmore JH, Gerig G. Group analysis of DTI fiber tract statistics with application to neurodevelopment. Neuroimage. 2009;vol. 45:S133–S142. doi: 10.1016/j.neuroimage.2008.10.060. [DOI] [PMC free article] [PubMed] [Google Scholar]
- Gouttard S, Goodlett CB, Kubicki M, Gerig G. Measures for Validation of DTI Tractography. SPIE Medical Imaging. 2012 doi: 10.1117/12.911546. [DOI] [PMC free article] [PubMed] [Google Scholar]
- Green PJ, Silverman BW. Nonparametric Regression and Generalized Linear Models: A roughness Penalty Approach. New York: Chapman and Hall; 1994. [Google Scholar]
- Guo W. Functional mixed effects models. Biometrics. 2002;58:121–128. doi: 10.1111/j.0006-341x.2002.00121.x. [DOI] [PubMed] [Google Scholar]
- Harsan LA, Poulet P, Guignard B, Steibel J, Parizel N, de Sousa PL, Boehm N, Grucker D, Ghandour MS. Brain dysmyelination and recovery assessment by noninvasive in vivo diffusion tensor magnetic resonance imaging. J Neurosci Res. 2006;83:392–402. doi: 10.1002/jnr.20742. [DOI] [PubMed] [Google Scholar]
- Haynes RL, Borenstein NS, Desilva TM, Folkerth RD, Liu LG, Volpe JJ, Kinney HC. Axonal development in the cerebral white matter of the human fetus and infant. J Comp Neurol. 2005;vol. 484:156–167. doi: 10.1002/cne.20453. [DOI] [PubMed] [Google Scholar]
- Hermoye L, Saint-Martin C, Cosnard G, Lee SK, Kim J, Nassogne MC, Menten R, Clapuyt P, Donohue PK, Hua K, Wakana S, Jiang H, van Zijl PC, Mori S. Pediatric diffusion tensor imaging: normal database and observation of the white matter maturation in early childhood. Neuroimage. 2006;vol. 29:493–504. doi: 10.1016/j.neuroimage.2005.08.017. [DOI] [PubMed] [Google Scholar]
- Hüppi PS, Maier SE, Peled S, Zientara GP, Barnes PD, Jolesz FA, Volpe JJ. Microstructural development of human newborn cerebral white matter assessed in vivo by diffusion tensor magnetic resonance imaging. Pediatr Res. 1998;44:584–590. doi: 10.1203/00006450-199810000-00019. [DOI] [PubMed] [Google Scholar]
- Huttenlocher PR, Dabholkar AS. Regional differences in synaptogenesis in human cerebral cortex. J Comp Neurol. 1997;387:167–178. doi: 10.1002/(sici)1096-9861(19971020)387:2<167::aid-cne1>3.0.co;2-z. [DOI] [PubMed] [Google Scholar]
- Innocenti GM, Price DJ. Exuberance in the development of cortical networks. Nat Rev Neurosci. 2005;6:955–965. doi: 10.1038/nrn1790. [DOI] [PubMed] [Google Scholar]
- Johnson CP, Juranek J, Kramer LA, Prasad MR, Swank PR, Ewing-Cobbs L. Predicting Behavioral Deficits in Pediatric Traumatic Brain Injury Through Uncinate Fasciculus Integrity. J Int Neuropsychol Soc. 2011:1–11. doi: 10.1017/S1355617711000464. [DOI] [PMC free article] [PubMed] [Google Scholar]
- Joshi S, Davis B, Jomier M, Gerig G. Unbiased diffeomorphic atlas construction for computational anatomy. Neuroimage. 2004;vol. 23(Suppl 1):S151–S160. doi: 10.1016/j.neuroimage.2004.07.068. [DOI] [PubMed] [Google Scholar]
- Kasprian G, Brugger PC, Weber M, Krssak M, Krampl E, Herold C, Prayer D. In utero tractography of fetal white matter development. Neuroimage. 2008;43:213–224. doi: 10.1016/j.neuroimage.2008.07.026. [DOI] [PubMed] [Google Scholar]
- Kinney HC, Brody BA, Kloman AS, Gilles FH. Sequence of central nervous system myelination in human infancy. II. Patterns of myelination in autopsied infants. J Neuropathol Exp Neurol. 1988;47:217–234. doi: 10.1097/00005072-198805000-00003. [DOI] [PubMed] [Google Scholar]
- Klingberg T, Vaidya CJ, Gabrieli JD, Moseley ME, Hedehus M. Myelination and organization of the frontal white matter in children: a diffusion tensor MRI study. Neuroreport. 1999;10:2817–2821. doi: 10.1097/00001756-199909090-00022. [DOI] [PubMed] [Google Scholar]
- Knickmeyer RC, Gouttard S, Kang C, Evans D, Wilber K, Smith JK, Hamer RM, Lin W, Gerig G, Gilmore JH. A structural MRI study of human brain development from birth to 2 years. J Neurosci. 2008;28:12176–12182. doi: 10.1523/JNEUROSCI.3479-08.2008. [DOI] [PMC free article] [PubMed] [Google Scholar]
- Le Bihan D, Mangin JF, Poupon C, Clark CA, Pappata S, Molko N, Chabriat H. Diffusion tensor imaging: concepts and applications. J Magn Reson Imaging. 2001;13:534–546. doi: 10.1002/jmri.1076. [DOI] [PubMed] [Google Scholar]
- Lebel C, Walker L, Leemans A, Phillips L, Beaulieu C. Microstructural maturation of the human brain from childhood to adulthood. Neuroimage. 2008;40:1044–1055. doi: 10.1016/j.neuroimage.2007.12.053. [DOI] [PubMed] [Google Scholar]
- Lee B, Park JY, Jung WH, Kim HS, Oh JS, Choi CH, Jang JH, Kang DH, Kwon JS. White matter neuroplastic changes in long-term trained players of the game of "Baduk" (GO): a voxel-based diffusion-tensor imaging study. Neuroimage. 2010;52:9–19. doi: 10.1016/j.neuroimage.2010.04.014. [DOI] [PubMed] [Google Scholar]
- Liu Z, Wang Y, Gerig G, Gouttard S, Tao R, Fletcher T, Styner M. Quality Control of Diffusion Weighted Images. Proc of SPIE. 2010;7628:1–9. doi: 10.1117/12.844748. [DOI] [PMC free article] [PubMed] [Google Scholar]
- Lobel U, Sedlacik J, Gullmar D, Kaiser WA, Reichenbach JR, Mentzel HJ. Diffusion tensor imaging: the normal evolution of ADC, RA, FA, and eigenvalues studied in multiple anatomical regions of the brain. Neuroradiology. 2009;51:253–263. doi: 10.1007/s00234-008-0488-1. [DOI] [PubMed] [Google Scholar]
- Luo L, O'Leary DD. Axon retraction and degeneration in development and disease. Annu Rev Neurosci. 2005;28:127–156. doi: 10.1146/annurev.neuro.28.061604.135632. [DOI] [PubMed] [Google Scholar]
- Mandonnet E, Nouet A, Gatignol P, Capelle L, Duffau H. Does the left inferior longitudinal fasciculus play a role in language? A brain stimulation study. Brain. 2007;130:623–629. doi: 10.1093/brain/awl361. [DOI] [PubMed] [Google Scholar]
- Miller MI, Trouve A, Younes L. On the metrics and euler-lagrange equations of computational anatomy. Annu Rev Biomed Eng. 2002;vol. 4:375–405. doi: 10.1146/annurev.bioeng.4.092101.125733. [DOI] [PubMed] [Google Scholar]
- Mori S, van Zijl PC. Fiber tracking: principles and strategies - a technical review. NMR Biomed. 2002;15:468–480. doi: 10.1002/nbm.781. [DOI] [PubMed] [Google Scholar]
- Mukherjee P, Miller JH, Shimony JS, Philip JV, Nehra D, Snyder AZ, Conturo TE, Neil JJ, McKinstry RC. Diffusion-tensor MR imaging of gray and white matter development during normal human brain maturation. AJNR Am J Neuroradiol. 2002;vol. 23:1445–1456. [PMC free article] [PubMed] [Google Scholar]
- Nagy Z, Westerberg H, Klingberg T. Maturation of white matter is associated with the development of cognitive functions during childhood. J Cogn Neurosci. 2004;16:1227–1233. doi: 10.1162/0898929041920441. [DOI] [PubMed] [Google Scholar]
- Nakamura M, McCarley RW, Kubicki M, Dickey CC, Niznikiewicz MA, Voglmaier MM, Seidman LJ, Maier SE, Westin CF, Kikinis R, Shenton ME. Fronto-temporal disconnectivity in schizotypal personality disorder: a diffusion tensor imaging study. Biol Psychiatry. 2005;58:468–478. doi: 10.1016/j.biopsych.2005.04.016. [DOI] [PMC free article] [PubMed] [Google Scholar]
- Neil J, Miller J, Mukherjee P, Huppi PS. Diffusion tensor imaging of normal and injured developing human brain - a technical review. NMR Biomed. 2002;15:543–552. doi: 10.1002/nbm.784. [DOI] [PubMed] [Google Scholar]
- Neil JJ, Shiran SI, McKinstry RC, Schefft GL, Snyder AZ, Almli CR, Akbudak E, Aronovitz JA, Miller JP, Lee BC, Conturo TE. Normal brain in human newborns: apparent diffusion coefficient and diffusion anisotropy measured by using diffusion tensor MR imaging. Radiology. 1998;209:57–66. doi: 10.1148/radiology.209.1.9769812. [DOI] [PubMed] [Google Scholar]
- Nucifora PG, Verma R, Melhem ER, Gur RE, Gur RC. Leftward asymmetry in relative fiber density of the arcuate fasciculus. Neuroreport. 2005;16:791–794. doi: 10.1097/00001756-200505310-00002. [DOI] [PubMed] [Google Scholar]
- Partridge SC, Mukherjee P, Henry RG, Miller SP, Berman JI, Jin H, Lu Y, Glenn OA, Ferriero DM, Barkovich AJ, Vigneron DB. Diffusion tensor imaging: serial quantitation of white matter tract maturity in premature newborns. Neuroimage. 2004;vol. 22:1302–1314. doi: 10.1016/j.neuroimage.2004.02.038. [DOI] [PubMed] [Google Scholar]
- Paus T, Collins DL, Evans AC, Leonard G, Pike B, Zijdenbos A. Maturation of white matter in the human brain: a review of magnetic resonance studies. Brain Res Bull. 2001;54:255–266. doi: 10.1016/s0361-9230(00)00434-2. [DOI] [PubMed] [Google Scholar]
- Peterson BS. Brain imaging studies of the anatomical and functional consequences of preterm birth for human brain development. Ann N Y Acad Sci. 2003;vol. 1008:219–237. doi: 10.1196/annals.1301.023. [DOI] [PubMed] [Google Scholar]
- Ramsay JO, Silverman BW. Applied Functional Data Analysis: Methods and Case Studies. New York: Springer-Verlag; 2002. [Google Scholar]
- Richardson EP., Jr . Myelination in the human central nervous system. In: Haymaker W, Adams RD, editors. Histology and histopathology of the nervous system. Springfield (IL): Thomas; 1982. pp. 146–173. [Google Scholar]
- Rilling JK, Glasser MF, Preuss TM, Ma X, Zhao T, Hu X, Behrens TE. The evolution of the arcuate fasciculus revealed with comparative DTI. Nat Neurosci. 2008;11:426–428. doi: 10.1038/nn2072. [DOI] [PubMed] [Google Scholar]
- Sampaio RC, Truwit CL. Myelination in the Developing Human Brain. Cambridge, Mass: MIT Press; 2001. [Google Scholar]
- Schmahmann JD, Pandya DN. Cerebral white matter--historical evolution of facts and notions concerning the organization of the fiber pathways of the brain. J Hist Neurosci. 2007;16:237–267. doi: 10.1080/09647040500495896. [DOI] [PubMed] [Google Scholar]
- Schmithorst VJ, Wilke M, Dardzinski BJ, Holland SK. Correlation of white matter diffusivity and anisotropy with age during childhood and adolescence: a cross-sectional diffusion-tensor MR imaging study. Radiology. 2002;vol. 222:212–218. doi: 10.1148/radiol.2221010626. [DOI] [PMC free article] [PubMed] [Google Scholar]
- Schneider JF, Il'yasov KA, Hennig J, Martin E. Fast quantitative diffusion-tensor imaging of cerebral white matter from the neonatal period to adolescence. Neuroradiology. 2004;vol. 46:258–266. doi: 10.1007/s00234-003-1154-2. [DOI] [PubMed] [Google Scholar]
- Shinoura N, Midorikawa A, Kurokawa K, Onodera T, Tsukada M, Yamada R, Tabei Y, Koizumi T, Yoshida M, Saito S, Yagi K. Right temporal lobe plays a role in verbal memory. Neurol Res. 2011;33:734–738. doi: 10.1179/1743132811Y.0000000005. [DOI] [PubMed] [Google Scholar]
- Smith SM, Jenkinson M, Johansen-Berg H, Rueckert D, Nichols TE, Mackay CE, Watkins KE, Ciccarelli O, Cader MZ, Matthews PM, Behrens TE. Tract-based spatial statistics: voxelwise analysis of multi-subject diffusion data. Neuroimage. 2006;31:1487–1505. doi: 10.1016/j.neuroimage.2006.02.024. [DOI] [PubMed] [Google Scholar]
- Snook L, Paulson LA, Roy D, Phillips L, Beaulieu C. Diffusion tensor imaging of neurodevelopment in children and young adults. Neuroimage. 2005;26:1164–1173. doi: 10.1016/j.neuroimage.2005.03.016. [DOI] [PubMed] [Google Scholar]
- Song SK, Sun SW, Ju WK, Lin SJ, Cross AH, Neufeld AH. Diffusion tensor imaging detects and differentiates axon and myelin degeneration in mouse optic nerve after retinal ischemia. Neuroimage. 2003;20:1714–1722. doi: 10.1016/j.neuroimage.2003.07.005. [DOI] [PubMed] [Google Scholar]
- Song SK, Sun SW, Ramsbottom MJ, Chang C, Russell J, Cross AH. Dysmyelination revealed through MRI as increased radial (but unchanged axial) diffusion of water. Neuroimage. 2002;17:1429–1436. doi: 10.1006/nimg.2002.1267. [DOI] [PubMed] [Google Scholar]
- Sun T, Patoine C, Abu-Khalil A, Visvader J, Sum E, Cherry TJ, Orkin SH, Geschwind DH, Walsh CA. Early asymmetry of gene transcription in embryonic human left and right cerebral cortex. Science. 2005;308:1794–1798. doi: 10.1126/science.1110324. [DOI] [PMC free article] [PubMed] [Google Scholar]
- Takao H, Abe O, Yamasue H, Aoki S, Sasaki H, Kasai K, Yoshioka N, Ohtomo K. Gray and white matter asymmetries in healthy individuals aged 21–29 years: A voxel-based morphometry and diffusion tensor imaging study. Hum Brain Mapp Epub ahead of print. 2010 doi: 10.1002/hbm.21145. [DOI] [PMC free article] [PubMed] [Google Scholar]
- Verhoeven JS, Sage CA, Leemans A, Van Hecke W, Callaert D, Peeters R, De Cock P, Lagae L, Sunaert S. Construction of a stereotaxic DTI atlas with full diffusion tensor information for studying white matter maturation from childhood to adolescence using tractography-based segmentations. Hum Brain Mapp. 2010;31:470–486. doi: 10.1002/hbm.20880. [DOI] [PMC free article] [PubMed] [Google Scholar]
- Vernooij MW, Smits M, Wielopolski PA, Houston GC, Krestin GP, van der Lugt A. Fiber density asymmetry of the arcuate fasciculus in relation to functional hemispheric language lateralization in both right- and left-handed healthy subjects: a combined fMRI and DTI study. Neuroimage. 2007;35:1064–1076. doi: 10.1016/j.neuroimage.2006.12.041. [DOI] [PubMed] [Google Scholar]
- Wimberger DM, Roberts TP, Barkovich AJ, Prayer LM, Moseley ME, Kucharczyk J. Identification of "premyelination" by diffusion-weighted MRI. J Comput Assist Tomogr. 1995;19:28–33. doi: 10.1097/00004728-199501000-00005. [DOI] [PubMed] [Google Scholar]
- Yakovlev PI, Lecours AR. The myelogenetic cycles of regional maturation in the brain. In: Minowski A, editor. Regional Development of the Brain in Early Life. Oxford: Blackwell; 1967. pp. 3–69. [Google Scholar]
- Zhang J, Jones M, DeBoy CA, Reich DS, Farrell JA, Hoffman PN, Griffin JW, Sheikh KA, Miller MI, Mori S, Calabresi PA. Diffusion tensor magnetic resonance imaging of Wallerian degeneration in rat spinal cord after dorsal root axotomy. J Neurosci. 2009;29:3160–3171. doi: 10.1523/JNEUROSCI.3941-08.2009. [DOI] [PMC free article] [PubMed] [Google Scholar]
- Zhang J-T, Chen J. Statistical Inferences for Functional Data. Annals of Statistics. 2007;35:1052–1079. [Google Scholar]