Abstract
A compromised protein degradation machinery has been implicated in methamphetamine (MA)-induced neurodegeneration. However, the signaling mechanisms that induce autophagy and UPS dysfunction are not well understood. The present study investigates the contributions of PKC delta (PKCδ) mediated signaling events in MA-induced autophagy, UPS dysfunction and cell death. Using an in vitro mesencephalic dopaminergic cell culture model, we demonstrate that MA-induced early induction of autophagy is associated with reduction in proteasomal function and concomitant dissipation of mitochondrial membrane potential (MMP), followed by significantly increased of PKCδ activation, caspase-3 activation, accumulation of ubiquitin positive aggregates and microtubule associated light chain-3 (LC3-II) levels. Interestingly, siRNA mediated knockdown of PKCδ or overexpression of cleavage resistant mutant of PKCδ dramatically reduced MA-induced autophagy, proteasomal function, and associated accumulation of ubiquitinated protein aggregates, which closely paralleled cell survival. Importantly, when autophagy was inhibited either pharmacologically (3-MA) or genetically (siRNA mediated silencing of LC3), the dopaminergic cells became sensitized to MA-induced apoptosis through caspase-3 activation. Conversely, overexpression of LC3 partially protected against MA-induced apoptotic cell death, suggesting a neuroprotective role for autophagy in MA-induced neurotoxicity. Notably, rat striatal tissue isolated from MA treated rats also exhibited elevated LC3-II, ubiquitinated protein levels, and PKCδ cleavage. Taken together, our data demonstrate that MA-induced autophagy serves as an adaptive strategy for inhibiting mitochondria mediated apoptotic cell death and degradation of aggregated proteins. Our results also suggest that the sustained activation of PKCδ leads to UPS dysfunction, resulting in the activation of caspase-3 mediated apoptotic cell death in the nigrostriatal dopaminergic system.
Keywords: PKCδ, autophagy, UPS dysfunction, methamphetamine, apoptosis, dopaminergic neuronal cells, LC3, mTOR
Methamphetamine (MA) is a psychostimulant drug of abuse that has been shown to cause long term neurotoxicity in rodents, nonhuman primates and humans (Ricaurte et al., 1982;Wilson et al., 1996). MA treatment produces sustained reduction in striatal dopamine levels, persistent loss of dopaminergic nerve terminals, reduced activity of tyrosine hydroxylase, and a pronounced loss of dopamine transporter (Miller and O’Callaghan, 1994;Nakayama et al., 1993). Additional evidence suggests that enhanced oxidative stress is a critical contributor to MA-induced neurotoxicity (Yamato et al., 2010;Kita et al., 2009;Miyazaki and Asanuma, 2009). The excessive release of DA-induced by MA has been linked to increased production of reactive oxygen species. In fact, oxidative damage to lipids, proteins and DNA has been found in MA treated animals (Jayanthi et al., 1998;Jeng et al., 2005;LaVoie and Hastings, 1999). Although it is well known that MA causes DA terminal degeneration, accumulating evidence indicates that MA causes injury to cell bodies in diverse brain regions (Yu et al., 2004;Zhu et al., 2006). For example, pronounced degeneration of cortical gray matter and hippocampal tissue was observed in the brains of human MA users (Thompson et al., 2004). Taken together, oxidative stress dependent cell death signaling events may underlie MA-induced neurotoxicity.
Recent studies indicate that MA-induced neurotoxicity is associated with the formation of ubiquitin positive aggregates and multilamellar bodies, suggesting that induction of autophagy may constitute a cytoprotective response following MA treatment (Castino et al., 2008a;Fornai et al., 2008). Likewise, ubiquitin positive proteinaceous inclusions were found in the nigral neurons of chronic MA abusers (Quan et al., 2005), which supports the notion that UPS dysfunction may be functionally linked to MA-induced neurotoxicity. Excessive accumulation of aggregate-prone proteins has been identified as a causative factor in the disease pathogenesis; thus the cellular regulatory mechanisms that control protein degradation needs to be investigated.
The two major intracellular degradation systems in eukaryotic cells are the ubiquitin-proteasome system (UPS) and the autophagy lysosome pathway (ALS). Impaired protein degradation has been implicated in the cellular toxicity and eventual degenerative processes in chronic neurodegenerative disorders including Parkinson’s disease, Alzheimer’s disease, Huntington’s disease, and other related proteinopathies (Pan et al., 2008a). UPS primarily degrades short lived and cytosolic proteins. On the other hand, macroautophagy (herein referred to as autophagy) degrades soluble proteins, large aggregates, and organelles in the cytoplasm, and is a highly conserved bulk degradation system in eukaryotes (Mizushima, 2007). However, the potential link between UPS dysfunction and autophagy in MA-induced dopaminergic toxicity remains unclear.
Protein kinase C delta (PKCδ) belongs to a family of 11 structurally related serine/threonine protein kinases that play a critical role in cell proliferation, survival, and death (Reyland, 2009). Recently, we reported that PKCδ is highly expressed in nigrostriatal dopaminergic neurons and that the kinase is activated by proteolytic cleavage in response to oxidative stress (Zhang et al., 2011). Herein, we show a novel pathway by which MA induces proteolytic cleavage of PKCδ, which, in turn, mediates UPS dysfunction, resulting in the deregulation of ALS, and ultimately dopaminergic neuronal cell death.
1. EXPERIMENTAL PROCEDURES
1.1 Reagents
(±)Methamphetamine (MA) was kindly provided by NIDA (National Institute of Drug Abuse Bethesda, MD). Dansyl cadaverine, caspase3 inhibitor Z-DEVD fmk (Z-DEVD), 3-methyladenine (3-MA) was purchased from Sigma chemical company (St. Louis, MO). JC-1 was purchased from Molecular Probes (Eugene, OR). Antibodies against microtubule associated protein 1-light chain 3 (MAP1-LC3), and Beclin 1, were obtained from Abcam Inc (Cambridge, MA).
1.2 Cell culture
Rat mesencephalic dopaminergic neuronal cell line (N27 cells) were grown in RPMI 1640 medium supplemented with 10% fetal bovine serum, 2mM L-glutamine, 50 units penicillin and 50μg/ml streptomycin. Cell cultures were maintained under 5% CO2 at 37°C as previously described (Yang et al., 2004). Primary mesencephalic preparation procedures were followed as previously described (Yang et al., 2004). Ventral mesencephalon was dissected from E14~15 day old mouse embryos; cell dissociation was done by incubating the dissected tissue in trypsin-EDTA (0.25%) for 30 minutes. Dissociated cells were grown on poly-D-lysine precoated glass cover slips placed in 24 well plates and incubated with 10% fetus bovine serum medium containing supplement B27, L-glutamine, penicillin, streptomycin and L-glutamate. Approximately 1 million cells were plated for each well. Cells were maintained in 5% CO2 at 37°C humidified environment. 10μM cytosine-arabinoside was added on the next day to inhibit glial cell proliferation. Treatments were done 5~7 days post dissection.
1.3 Animal treatments
One year old aged male Wistar rats weighing about 300–500 g were obtained from Harlan Indianapolis. The animals were maintained on a 12 h light-12 h dark schedule with food and water available ad libitum. Methamphetamine hydrochloride (MA) was dissolved in saline. Total rats used for this study were 24 rats and they were divided into four groups (6 rats in each group). In the present study, we exposed rats to MA (4 × 20 mg/kg; 2 h intervals, i.p.), and the striatal tissue was harvested at the indicated time points (24 h and 1 week after the last dose of MA) and processed for Western blot analysis. The experimental protocol and procedures were in compliance with the National Institutes of Health Guide for care and use of Laboratory animals (publication No.85-23).
1.4 Plasmid construction and siRNA transfection
pCMV-myc-LC3 was purchased from Addgene (24919). The plasmid pHA-PKCδ-CF encoding HA tagged PKCδ fragment and LC3-RFP plasmids were obtained from Addgene. We used the virapower Lentiviral expression system (k4960-00 Invitrogen) to establish stable transfectants of V5-tagged caspase resistant mutant of PKCδD327A (aspartate to alanine mutation at position 327) or V5-tagged LacZ in N27 cells. The stable N27 cells expressing V5- PKCδD327A (herein refered to as PKCδ-CRM expressing cells) and V5-LacZ (herein referred to as LacZ control cells) were further maintained in 10 μg/ml blasticidin containing N27 growth media. The exact procedure was performed as described previously (Sun et al., 2008). To generate a stable cell line expressing dominant negative PKCδ mutant, N27 cells were stably transfected with pPKCδK376R-GFP or pEGFP-N1 empty vector as described previously (Anantharam et al., 2002). Mutation of lysine residue at position 376 in the catalytic site of PKCδ renders it inactive. The stable cells (herein referred to as PKCδ-DN expressing and GFP-control cells) were cultured as described previously (Anantharam et al., 2002).
For PKCδ and LC3 gene silencing, we utilized commercially available small interfering RNAs from Invitrogen for PKCδ and Dharmacon (Lafayette, CO) for LC3. Pre-validated stealth RNAi (Invitrogen) targeted to PKCδ were synthesized and purified by Invitrogen (Stealth). siRNA with equivalent % GC nucleotide content was used as a negative control (scramble sequence). Cells were transfected with 300–600 nM siRNA using AMAXA Nucleofector reagent (Amaxa Inc., Gaithersburg MA). Briefly, 3 × 10⁶ cells were suspended in 100 μl Nucleofector solution V and then siRNA was added to the solution and subsequently subjected to electroporation. Transfection efficiency was determined by using pmaxGFP control plasmid (Amaxa). Following transfection (24h-PKCδ and 48h for LC3) cells were collected for Western analysis or biochemical analysis. Transient transfection of pCMV-myc-LC3 plasmid was performed as detailed above. Briefly 3 × 10⁶ cells at room temperature was added to 2–5 μg of plasmid DNA, mixed well and electroporated using preprogrammed settings (A23) on the Amaxa nucleofector apparatus. Upon completion of pulsing the cells, they were transferred to T-75 flasks containing 10 ml of pre-warmed media and cultured for another 24h.
1.5 DNA fragmentation and Sytox cell death assays
Cell Death Detection ELISA Plus Assay Kit (Roche Molecular Biochemicals, Indianapolis, IN) was used for the measurement of DNA fragmentation (Anantharam et al., 2002). The procedure was similar to described in our recent publications (Sun et al., 2008). Briefly, cells were resuspended in the lysis buffer provided in the assay kit. Following incubation for 30 mins in the lysis buffer, cells were harvested and the lysate was prepared by centrifuging at 200 × g for 10 mins. 20 μl of the supernatant was incubated for 2 h in a mixture of HRP-conjugated antibody cocktail that recognizes histone associated single and double stranded DNA. After thorough washing of the unbound components, the final reaction product was measured colorimetrically with ABTS as an HRP substrate and the fluorescence was determined using a spectrophotometer at 405 nm (490 nm as reference). Cell death was assessed by the uptake of cell impermeable dye Sytox green (Invitrogen, Carlsbad, CA) after exposure to MA. The procedure was performed according to a methodology described in our previous publications (Asaithambi et al., 2011;Jin et al., 2011). Briefly, cells were grown in a 24 well plate and exposed to MA in a media containing 1 μM Sytox green. Dead cells fluoresce green and can be viewed directly under a fluorescence microscope or optical density determined using a fluorescence microplate reader (SpectraMax Gemini XS Model, Molecular devices, Sunnyvale, CA) at an excitation wavelength of 485 nm and emi wavelength of 538 nm.
1.6 MDC assay and dual-immunostaining
Monodansylcadaverine (MDC) is an autofluorescent drug which can be used as a marker for autophagolysosome. This MDC assay was used as described by Daniela et al., 2001 with some modifications. Treated cells were incubated with 0.05 mM MDC in PBS at 37°C for 10 min. After incubation, cells were collected and lysed with 200μL of 10mM Tris-HCl, pH 8 containing 0.1% Triton X-100 for 30 minutes on a microtube shaker. Samples were then transferred to 96-well plates and measured with fluorescence photometry plate reader (excitation wavelength 380nm, emission filter 525nm). Cells were incubated with 0.2μM ethidium bromide directly in the 96-well plate and the DNA fluorescence was measured (excitation wavelength 530nm, emission filter 590nm). MDC activity was normalized to the DNA values for comparison. MDC incorporated autophagic vacuoles were visualized using a Leica DMIRE2 inverted microscope.
1.7 Transmission electron microscopy
For transmission electron microscopy (TEM), cells grown on coverslips were fixed with 2% glutaraldehyde (w/v) and 2% paraformaldehyde (w/v) in 0.1M sodium cacodylate buffer, pH 7.2, for 48 hours at 4°C. Samples were washed in PBS and then fixed in 1% osmium tetroxide in 0.1 M cacodylate buffer for 1 hour at room temperature. The samples were then dehydrated in a graded ethanol series, cleared with ultra pure acetone, and embedded using a modified EPON epoxy resin (Embed 812; Electron Microscopy Sciences, Ft. Washington, PA). Resin blocks were polymerized for 48 hours at 70°C. Thick and ultrathin sections were generated using a Leica UC6 ultramicrotome (Leeds Precision Instruments, Minneapolis, MN). Ultrathin sections were collected onto copper grids and images were captured using a JEM 2100 200kV scanning and transmission electron microscope (Japan Electron Optic Laboratories, Peabody, MA).
1.8 Western blot analysis of whole cell and brain samples
Treated cells were collected and lysed with RIPA buffer (Sigma) in ice and sonicated for 15 seconds on ice for each sample. Samples were centrifuged at 14,000 g for 15 mins at 4°C. Supernatants were collected and stored at −80°C until use. Samples were separated on 8–15% SDS-PAGE, depending on the molecular weight of the target protein and transferred onto nitrocellulose membranes. In brief, membranes were blocked and incubated with primary antibodies overnight at 4°C. Primary antibodies used in the following experiments included anti-MAP-LC3-II (1:250; Abgent, San Diego CA); anti-Akt, anti-phospho-Akt, anti-mTOR, anti-phospho-mTOR (1:200; AbCam, Cambridge, MA), anti-ubiquitin (1:2000; Dakocytomation), cytochrome c (1:500; Dakocytomation). β-actin (1:10,000) was used for equal protein detection. Membranes were washed several times and incubated with IR Dye 800-conjugated anti-rabbit IgG (1:5000) or Alexa Flour 680-conjugated anti-mouse IgG (1:10000; Molecular Probes, Invitrogen) for 1 h at room temperature. Membranes were scanned using the Odyssey IR Imaging system (LICOR) and data were analyzed with Odyssey 2.0 software.
Brain samples were prepared as previously described (Sun et al., 2006). Briefly, brain samples were incubated on ice in lysis buffer, containing protease inhibitors and 1%Triton X-100. Samples were sonicated on ice for 15 seconds and lysates were centrifuged at 100,000 × g for 50mins. Supernatants were collected for protein assay and equal amounts of proteins were separated with 10% SDS-PAGE and transferred onto nitrocellulose membranes. Standard Western blot procedure was done for immunoblot with overnight incubation with anti-ubiquitin (1:250; Millipore) at 4°C and β-actin 1:5000 (Sigma, St. Louis, MO) to confirm equal protein loading. Membranes were washed several times and incubated with IR Dye 800-conjugated anti-rabbit IgG (1:5000) or Alexa Flour 680-conjugated anti-mouse IgG (1:10000; Molecular probes, Invitrogen) for 1 h at room temperature. Membranes were scanned using the Odyssey IR Imaging system (LICOR) and data were analyzed with Odyssey 2.0 software.
1.9 Immunocytochemistry
Immunostaining was done in both N27 cell cultures and primary cell cultures. Briefly, cells were fixed with 4% paraformaldehyde after the desired treatment time. Washing between steps were done with PBS, three times each. Samples were blocked with 5% serum (either donkey or goat), 0.4% BSA, 0.2% Triton x-100 for 1 hour and primary antibodies were incubated in the same 5% serum solution overnight at 4°C. Primary antibodies used in the following series of experiments included rabbit anti-ubiquitin (1:500; Dakocytomation), anti-LC3 (1:3000), mouse anti-TH (1:1000), anti-MAP-LC3 (1:3000; Santa Cruz), and anti-lamp2 (1:300; Invitrogen). Immunocomplexes were revealed using secondary antibodies using either Cy-3-conjugated or FITC-conjugated, donkey anti-rabbit IgG or donkey anti-mouse IgG (purchased from Jackson Immunoresearch Laboratories, West Grove, PA) as needed. Nucleus was counterstained with Hoechst (10 μg/ml) for 5 minutes and then washed with PBS and mounted on slides and images were acquired and analyzed using a Zeiss LSM 510 Laser scanning microscope (Zeiss, Oberkochen, Germany) equipped with an X100 oil-immersion objective.
1.10 Proteasomal assay
The ubiquitin proteasomal degradation was measured by monitoring the proteasome activity as described in our recent publication with slight modifications (Sun et al., 2006, 2009). Briefly, cells were resuspended in buffer containing 50mM Tris–HCl, 1mM EDTA and 10mM EGTA, and incubated at 37°C for 20 min. After incubation, lysates were centrifuged at 16,000 × g for 10 min. Supernatants were collected and incubated with fluoregenic substrate, 50μM Suc-LLVY-AMC, for determination of proteasomal activities. After 1 hour incubation with the substrate, samples were detected with fluorescence plate reader (excitation 380 nm and emission 460 nm) (Gemini Plate Reader, Molecular Devices Corporation).
1.11 Measurement of mitochondrial transmembrane potential
JC-1 (Molecular probes), a cationic lipophilic fluorescent dye, is used to measure mitochondria membrane potential. JC-1 can enter the matrix of healthy mitochondria membrane and form aggregates which fluoresce red; however, cells with low membrane potential will harbor monomeric JC-1 and fluoresce green. Therefore, assessment of the red/green ratio can help to identify mitochondrial membrane potential status. Cells were incubated with 2μg/mL of JC-1 for 20 minutes at 37°C. The cell pellet was resuspended in 200μL of 10mM Tris-HCl, pH 8 containing 0.1% Triton X-100 for 30 minutes on a microtube shaker. Samples were then transferred to 96-well plates and measured with fluorescence plate reader. Healthy mitochondria form J-aggregates and displays strong fluorescence at excitation and emission wavelengths at 560 and 595 nm, respectively. In depolarized mitochondria, JC-1 exists as J monomers shows strong fluorescent intensity with excitation and emission wavelength at 485 and 535 nm, respectively. The shift in ratio of fluorescent intensity of JC-1 aggregates to fluorescent intensity of monomers is used as an indicator of depolarization of transmembrane potential. Control cells were treated with fCCP (carbonylcyanide 3-chlorophenylhydrazone) a mitochondrial depolarizing agent, and incubated for the indicated time period and fluorescent readings were taken using fluorometry technique. Separate samples were prepared with cells grown on glass cover slips and treated with MA. Upon desired treatment time, cells were stained directly with JC-1 final concentration of 2μg/ml for 20 minutes and mounted on slides for imaging under the fluorescent microscope.
1.12 Kinase assay
The enzymatic activity of PKCδ was detected using immunoprecipitation kinase assay as described previously (Latchoumycandane et al., 2005). Treated cells were collected and lysed with lysis buffer containing 25mM HEPES, pH 7.5, 20mM β-glycerophosphate, 0.1mM sodium orthovanadate, 0.1%Triton X-100, 0.3 mM NaCl, 1.5 mM MgCl2, 0.2 mM EDTA, 0.5mM DTT, 10mM NaF, 4 μg/ml aprotinin and 4 μg/ml leupeptin. The cells lysates were centrifuged at 10,000 × g for 30 minutes, and supernatant was obtained for the cytosolic fraction. 500 μg cytosolic fraction was immunopercipitated with 2μg/ml PKCδ antibody. Immunoprecipitates were washed with 2×kinase buffer and resuspended in 20μL of this same buffer. PKCδ phosphorylation was initiated by adding 20 μL of reaction buffer (0.4mg Histone H1, 50uL/mL phosphatidylserine, 4.1μM dioleolglycerol, and 5 μCi of [γ-32P]ATP) to the immunoprecipitates. After 10 minutes incubation at room temperature, samples were separated on 12% SDS-PAGE. Radioactive labeled histone H1 was detected using PhosphorImager system (Personal Molecular Imager, FX model, Bio-Rad) and analyzed with Quantity One 4.2.0 software (Bio-Rad).
1.13 Caspase enzymatic activity assay
Caspase-3 activity was measured using a specific fluorescent substrate, Ac-DEVD-AFC (caspase-3). Briefly, cells were lysed with lysis buffer (50mM Tris-HCl, 1mM EDTA, and 10mM EGTA) containing 10mM digitonin for 30 mins at 37 °C. Lysates were centrifuged at 10,000 × g for 5 mins and cell-free supernatants were collected. Supernatants were incubated with fluorogenic substrate Ac-DEVD-AFC for 2 hours at 37°C and fluorescence was measured with Gemini XS fluorescence plate reader (Molecular Devices) at excitation 400 nm and emission at 505 nm. Enzyme activity expressed as fluorescence units/mg protein/hr
1.14 Data analysis
Results are presented (PRISM software, GraphPad, San Diego) as fold induction as compared with vehicle treated group. Results represent mean ± S.E.M. Statistical analysis was performed by using one-way ANOVA followed by Student Newman Keuls post hoc test (PRISM software) in order to compare between groups. P values < 0.05 were considered significant.
2.0 RESULTS
2.1 MA induces a time-dependent increase in DNA fragmentation and intense cytoplasmic vacuolation in N27 dopaminergic cells
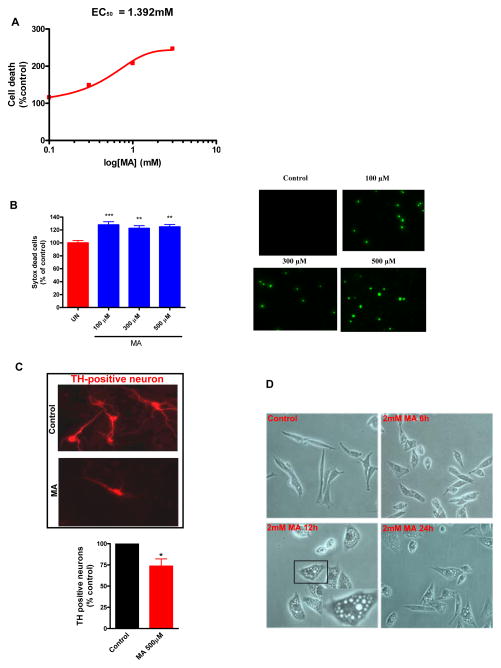
Previous studies from our group (Kanthasamy et al., 2006) and others (Deng et al., 2002b) have demonstrated that the N27 dopaminergic cell culture model can be effectively utilized for dissecting the cellular mechanisms underlying dopaminergic neurotoxicity. N27 cells were treated with increasing concentrations of MA (1–4 mM) for 24 h, and cell death was assessed by DNA fragmentation ELISA (Fig. 1A). Our results indicate that MA induced a significant increase in apoptotic cell death when N27 cells were exposed to higher concentrations of MA (1–2 mM) for 24h. Moreover, treatments with 1, 2, 3 and 4 mM MA for 24 h induced approximately 25, 32, 47 and 57% increases in DNA fragmentation, respectively. The EC50 value of 1.392 mM was deduced by three parameter nonlinear regression. Therefore, subsequent experiments to evaluate the cellular mechanisms underlying MA-induced cell death were carried out using either 1 or 2 mM MA over a 24h period, since these concentrations induced consistent autophagy and apoptotic cell death within a short period of exposure. To further validate the apoptotic nature of MA-induced cell death, we pretreated MA treated cells with 30 μM ZDEVD, a caspase-3 inhibitor. ZDEVD alone had no effect on cell death, while MA in combination with ZDEVD attenuated MA-induced dopaminergic cell death, confirming the caspase-3 dependent apoptotic cell death of dopaminergic cells following MA treatment (data not shown). Thus, consistent with previous studies (Shen et al., 2011;Wang et al., 2008) MA induced apoptotic cell death mediated via caspase-3 activation may play a critical role in MA induced neurotoxicity. Also, previous studies have demonstrated the occurrence of necrosis in a minor population of cells that were exposed to high concentrations of MA (Smith et al., 2007;Qi et al., 2011). As a result we have also used lower concentrations of MA in some key experiments to demonstrate the biological relevance of our study. As shown in Fig. 1B, measurement of cell death using the Sytox cell death assay revealed that exposure of N27 cells to low concentrations of MA (100–500 μM) for over 72h resulted in a significant increase in cell death as compared to controls, although no evidence of cell death was observed until 48h (data not shown). To further validate MA-induced dopaminergic neurotoxicity, we determined the intrinsic toxicity of MA by exposing ventral midbrain neurons to 0.5 mM MA for 1 week and quantified the extent of neuritic loss in TH+ neurons. Fig. 1C shows that MA causes significant reductions (~36%) in dopaminergic neurite lengths. We also characterized MA-induced morphological changes by phase contrast microscopy. Close inspection of MA-treated N27 cells under light microscope revealed a marked increase in cytoplasmic vacuoles as early as 6 h (Fig. 1D). The number and size of vacuoles increased over time. Our results show that the formation of autophagic vacuoles (AV) occurs prior to apoptotic cell death, suggesting that autophagy is an early cellular adaptive response to neurotoxic insult induced by MA in dopaminergic neuronal cells.
Figure 1. MA induces caspase-3 mediated DNA fragmentation and prominent cytoplasmic vacuolation in N27 dopaminergic cells.
Methamphetamine (MA) induced apoptotic cell death in N27 mesencephalic neuronal cells. (A) N27 cells were exposed to increasing concentrations of MA (0–3 mM) for 24h and quantification of the levels of histone-associated DNA fragmentation by ELISA. The EC50 value was 1.392 mM. (B) Exposure to low concentrations of MA (100–500 μM) elicited delayed cell death (72h). Cell death was assessed by immunofluorecence analysis of Sytox uptake (right panel) and quantification of Sytox uptake using a microplate reader (left panel). Data represent the mean ± SEM from at least six samples in each group. Statistical significance between the control group and each treatment group was determined by Student Newman Keul’s post-test (***p < 0.001; **p < 0.01 as compared with control group). (C) Dopaminergic neurons (TH+) were treated with MA or solvent. The bar graph represents quantification of the percentage of cells with neurite shortening in MA-treated cells as compared to control (*p < 0.05). (D) N27 cells were treated with MA (2 mM) for the indicated time period and representative images were obtained by phase contrast microscopy. Magnification, ×20; the inset shows the vacuoles at higher magnification. Midbrain neuronal cultures are vulnerable to MA-induced TH+ neurite shortening.
2.2 MA induces autophagic induction in dopaminergic neuronal cells
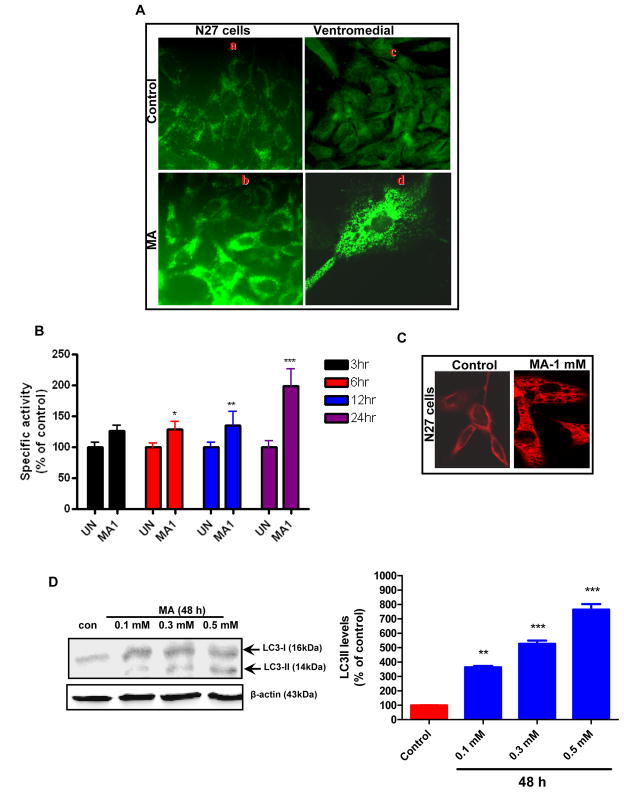
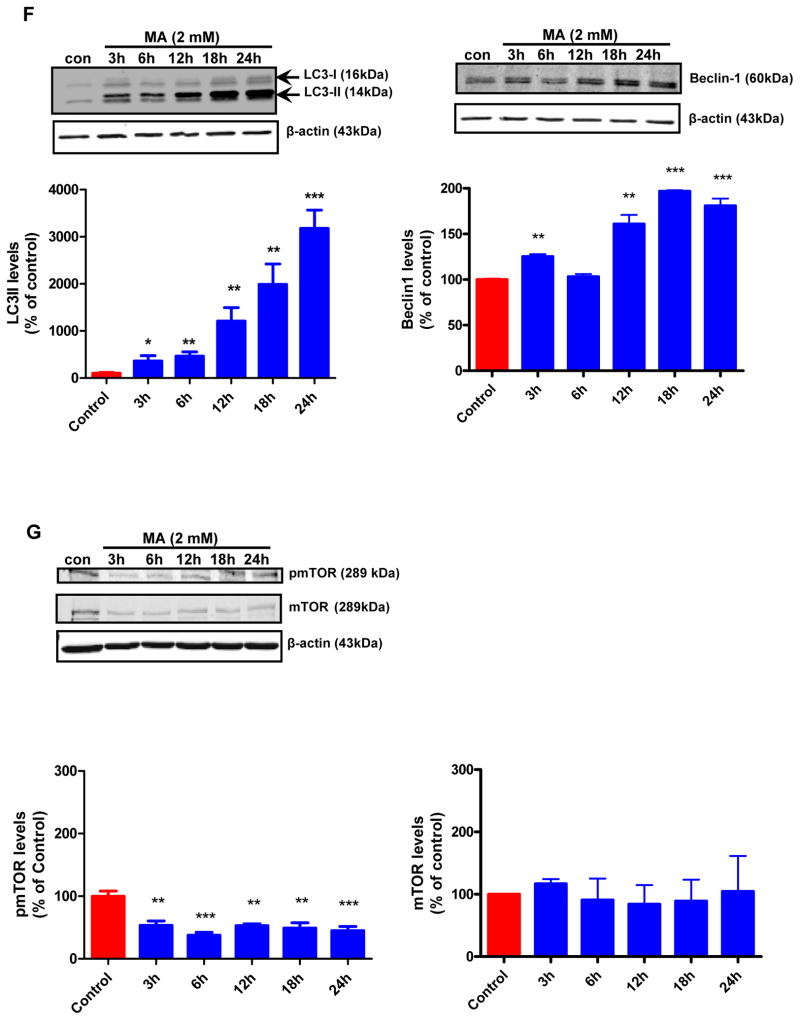
To further investigate the mechanisms of MA-induced autophagy, we examined autophagic vacuoles in MA-treated N27 cells and ventral midbrain cultures using fluorescence microscopy after staining with monodansylcadaverine (MDC), a fluorescent dye known to localize late autophagic vacuoles and lysosomes (L-AVs) but not endosomes (Munafo and Colombo, 2001). MA treatment resulted in the accumulation of MDC positive puncta, which were clearly visible in N27 cells (Fig. 2A, bottom panel). Primary mouse ventral midbrain cultures were treated with MA according to a previous study using a dose that induced neurite loss of TH immunoreactive dopaminergic neurons (Larsen et al., 2002) (Fig. 2A, bottom panel). MDC staining revealed that MA induced the appearance of punctuate structures in the cytoplasm of the cell body, indicative of autophagy. The control cultures displayed only a diffuse pattern of staining. Our immunofluorescence studies demonstrated the localization of autophagic vacuoles in the cell body of neurons. To quantify the magnitude of MA-induced autophagy, we analyzed the MDC fluorescent intensity of MA and vehicle treated cells using a fluorescence spectrophotometer. A time-dependent increase in MDC uptake indicative of AV formation was observed in MA-treated N27 cells but not in control cells (Fig. 2B). Time course experiments were performed to characterize the formation of AVs in MA-treated cells. An increase in the number of AVs was observed in MA-treated cells. Immunofluorescence analysis using anti-LC3 antibody indicated a punctuate pattern of staining in MA-treated cells, whereas a diffuse weak staining pattern was evident in vehicle-treated cells (Fig. 2C). A few punctuate structures were seen in some control cells. The Atg genes, involved in the formation of autophagosomes, include two ubiquitin-like conjugation systems: namely ATG12-Atg5 and Atg8/LC3-1 (Levine and Klionsky, 2004). Atg/LC3 is cleaved by Atg4 (autophagin) to produce the active cytosolic form LC3-I (18kDa), which is then subsequently activated by Atg7, and modified into the membrane bound active form LC3-II, which is conjugated with PE. Atg6 (its mammalian orthologue, Beclin-1) is a key regulator of autophagosome formation, and initiation of autophagy occurs through the class III PI3K pathway. We investigated the expression levels of LC3-I, LC3-II and Beclin-1 in N27 cells following treatment with MA (2 mM) for the indicated time period using the corresponding specific antibodies, as described in the Materials and Methods section. As shown in Fig. 2D, immunoblot analyses of proteins from MA-treated cells revealed a time-dependent increase in levels of LC3-I, LC3-II and Beclin-1. The modification of LC3-I to LC3-II was positively correlated with autophagic vacuole (AV) formation (Kabeya et al., 2000) and was observed as early as 3 hr post-treatment with 2 mM MA. More importantly, the total LC3 expression levels were higher when MA treatment was prolonged. The protein kinase mTOR has recently emerged as a negative regulator of autophagy (Iwamaru et al., 2007). To gain insight into the mechanism of MA-induced autophagy in our cell culture model, we determined the effect of MA treatment on the promotion of phosphorylation of mTOR (S2448) using N27 cells (Fig. 2E). We found that the levels of S2448-phosphorylated mTOR were decreased following treatment of N27 cells with MA; however, mTOR protein levels remained unchanged. This inhibition is positively correlated with the induction of autophagy, as revealed by increased protein levels of LC3-II, indicating that MA-induced autophagy may be mediated through inhibition of the mTOR kinase pathway.
Figure 2. MA induces autophagy in dopaminergic cells.
(A) Following treatment of N27 cells with 2 mM MA for 24 h or 0.5 mM for 1 week in the case of midbrain neurons, cells were stained with MDC and analyzed by fluorescence microscopy. A marked increase in MDC staining was evidenced in MA-treated cells. Note the MDC accumulation and characteristic punctuate pattern of staining by AVs compared to the diffuse MDC staining observed in vehicle-treated cells. (B) The accumulation of MDC positive vesicles in N27 dopaminergic cells was quantified by fluorometry and normalized to cell number and the data were presented as percent of control. MDC values represent mean ± S.E.M. from at least six individual measurements; *p<0.05, **p<0.01, p***<0.001 compared with control group. (C) N27 cells were treated with MA (1 mM) for a period of 24 h and then analyzed by immunofluorescence microscopy. 1 mM MA-treated cells show increased cytoplasmic vacuolization. Results are representative of at least four independent experiments performed in triplicate. (D) MA induced LC3-II cleavage and increase in Beclin-1 expression. Western blot analysis of cell lysates from N27 cells treated with MA (2 mM) for indicated time intervals using the corresponding antibodies. β-actin was used as loading control. Densitometric analysis of LC3 II levels and Beclin1 levels that were normalized with loading control (β-actin). Bars represent Mean ± SE. For each panel, results shown are representative of at least three independent experiments. Statistical analysis was carried out with ANOVA followed by Student Newman Keul’s t-test. * p < 0.05,** p < 0.01, *** p < 0.001 as compared with control (E) mTOR activity was assessed by determining mTOR phosphorylation levels. MA treated cells displayed a dramatic down regulation of pmTOR that paralleled increased LC3-II levels. However, mTOR levels remained unchanged. Densitometric analysis was used to quantify the density of the bands. The ratio of the respective bands to that of β-actin was determined and the data are expressed as percent of control.
2.3 MA induces ultrastructural features reminiscent of mitophagy in dopaminergic cells
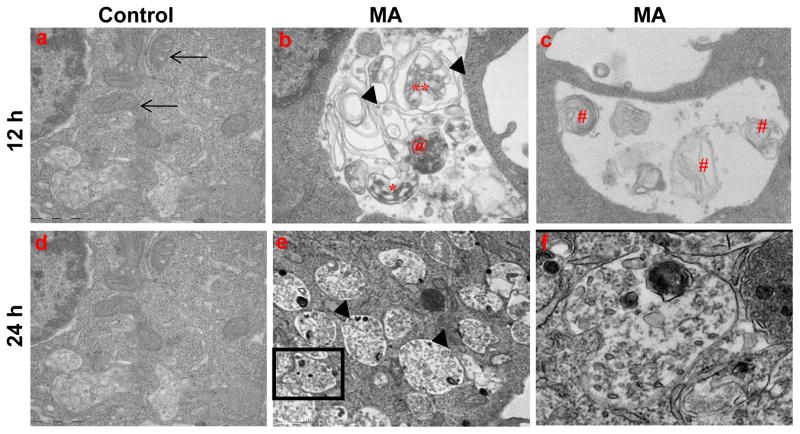
The ultrastructural evidence of MA-induced autophagy in N27 cells was examined by transmission electron microscopy to further characterize the autophagic vesicles. As shown in Fig. 3b, formation of AVs is distinct in MA-treated cells as compared to vehicle-treated cells. Several single and double membrane vesicles with densely packed amorphous materials were observed. Multilamellar structures with multiple small double membrane–bound AVs were found to be enclosed within a larger AV, indicative of a continual process of AV consolidation, attributed to fusion between vacuoles. Importantly, damaged mitochondria were frequently observed in AVs. The patterns of autophagic induction are consistent with results from previous studies in MPP+ (Zhu et al., 2006) and AD models (Boland et al., 2008) of neurodegeneration, in which electron dense double-membrane-limited AVs, containing partially digested cytoplasmic material in perikarya and neurites, and swollen disorganized mitochondria were markedly increased. Collectively, our EM studies revealed that MA induces formation of autophagic vacuoles, which include engulfment of damaged mitochondria, consistent with formation of mitophagy. Thus, induction of autophagic vacuoles may limit the deleterious effects of MA on key cellular organelles and thereby minimize the magnitude of MA-induced neurotoxicity.
Figure 3. Ultrastructural analysis reveals typical hallmarks of autophagy in MA-treated N27 cells.
Representative transmission electron microscopy images depicting ultrastructure of N27 cells treated with vehicle or MA (2 mM) for 12 or 24 h. (a) Numerous intact mitochondria are visible in the cytoplasm of control cells (arrows); (b) autophagosomes (asterisk); (c) MA-treated cells show swollen mitochondria with disorganized cristae (arrows); Autophagic vacuoles with double limiting membrane multilamellar structures and lamellar structures (#); enclose damaged organelles, and electron dense material; (e) Typical autolysosome (arrow head) that encloses partially degraded organelles and dense core bodies; (f) Boxed area shows higher magnification view of the autophagic vacuole containing proteinacous aggregates.
2.4 MA-induced perturbation of mitochondrial function in dopaminergic neuronal cells
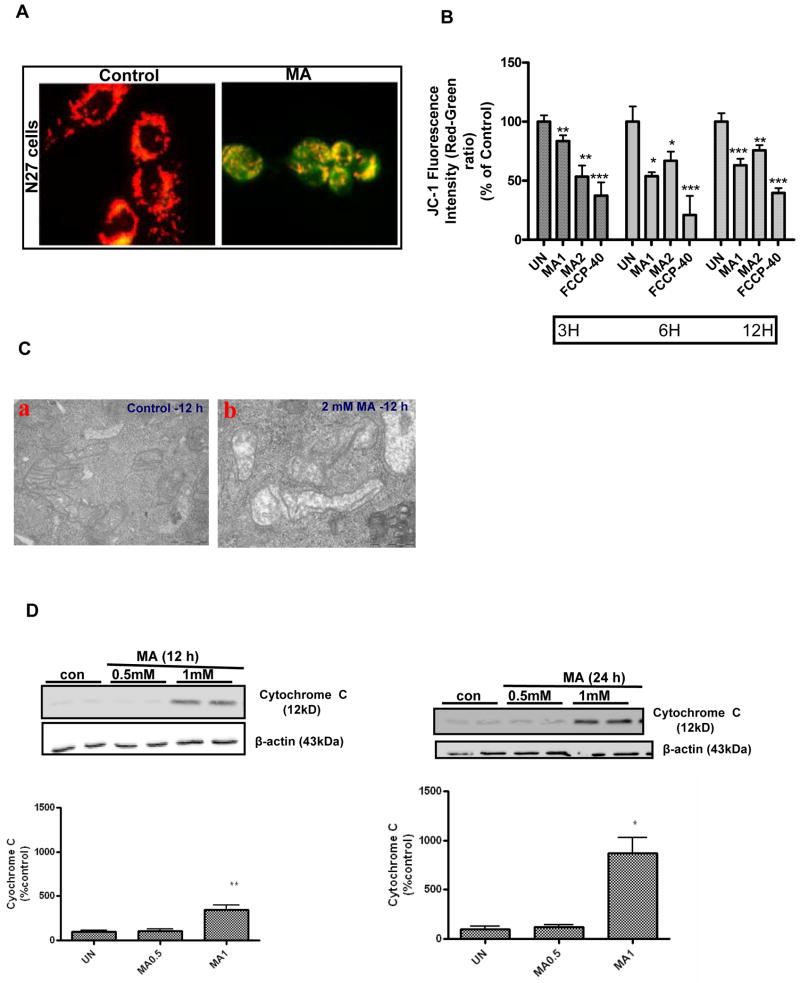
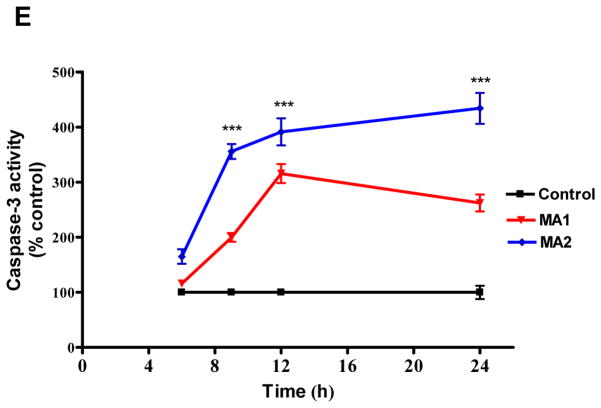
Autophagy plays a central role in the removal of damaged organelles, including mitochondria, by a process known as mitophagy (Jin, 2006;Priault et al., 2005). Since we observed pronounced mitophagy after MA treatment, we further investigated whether induction of mitophagy is associated with concomitant disruption of mitochondrial function. We examined the mitochondrial membrane potential following MA treatment using a lipophilic cationic dye, JC-1. As shown in Fig. 4A, examination of vehicle-treated control by fluorescence microscopy revealed bright orange punctuate staining in the cytoplasmic regions, consistent with the formation of JC-1 “J-aggregates” characteristic of actively respiring mitochondria. MA treatment (2 mM for 12h) produced a dramatic reduction in the intensity of orange red spots and predominance of green staining, consistent with loss of mitochondrial membrane potential (MMP). Analysis of MMP by spectrometry revealed a dose- and time-dependent decrease in mitochondrial membrane potential (MMP), evident as early as 3 h, with a ~50% reduction in mitochondrial membrane potential over 12 h post MA treatment (Fig. 4B). Interestingly, following MA treatment, induction of AVs coincided with collapsed MMP. As shown in Fig. 4C, panel b, ultrastructural analysis of changes in mitochondrial morphology in N27 cells exposed to MA revealed more rounded and swollen mitochondria with disrupted cristae as compared to vehicle-treated cells, in which mitochondria appeared as highly branched and tubular networks (Fig. 4C, panel a). Thus, our results show that the mitochondria damaged by MA treatment were sequestered within a double membrane vacuole, a process associated with mitophagy. The results of the MMP assays described above raise the question of whether disruption of MMP leads to the formation of MPT, resulting in the release of intermembrane proapoptotic factors such as cytochrome C, followed by the activation of the caspase-3 mediated downstream cell death executioner pathway. As shown in Fig. 4D–E, cells treated with MA (1 mM) exhibited a time-dependent gradual increase in cytochrome c release to the cytosol and increase in caspase-3 activity. Collectively, these observations indicate that dissipation of mitochondrial membrane potential, release of cytochrome c, and activation of caspase-3 precede MA-induced apoptotic cell death.
Figure 4. MA-induced dissipation of mitochondrial membrane potential and activation of mitochondria mediated downstream cell death signaling events.
(A) N27 cells were incubated in the presence or absence of MA (2 mM) for 12 h, and cells were stained with JC-1 and examined with fluorescence microscopy. Photomicrographs reveal predominantly punctuate red-orange fluorescence characteristic of JC-1 accumulation in normal respiring mitochondria, namely the PBS-treated cells (control), while MA treatment caused an increase in the cytoplasmic green fluorescence indicative of decreased mitochondrial membrane potential (MMP). Magnification = X60. Photomicrographs depicted are representative results from at least three independent experiments. (B) Time course studies of the impact of MA on MMP using JC-1 fluorometry. All assays were performed using a Gemini fluorescence plate reader. Increasing concentrations of MA (1 mM or 2 mM) were added to the wells at the indicated time points prior to incubation with JC-1 (30 min). Changes in membrane potential (ΔΨm) were determined spectrophotometrically. FCCP (40 μM) was used as a positive control. Bar graph values are representative of Mean ± SEM of quadruplicate samples repeated at least three times. Significance at *p<0.05, **p<0.01, p***<0.001 compared with the control group was determined by ANOVA followed by Student Newman Keul’s test. (C) A representative electron microscopic image depicting swollen and disorganized cristae in mitochondria within vacuoles in 2 mM MA-treated N27 cells for 12 h. (D) MA induces mitochondrial release of cytochrome c. N27 cells were treated with PBS (control) or MA (0.5 or 1 mM) for 12 and 24 h, respectively. Cytosolic fractions were isolated and analyzed for cytochrome c levels by immunoblotting using an anti-cytochrome c antibody. Densities of protein bands were analyzed with a Kodak imager and normalized to an internal loading control (β-actin). The data are expressed as percent of control. Bars represent mean +/− SE; N=4–6. Statistical analysis was carried out using Anova followed by Student Newman Keul’s post test; **p<0.01 MA-1 group vs control group (12h); *p<0.05 MA-1 vs control group (24h). (E) Caspase-3 activation. Caspase-3 activity was assayed in cells exposed to MA for 3, 6, 12 and 24 h. The activity was expressed as the percentage of vehicle treated cells. N = 6, ***p < 0.001 as compared to control.
2.5 MA induces proteolytic cleavage of PKCδ to promote apoptosis in dopaminergic cells
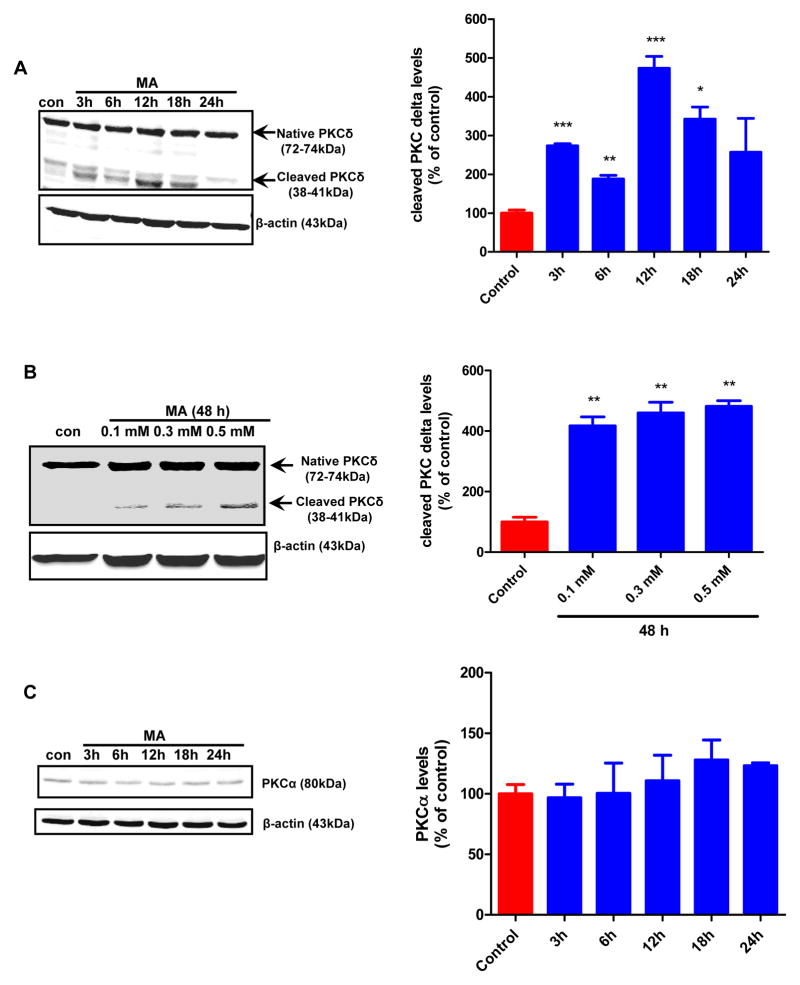
Previously we demonstrated that PKCδ is highly expressed in murine nigral dopaminergic neurons (Zhang et al., 2007). Importantly, the kinase can be proteolytically cleaved via a caspase-3 dependent mechanism, yielding a 38-kDa regulatory fragment and a 41 kDa catalytic fragment, which has been shown to persistently increase kinase activity during oxidative stress mediated dopaminergic neurodegeneration (Yang et al., 2004;Sun et al., 2008;Kaul et al., 2003). Since we observed a significant increase in caspase-3 activation (Fig. 4E), we sought to investigate whether PKCδ is proteolytically cleaved in N27 dopaminergic cells subsequent to MA (2 mM) treatment for 24h. Densitometric analysis revealed a time-dependent increase in PKCδ cleavage following 3, 6, 12, 18 and 24 h of exposure to MA (Fig. 5A). The maximal cleavage of PKCδ was observed 12 h after exposure to MA. The vehicle-treated cells showed only a basal level of PKCδ cleavage. Likewise, a significant (**p < 0.01) increase in PKCδ cleavage was evidenced in N27 cells that were treated with low concentrations of MA (0.1–0.5 mM) for 48h. In contrast, exposure to 2 mM MA failed to induce PKCα activation (Fig. 5C) suggesting that MA-induced proteolytic activation of PKCδ is isoform specific.
Figure 5. Caspase-3 mediated proteolytic cleavage of PKC delta in MA-induced neurotoxicity.
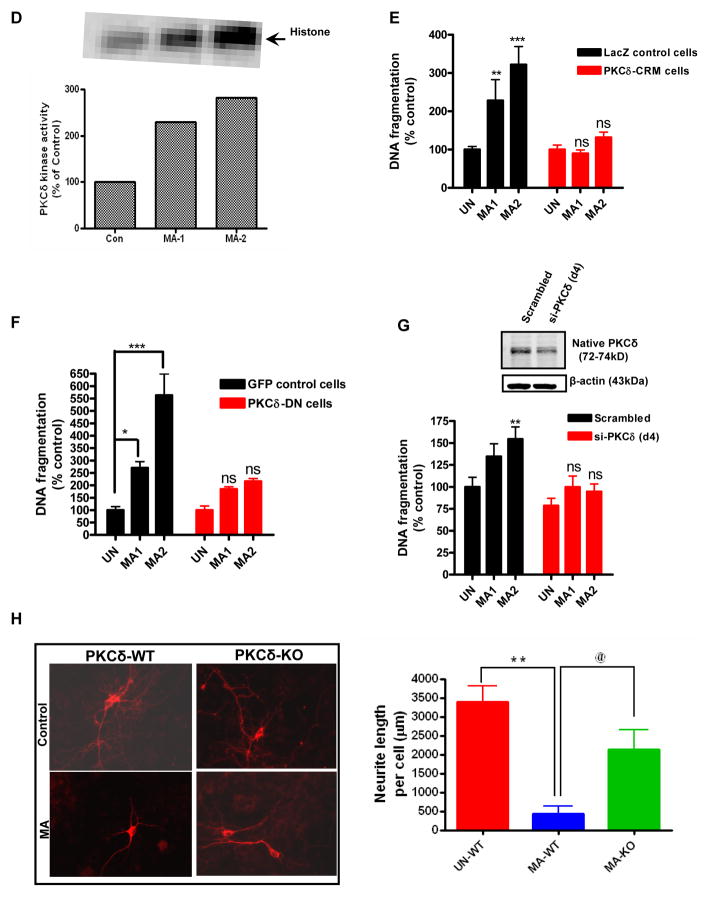
(A) PKCδ immunoblot analysis following MA treatment. N27 cells were treated with either 1 or 2 mM MA or PBS for increasing time periods (3–24 h), and proteins were resolved by SDS-PAGE and immunoblotted with PKCδ antibody to determine both native (72–74 kDa) and cleaved (38–41 kDa) bands. Immunoblot analysis showing time dependent increase in PKCδ cleavage in N27 cells following treatment with MA (2mM). Optical densities of protein bands were analyzed with the Odyssey imaging system (LI-COR) and normalized to an internal loading control (β-actin). The data are expressed as percent of control. Bars represent mean ± SE; N=4–6. Statistical analysis was carried out using Anova followed by Student Newman Keul’s post test. * p < 0.05,** p < 0.01, *** p < 0.001 as compared with control. (B) Subconfluent cultures of N27 cells were harvested at 18 h after MA treatment. Cell lysates were prepared and PKCδ was immunoprecipitated from treated cell lysates and the enzyme activity was measured by the extent of 32P phosphorylation. (C) Over expression of cleavage resistant PKCδ D327A protein attenuates MA-induced DNA fragmentation associated apoptosis. DNA fragmentation assay was performed in subconfluent cultures of N27 cells stably expressing the vector or PKCδ-CRM-V5 protein. Cells were treated with either 1 or 2 mM MA for 24 h and then DNA fragmentation was assessed by ELISA assay. The data represent mean +/− S.E.M. of at least four experiments. **p < 0.01, ***p < 0.001 indicates a significant difference between MA-treated LacZ vector cells and PBS-treated vector transfected (control) cells. (D) Effect of over expression of DN PKCδ mutant on MA-induced DNA fragmentation in N27 cells. Subconfluent cultures of DN PKCδ mutant N27 cells were harvested at 24 h following treatment with 1 or 2 mM MA, and DNA fragmentation was quantified using the ELISA kit. Data are presented as percentage of DNA fragmentation in MA-treated cells as compared with vehicle-treated control cells. *p < 0.05 and ***p < 0.001 indicate significant differences as compared with vehicle-treated cells. (E) Effect of siRNA mediated knockdown on MA-induced DNA fragmentation at 24h following treatment with 1 or 2 mM, and DNA fragmentation was quantified using the ELISA kit. Data are presented as percentage of DNA fragmentation in MA treated cells as compared with vehicle treated cells. (F) Midbrain mesencephalic PKCδ-KO cultures are resistant to MA-induced neurite shortening. Dopaminergic neurons (TH+ cells) from PKCδ-WT and PKCδ-KO cultures treated with MA (0.67 mM for 1 week) or solvent. Immunofluorescence images of control and MA-treated cultures, which are labeled for TH (red). Quantitative image analysis of MA treated PKCδ WT neurons reveals dramatic reductions (~80%) in dopaminergic neurite lengths as compared with UN-WT (vehicle treated cells; ** p < 0.01); while PKCδ KO conferred significant (@ p < 0.05 as compared to MA-WT) resistance against MA-induced neurite loss.
To assess the effect of PKCδ proteolytic cleavage on its kinase activity, PKCδ was immunoprecipitated from cell lysates and kinase activity was assessed using [32P]-ATP and histone H1 substrate. Analysis of the intensity of radioactively labeled H1 bands revealed that MA exposure results in ~ 300% increase in PKCδ kinase activity (Fig. 5D).
We next sought to address the direct effects of PKCδ on MA-induced apoptosis. For this purpose we used a genetic approach involving over expression of a catalytically inactive dominant negative PKCδK376R (PKCδ-DN) mutant and caspase cleavage resistant mutant PKCδD327A (CRM-mutant) in which aspartate at position 327 is mutated to alanine. N27 cells stably expressing the V5-CRM-fusion protein were generated by using a lentiviral vector that is tagged with the V5 epitope. N27 cells stably expressing V5-LacZ were used as a control. The extent of DNA fragmentation was compared between WT and genetically altered PKCδ cells to determine the exact contribution of PKCδ in MA-induced apoptosis. As shown in Fig. 5E–F, MA induced apoptosis in LacZ expressing N27 control cells, whereas the MA-induced DNA fragmentation was almost completely blocked in both PKCδ CRM expressing cells and PKCδ DN expressing cells. To confirm the functional role of PKCδ in MA-induced cell death, we examined the effect of PKCδ siRNA on MA-induced DNA fragmentation. Western blot analysis revealed that the protein levels of PKCδ were suppressed by >60% in PKCδ transfected cells (Fig. 5E). Exposure to MA (1 or 2 mM) for 24 h induced 2–3-fold increases in DNA fragmentation in negative control siRNA transfected cells (scrambled), while MA-induced DNA fragmentation was reduced in PKCδ-siRNA transfected N27 dopaminergic neuronal cells (Fig. 5G). To further validate the results obtained in N27 dopaminergic cells to primary dopaminergic neurons, we compared the neurotoxic effect of MA in primary mesencephalic cultures obtained from PKCδ wild type and PKCδ knock out (PKCδ-KO) mice. As shown in Fig. 5H, treatment with MA (0.65 μM) for 1 week reduced neurite lengths in tyrosine hydroxylase immunoreactive mesencephalic neurons and in WT primary neurons, while PKCδ-KO cultures showed resistance against neurite loss induced by MA. Together, these results clearly demonstrate that PKCδ plays a key proapoptotic function in MA-induced dopaminergic cell death.
2.6 Impaired ubiquitin proteasome system (UPS) and autolysosomal system (ALS) in MA-induced accumulation of ubiquitin (Ub) positive protein aggregates
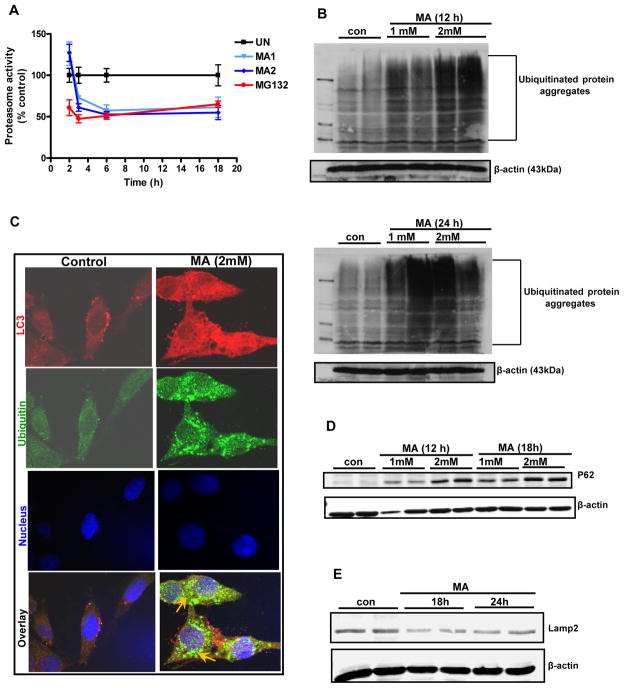
Recent studies suggest that proteasomal inhibition promotes induction of autophagy (Du et al., 2009;Janen et al., 2010;Pan et al., 2008b). Our microscopic analysis of MA-treated cells revealed the colocalization of ubiquitin and LC3, suggesting a cross talk between UPS and ALS. Therefore, we investigated whether dysfunction of ALS during MA treatment is attributable to impaired clearance of ubiquitinylated aggregates resulting from proteasome inhibition. Therefore, we examined the effects of MA on proteasomal activity. As shown in Fig. 6A, a dose- and time-dependent decrease in proteasomal activity in N27 dopaminergic neuronal cells was observed following exposure to MA. Treatment with 1–2 mM MA for 12 or 24 h caused a significant reduction in proteasomal activity. A detailed time course analysis was performed to determine the earliest time point at which MA impairs proteasomal activity. Proteasomal activity was reduced as early as 2 h following drug treatment, and it remained reduced during the entire treatment period (Fig. 6A).
Figure 6. Impaired UPS and ALS in MA-induced accumulation of ubiquitin positive protein aggregates.
(A) Proteasomal activity was assayed by determining Suc-Leu-Val-Tyr-AMC (chymotrypsin-like activity) cleavage in N27 cells. (B) Effect of MA treatment on polyubiquitination. Following treatment with increasing concentrations of MA (1 mM or 2 mM) for 12 or 24 h, ubiquitin (Ub) buildup was detected when cell lysates were separated by SDS-PAGE and the extent of protein ubiquitination was assessed by Western blotting with an anti-ubiquitin antibody. Time-dependent increase in Ub accumulation is observed after MA treatment as compared to vehicle-treated cells. (C) Formation of ubiquitin and LC-3 positive aggregates in MA-treated N27 cells. Confocal immunofluorescence analysis of Ub and LC-3. Representative microscopic images of N27 cells co-stained for Ub protein and LC3 following MA treatment. Vehicle-treated cells show uniform staining while MA-treated cells (2 mM for 24 h) display increased accumulation of Ub. Arrows indicate Ub positive aggregates that co-localize with LC3 after MA treatment. Hoechst staining was used to visualize nuclei (blue). (D) Western blot analysis reveals increased levels of an LC3 binding autophagy substrate, p62, in Triton-X-100 insoluble fraction isolated from N27 cells exposed to MA (2 mM). (E) Reduced levels of Lamp-2A are observed following MA (2mM) treatment.
We and others have shown that inhibition of proteasomal machinery by classic proteasome inhibitors leads to accumulation of ubiquitinated proteins in the cytosol and organelles, indicative of inefficient clearance of damaged proteins by the proteasome (Rideout and Stefanis, 2002;Sun et al., 2009). We observed accumulation of high molecular weight (HMW) ubiquitin protein conjugates in the detergent insoluble fractions of N27 cells following 12 and 24 h of MA (2mM) exposure (Fig. 6B). The results suggest that MA induces a time- and dose-dependent increase in insoluble HMW ubiquitin conjugates in N27 cells. The primary target of MA remains unclear; however, an emerging body of evidence suggests that this compound’s diverse effects may include UPS dysfunction and autophagic induction (Castino et al., 2008b;Pasquali et al., 2008). To further determine the relationship between autophagy induction and accumulation of aggregated proteins, we studied the extent of ubiquitin and LC3 colocalization. Vehicle treated cells showed diffuse LC3 distribution, whereas a punctuate pattern was observed in MA treated cells (Fig. 6C), indicating induction of autophagy. Similarly, immunofluorescent staining for ubiquitin showed a diffuse pattern in the cytoplasm of vehicle-treated cells, while pronounced aggregation was observed in MA-treated cells coincident with a close overlap with the punctuate pattern of LC3. A dramatic increase in the buildup of ubiquitin positive aggregates that also colocalized with LC3 was evident at 24 h (Fig. 6C), indicating crosstalk between UPS and the autophagic system in MA-induced dopaminergic neurodegeneration. ATG 5 or ATG 7 deficient mice have previously been demonstrated to exhibit deficits in motor function accompanied by accumulation of p62 containing UB positive aggregates (Hara et al., 2006;Komatsu et al., 2006;Komatsu et al., 2007a). Furthermore, a recent study (Korolchuk et al., 2009a) demonstrated that excessive accumulation of p62 might be attributed to reduced autophagic clearance of aggregate prone proteins. Since a positive correlation exists between ubiquitin positive aggregates and p62 during autophagy (Hara et al., 2006;Komatsu et al., 2006;Komatsu et al., 2007a), we further determined the p62 levels in MA-treated cells. As shown in Fig. 6D, we found that p62 was dramatically elevated in a dose-dependent fashion in cells exposed to MA. These results suggest that compromise of autophagic function, presumably via excessive accumulation of ubiquitin containing protein aggregates, may contribute to MA-induced dopaminergic neurodegeneration. As lysosomes are essential for the degradation of autophagosomal content, we further examined if MA treatment modulates the lysosomal machinery. After MA treatment for 18 or 24 h in N27 dopaminergic cells, Western blot analysis revealed a greatly reduced immunoreactivity of Lamp-2, consistent with reduced autolysosomal formation. Taken together, our findings support that MA-induced autophagy is associated with accumulation of ubiquitinated aggregates resulting from UPS dysfunction.
2.7 Suppression of PKCδ proteolytic activation inhibited MA-induced UPS dysfunction and deregulation of proteasomal function
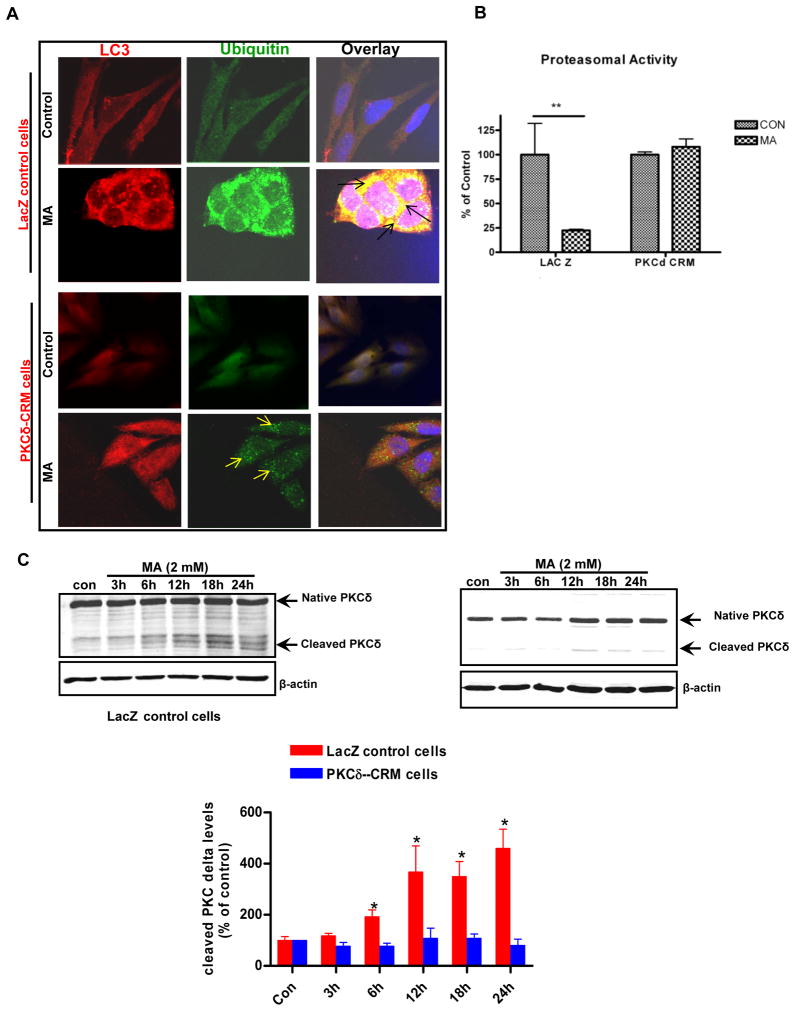
After establishing that MA induces both proteolytic cleavage of PKCδ and apoptosis in N27 cells accompanied by profound ALS dysfunction, we next sought to investigate the potential role of PKCδ in mediating UPS dysfunction. Previous studies from our lab suggest that PKCδ plays a very important role in regulating UPS dysfunction associated apoptosis (Sun et al., 2008). First, we assessed the effect of PKCδ cleavage resistant mutant (PKCδD327A-PKCδ CRM) on MA-induced UPS dysfunction. PKCδ-CRM expressing and LacZ control N27 cells were exposed to MA for 18 h and then key markers of UPS function were measured. MA induced massive accumulation of ubiquitin positive aggregates in LacZ control cells; however, PKCδ CRM expressing cells were more resistant to MA-induced accumulation of ubiquitin positive aggregates (Fig. 7A), which was accompanied by a concordant abrogation of MA-induced proteasomal dysfunction (Fig. 7B). As expected, PKCδ levels were maximally elevated from 12h to 18h after MA administration in LacZ control cells, but not in PKCδ-CRM cells, as assessed by Western blot analysis (Fig. 7C). Together, these results demonstrate that proteolytic activation of PKCδ regulates UPS function and contributes to MA-induced excessive accumulation of ubiquitin positive aggregates, which ultimately results in mitochondria mediated apoptotic cell death.
Figure 7. Suppression of PKCδ proteolytic activation inhibited MA-induced UPS dysfunction and deregulation of proteasomal function.
(A) Confocal immunofluorescence analysis of Ub and LC3 co-localization in N27 cells overexpressing cleavage resistant mutant of PKCδ. N27 cells expressing the empty vector (control) or cells over expressing the CRM mutant were exposed to MA or PBS and then expression of ubiquitin (Ub) and LC-3 was determined by immunostaining. Representative microscopic images of N27 cells co-stained for Ub protein and LC3 following MA treatment. MA treatment in vector transfected cells results in pronounced accumulation of ubiquitin positive aggregates, while CRM cells exposed to MA showed diminished accumulation of ubiquitin positive aggregates. Arrows indicate reduced accumulation of ubiquitin positive aggregates, indicative of improved clearance of Ub positive aggregates after MA treatment in PKCδ CRM cells. (B) Chymotrypsin like proteasomal activity was assessed as described in the methods. Reversal of MA-induced reduction in chymotrypsin activity in PKCδ CRM cells was observed. The data represent mean ± S.E.M., n = 6; the groups were significantly different (**p < 0.01) as determined by one-way ANOVA followed by Newman-Keul’s test. (C) Suppression of PKCδ proteolytic cleavage in PKCδ-CRM cells. N27 cells stably transfected with LacZ (control) and PKCδ-CRM were treated with 2 mM MA for (3–24h) and then harvested for Western blot analysis. The PKCδ cleavage levels are expressed graphically. Values are means ± S.E.M of results obtained from three independent experiments. Statistical difference between control and MA treated groups was determined by ANOVA. Asterisks (*p < 0.05) indicate significant difference as compared with the controls cells that were transfected LacZ.
2.8 PKCδ participates in the regulation of MA-induced autophagy
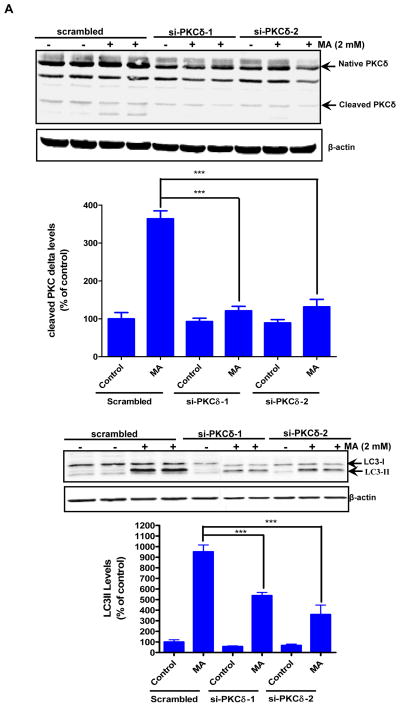
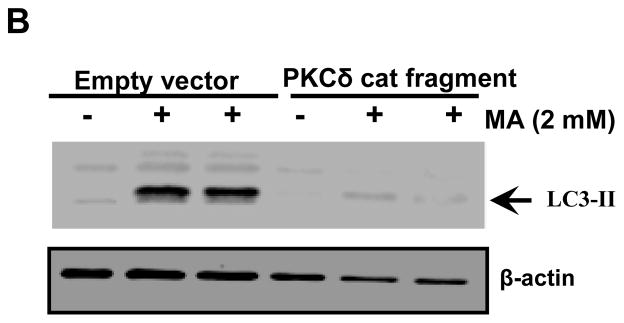
An increasing number of studies have demonstrated that rottlerin itself may have toxic effects (Soltoff, 2001;Liao et al., 2005;Song et al., 2008). Based on these studies, siRNA-mediated down regulation of PKCδ was used to determine the contribution of PKCδ to MA-induced autophagy. Specifically, the effect of PKCδ knockdown by siRNA on autophagic marker LC3-II processing was examined. In order to minimize potential off-target effects of siRNA, we utilized siRNAs that were targeted to two different regions within the PKCδ mRNA (si-PKCδ-1 and si-PKCδ-2). Expression of PKCδ parent band was dramatically reduced in the PKCδ siRNA transfected cells (Fig. 8A). Similarly, the processing of cleaved fragments in response to MA was completely attenuated in the PKCδ siRNA transfected cells but not in cells that were transfected with the scrambled siRNA (Fig. 8A, top panel). Importantly, MA-induced conversion of LC3-I to LC-II was significantly reduced in cells transfected with PKCδ siRNAs as compared to control siRNA transfected cells (Fig. 8A bottom panel). Based on the down regulation of LC3-II via PKCδ siRNA and a previous report on the effect of PKCδ on LC3-II levels (Chen et al., 2009) we propose that over expression of persistently active PKCδ catalytic fragment prior to MA treatment will bypass the protective response associated with induction of autophagy and commit the cells irreversibly to death. To study this, we used forced expression of HA-tagged PKCδ catalytic fragment (HA-PKCδ-CF-2 μg) in N27 cells. Twenty four hours post-transfection, the cells were exposed to MA for an additional 18 h. As compared to mock transfection, the transient expression of PKCδ catalytic fragment reversed the MA-induced increase in LC3-II levels (Fig. 8B). Based on these studies, we conclude that MA-induced increase in LC3-II levels is at least partly mediated via PKCδ and that elevated levels of catalytically active PKCδ commit the cells irreversibly to cell death by bypassing the adaptive autophagy survival step in MA-induced neurodegeneration.
Figure 8. Effects of PKCδ knockdown on MA-induced upregulation of autophagy.
(A) Cells were transfected with either scrambled (control) or the indicated siRNAs, and 24 h later cells were exposed to MA for another 18 h. Western blot analysis of whole cell lysates was utilized to monitor for LC3 conversion, PKCδ native band, and cleaved fragments. B and intensities were calculated as percentage of control. Bars represent mean ± S.E. of at least three independent experiments. Statistical analysis was carried out with ANOVA followed by Student Newman Keul’s t-test. * p < 0.05,** p < 0.01, *** p < 0.001 as compared with control. (B) Western blot analysis of LC3-II levels in N27 cells transfected with HA-PKCδ catalytic fragment or control plasmid. Cells were exposed to MA for 18 h post transfection for 24 h.
2.9 Modulation of MA-induced autophagy altered MA-induced apoptotic cell death in N27 cells
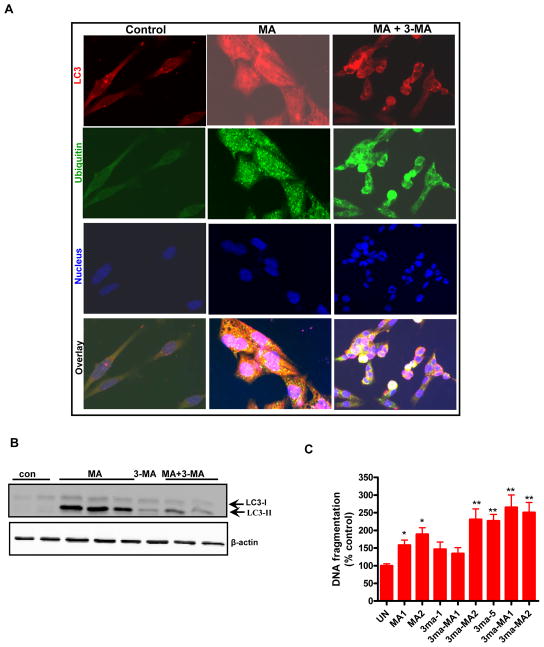
Previous studies suggest considerable crosstalk between autophagy and apoptosis (Yousefi et al., 2006;Maiuri et al., 2010a;Djavaheri-Mergny et al., 2010), such that cellular responses can be subjected to tight regulation in a stress specific manner. Therefore, we examined the functional link between autophagy and apoptosis during MA treatment and determined to what extent they regulate cell death during neurotoxic insult. Autophagy represents a protective mechanism against starvation-induced cell death (Galluzzi et al., 2008). On the contrary up regulation of Beclin-1 has been shown to contribute to autophagy-like cell death during ischemia-induced brain injury (Rami et al., 2008). Herein, we examined the role of autophagy in MA-induced apoptosis using the autophagy inhibitor 3-MA (3-methyladenine). To investigate the contribution of autophagy in MA-induced apoptosis in N27 cells, we pretreated cells with 3-MA, a class III PI3K/Vps-34 inhibitor that targets the early stage of autophagosome formation. 3-MA dramatically reduced MA-induced LC3-II accumulation in N27 cells (Fig. 9A), suggesting the critical role of the PI3K/Vps-34 signaling pathway in the formation of double membrane vacuoles in MA-treated dopaminergic cells. To quantify the effects of autophagy inhibition, we further utilized WB analysis. The results show a considerable reduction in LC3-II levels in 3-MA-pretreated MA-treated cells as compared to MA alone treated cells (Fig. 9B).
Figure 9. The relationship between autophagy and apoptosis in MA-treated dopaminergic neuronal cells.
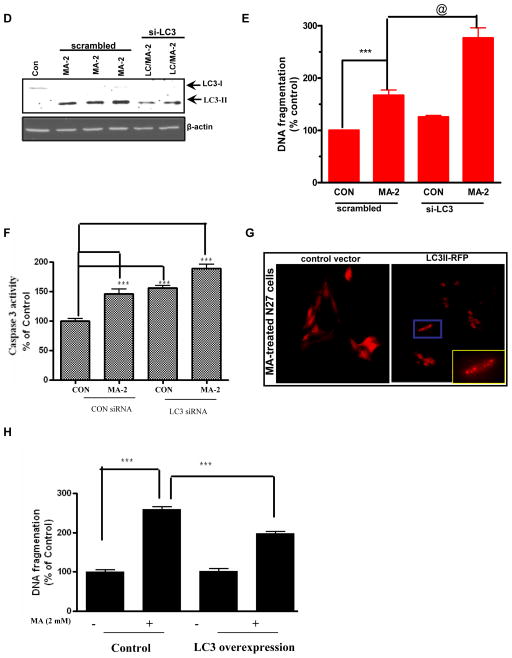
(A) Cells were either treated with 2 mM MA or pretreated with 3-MA (5 mM) for 1 h prior to MA treatment for another 12 h. Double labeling immunofluorescence analysis revealed that in contrast to MA-treated cells, an excessive buildup of Ub positive protein aggregates appears in 3MA/MA-2 mM treated cells, and several cells displayed characteristics of apoptosis, including cell shrinkage. An almost complete absence of LC3 immunostaining was observed in 3-MA/MA-2 treated cells at the end of 12 h. (B) Effect of 3-MA on MA-induced LC3-II cleavage. N27 cells were treated with MA with or without 3-MA (10 mM) for 18 h and then LC3-II immunoblot was performed as described in the methods section. To confirm equal protein loading, β-actin was used as a loading control. (C) 24 h following drug treatment, the extent of histone associated DNA fragments was detected by cell death detection ELISA methodology, as described in the Materials and Methods. The results are expressed as percentage of control. Data are the mean ± SEM (n=4). **p < 0.01 as compared with control. (D) The cells were transfected with MAP LC-3, or control siRNA for 48 h, followed by treatment with 2 mM MA for another 24 h, and LC-3 levels were determined by Western blot analysis. A dramatic reduction in LC-3 levels was observed in LC-3 siRNA transfected cells exposed to MA as compared to that of control. (E) Cell death was determined using an ELISA kit for DNA fragmentation after N27 cells were exposed to MA for 24 h. The results are expressed as percentage of control. Data are the mean +/− SEM (n=4). ***p < 0.001 as compared to control; @ p < 0.05 as compared to MA treated cells. (F) The knockdown of LC3 potentiates MA-induced caspase 3 activaiton. The siRNA knockdown conditions were identical as described above. Quantification of caspase 3 activation shows that MA-2 treatment potentiates caspase 3 activation in LC3 siRNA trasfected cells as compared to control cells that were transfected with a scrambled sequence. G) Subconfluent cultures of N27 cells transiently expressing the LacZ vector or LC3-II RFP protein were treated with 2 mM MA for 24 h and then photomicrographs were collected. A punctuate pattern of distribution of LC3 is evidenced in MA-treated LC3 over expressing cells. (H) DNA fragmentation was assessed by ELISA assay. Significant (p < 0.001 as compared to MA treated control cells) attenuation of MA-induced DNA fragmentation in N27 cells overexpressing LC3 as compared to control cells expressing the empty vector. The data represent mean ± S.E.M. of four to eight individual measurements. ***p < 0.001 indicates a significant difference between MA-treated LC3 over expressing cells and MA-treated LacZ vector control cells.
Furthermore, the magnitude of MA-induced apoptosis in the presence of 3-MA was evaluated by DNA fragmentation ELISA analysis. As shown in Fig. 9C, inhibition of autophagy increased the magnitude of MA-induced DNA fragmentation in N27 cells. To further confirm the results of pharmacological inhibitors, the RNAi approach was used. Consistent with the 3-MA results, the genetic silencing of LC3-II, followed by MA treatment showed near complete reductions in LC3-II levels as assessed by WB analysis (Fig. 9D). Subsequently, we determined the effect of LC3 knockdown on MA-induced apoptotic cell death. As expected, MA treatment of N27 cells transfected with the scrambled sequence increased DNA fragmentation and caspase-3 activation, whereas MA combined with the autophagy targeted siRNA sequences (LC3) resulted in further accentuation (p < 0.001, Fig. 9E) of MA-induced DNA fragmentation and caspase-3 activation (Fig. 9E–F). Also, cells that received only the siRNA sequence targeting LC3-II exerted a little effect on cell viability. Taken together our results suggest that inhibition of autophagy augments apoptosis.
To further substantiate that LC3 induction is primarily responsible for the protective response against MA-induced neurodegeneration, we transfected the neurons with plasmid encoding LC3 RFP fusion protein (3 μg) and then examined MA-induced autophagosome production. Transient transfection of LC3-RFP into neurons demonstrates that the fluorescence pattern shows a diffuse pattern of distribution in vehicle-treated cells. However, the extent of punctuate structures was dramatically increased in MA (2 mM)-treated cells for 18 h (Fig. 9G). Furthermore, transient transfection of N27 cells with pCMV-myc-LC3 plasmid conferred partial protection against MA-induced increase in DNA fragmentation over empty vector transfected control N27 cells (Fig. 9H). Thus, our LC3 over expression strategy to assess apoptosis supports our central hypothesis that early induction of autophagy may represent a neuroprotective response against MA-induced neurodegeneration.
2.10 MA treatment causes autophagy, ubiquitin accumulation and proteolytic cleavage of PKCδ in an animal model of methamphetamine neurotoxicity
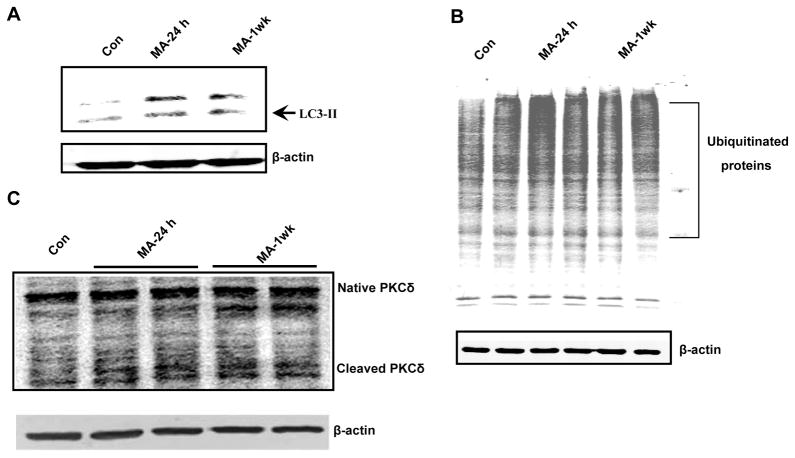
We have demonstrated that MA inhibits ALS accompanied by increased apoptosis and UPS dysfunction in vitro. We further extend our key in vitro observations to an animal model of MA neurotoxicity. To this end, we exposed rats to MA (4 × 20 mg/kg; 2 h intervals, i.p.) and the striatal tissue was harvested at the indicated time points (24 h and 1 week after the last dose of MA). As shown in Fig. 10A–B, MA treatment increased accumulation of LC3 and ubiquitinated protein in the striatum of MA-treated rats both at 1 day and 7 days post-MA treatment, whereas baseline levels of LC3 and ubiquitinated aggregates were observed in saline treated animals. Furthermore, MA-treated striatal tissue also showed cleaved PKCδ (Fig. 10C), indicative of pro-apoptotic activation of the kinase. Also, depletion of dopamine transporter (DAT) was observed in rats exposed to a chronic regimen of MA (data not shown). Taken together, MA-induced accumulation of Ub positive aggregates, increased autophagy and increased proteolytic cleavage of key proapoptotic PKCδ in an animal model suggest in vivo relevance of our finding.
Figure 10. MA-induced dopaminergic degeneration is accompanied by activation of autophagy and accumulation of Ub positive substrates.
Rats were treated with MA (20 mg/kg × 4 at 2 h intervals) and sacrificed at the indicated time periods: 24 h and 1 week after drug administration. (A) Striata were dissected for the preparation of cell lysates. Protein levels of LC3 were determined with immunoblotting. Western blot analysis showing LC3-I (18 kDa) and LC3-II (15 kDa) levels in the striatum at 24 h and 1 week after MA exposure. The increased shift of LC3-I to LC3-II is indicative of marked activation of an autophagic pathway in MA-treated brains. (B) Immunoblots of ubiquitinated proteins in Triton-x-100-insoluble fraction. Striatal tissues were obtained from vehicle or MA treated subjects at 24 h and 1 week following drug treatment. Triton-x-100-insoluble fractions were immunoblotted with anti-ub proteins. (C) Formation of proteolytic products of PKCδ was examined in the striatum using Western blot analysis at 24 h and 1week time points following drug administration.
3.0 DISCUSSION
In our previous study, we demonstrated induction of autophagy in N27 dopaminergic cells following MA treatment (Kanthasamy et al., 2006). The present study reveals the mechanisms underlying MA-induced cell death and the functional relationship between autophagy and apoptosis in MA neurotoxicity. MA-induced apoptotic cell death was characterized by mitochondrial dysfunction, cytochrome c release, caspase-3 activation, proteolytic cleavage of PKC delta and DNA fragmentation. The time courses and dose range of MA used in our study are consistent with previous studies using cell culture models of MA-induced neurodegeneration Moreover, MA robustly upregulated autophagy, and MA-induced loss of mitochondrial membrane potential was closely associated with induction of mitophagy, a mechanism that is closely connected with the clearance of mitochondria by autophagy (Deng et al., 2002a;Krasnova and Cadet, 2009;Pan et al., 2008c). At lower concentrations; however, we observed a delayed occurrence of cell death that was preceded by proteolytic cleavage of PKC™ and LC3-II induction (Fig 1B and Fig 2D.). Although the exact mechanism underlying the delayed cell death evidenced during exposure to low concentrations of MA is presently unknown, cellular compensatory mechanisms may have contributed to the delayed neurotoxicity. In this regard, we recently observed a novel compensatory response mediated by PKC™ via activation of an antiapoptotic kinase, protein kinase D1 (PKD1), during early stages of oxidative insult induced dopaminergic cell death (Asaithambi et al., 2011). Furthermore, we demonstrated that the early proteolytic activation of PKC™ phosphorylates the PKD1 activation loop to initiate the compensatory protective response during the early stages of oxidative insult, but the persistent and pronounced proteolytic cleavage that occurs during prolonged oxidative stress overrides the protective response, leading to apoptotic cell death. Since oxidative stress plays an important role in MA neurotoxicity, it is likely that such a compensatory mechanism plays a role in the neurotoxicity. In support of this view, our results show a time dependent increase in PKC™ proteolytic cleavage during methamphetamine treatment (Fig 5B). Moreover, our results are supportive of an adaptive neuroprotective role for autophagy in MA-induced neurotoxicity because treatment with autophagy inhibitors or siRNA silencing directed against LC3 augmented cell death. Interestingly, a concomitant deregulation of UPS function, as evidenced by dramatic reduction in chymotrypsin activity and accumulation of ubiquitinated proteins that colocalized with LC3 were observed. Furthermore, enhanced depletion of Lamp-2 suggests that inefficient clearance of ubiquitinated aggregates may be one of the mechanisms mediating neurotoxicity. Intriguingly, over expression of a cleavage resistant mutant of PKCδ ameliorated MA-induced UPS dysfunction and afforded neuroprotection. Importantly, striatum obtained from MA treated rats also recapitulate the results obtained in our in vitro cell culture model. Taken together, our results, for the first time, demonstrate that proteolytic activation of PKCδ plays a critical role in mediating MA-induced neurotoxicity by regulating UPS function and autophagy. We also show that excessive accumulation of ubiquitin positive protein aggregates and formation of autophagosomes are key features of MA neurotoxicity.
A growing body of evidence suggests that malfunction of the UPS, resulting in failure to degrade misfolded proteins and associated disruption in cell function also known as proteotoxicity, may play a central role in the etiopathogenesis of PD as well as other neurodegenerative disorders (Olanow and McNaught, 2006;Soto and Estrada, 2008;Betarbet et al., 2002). Notably, ubiquitin positive aggregates have been reported to form in neurons following MA treatment. A recent study (Moszczynska and Yamamoto, 2011) in a rat model of MA- induced neurotoxicity showed that proteasomal dysfunction may precede MA neurotoxicity. Moreover, other studies (Fornai et al., 2004;Fornai et al., 2003) demonstrated cell death and excessive accumulation of protein aggregates in the substantia nigra of MA-treated rats. However, the exact contribution of proapoptotic factors in the induction of UPS dysfunction remains poorly characterized. In the present study, we clearly demonstrate that MA-induced proteolytic activation of PKCδ may be critically linked to UPS and ALS dysfunction (Fig. 6), which in turn promotes dopaminergic neuronal demise. Previously, we have shown that nigral dopaminergic neurons are more vulnerable than non-dopaminergic neurons following intra-nigral injection of MG-132, a proteasome inhibitor (Sun et al., 2006). Furthermore, proteasome inhibition was found to activate the apoptotic mitochondrial cascade via the accumulation of polyubiquitinated proteins in the mitochondria (Sun et al., 2009). Consistent with these reports, our present study demonstrates concurrent reduction of proteasomal activity and mitochondrial membrane potential following exposure to MA (40–50%, Fig. 6A and Fig. 4B). These data suggest that MA-induced neuronal degeneration may induce an apoptotic cell death pathway via dissipation of MMP, cytochrome c release and caspase-3 activation. In fact, the excessive accumulation of protein aggregates has been shown to induce stress response, inhibit protein synthesis, and activate programmed cell death via the mitochondrial cell death pathway (Paschen and Mengesdorf, 2005). Our results unveil a previously unknown mechanism whereby proteolytic activation of PKCδ induces proteotoxicity which, in turn, may partly favor the loss of dopaminergic neuronal integrity.
To gain insight into the molecular mechanisms that underlie mitochondria mediated mechanisms in MA-induced neurotoxicity, we focused our attention on PKCδ, a proapoptotic kinase. We and others have previously demonstrated that PKCδ induces apoptotic cell death via caspase-3 mediated proteolytic activation of PKCδ in multiple experimental contexts (Brodie and Blumberg, 2003;Kaul et al., 2003;Reyland, 2009). Indeed, we found that PKCδ is proteolytically cleaved to generate a 41 kDa constitutively active catalytic fragment and 35 kDa regulatory fragment during mitochondrial stress in MA-treated dopaminergic cells. We previously demonstrated that mutations in the caspase cleavage site (CRM) of PKCδ exert a protective response against dopaminergic neurotoxin-induced cell death (Latchoumycandane et al., 2005). Based on these reports, the requirement for PKCδ during mitochondria mediated cell death signaling pathways was further confirmed by the resistance of dominant negative PKC delta (PKCδ-DN), PKC delta cleavage resistant mutant (PKCδ-CRM) cells, and PKCδ-siRNA transfected cells to cell death induced by sustained exposure to MA in dopaminergic cells. Interestingly, MA-induced down regulation of proteasomal activation and accumulation of ubiquitinated aggregates were ameliorated in PKCδ-CRM cells, suggesting a role for proteolytic activation of PKCδ in the disruption of proteasomal function. We propose that the neuroprotective effect of the PKCδ-CRM mutant results from the recovery of MA-induced reduction of proteasomal activity by facilitating the degradation of aggregated proteins. Consistent with our results, a recent study (Lee et al., 2006) reported that nitration mediated activation of PKCδ inhibits proteasomal function, thereby contributing to oxidative stress mediated apoptotic cell death pathway. Interestingly, knockdown of PKCδ using siRNA resulted in a partial reduction of LC3-II, consistent with down regulation of autophagy. Conversely, forced expression of PKCδ catalytic fragment attenuated MA-induced induction of autophagy. Our previous studies revealed that forced expression of catalytic fragment of PKCδ facilitates caspase-3 dependent cell death events in a dopaminergic cell culture model treated with the proteasome inhibitor MG132 (Sun et al., 2008). Understanding precisely how MA-induced PKCδ activation influences autophagy will probably require more detailed studies.
Autophagic degradation of ubiquitinated protein aggregates has been shown to be critical for cell survival, but how the autophagic machinery recognizes such aggregates is unclear. Recently, p62/SQSTM1 was demonstrated to be a putative link between ubiquitination and autophagy (Komatsu et al., 2007b). In the present study, we observed a dose-dependent increase in p62 levels following MA treatment in N27 cells suggestive of impairment of autophagic flux (Fig. 6D). Our results are consistent with a recent finding showing that inhibition of autophagy using siRNA mediated silencing of Atg 7 and Atg 12 was found to increase accumulation of p62 (Korolchuk et al., 2009b). Furthermore, deletion of p62 was found to inhibit the formation of ubiquitinated protein aggregates induced by autophagy inactivation (Komatsu et al., 2007b;Komatsu and Ichimura, 2010;Korolchuk et al., 2009b). Interestingly, reduction in Lamp-2, a protein essential for fusion between autophagosome and lysosome, levels was also found to coincide with increased accumulation of p62 levels (Fig. 6D), which is suggestive of impaired autolysomal formation. Accordingly, Lamp-2 depletion reportedly causes an accumulation of autophagosomes containing cytotoxic waste products of the cell, which culminates in the induction of caspase-3-dependent apoptotic cell death events and ultimately cell death (Gonzalez-Polo et al., 2005). Collectively, our data suggest that impaired UPS and ALS might be critically linked to MA-induced apoptotic cell death in dopaminergic neuronal cells.
To explore the effect of MA-induced autophagy on neuronal apoptosis, we inhibited autophagy by treatment with 3-MA (Fig. 9B) or knocked down the expression levels of LC3 using siRNA mediated gene silencing (Fig. 9D). Our results indicate that inhibition of autophagy dramatically enhanced apoptosis, suggesting that autophagy may serve as a protective mechanism. Our studies are indeed consistent with genetic studies performed in mice, in which inactivation of the key autophagy related genes ATG7 and ATG5 was positively correlated with accumulation of ubiquitinated aggregates and neurodegeneration (Hara et al., 2006;Komatsu et al., 2007b). Another report (Castino et al., 2008a) recently demonstrated a cytoprotective role for autophagy in MA-treated PC-12 cells whereby Beclin-1 knockdown was found to activate the Bax signaling pathway, thereby increasing the vulnerability of neuronal cells to MA-induced neurodegeneration. Consistent with a neuroprotective role for autophagy, transient LC3 over expression partially attenuated MA-induced DNA fragmentation (Fig. 9H). The neuroprotective effects might be partially related to the ability to facilitate autophagy in order to degrade aggregated proteinaceous species. Thus, it is possible that inhibition of autophagy causes a shortage in bioenergetic status and accumulation of damaged organelles and misfolded protein aggregates, which might trigger apoptosis (Maiuri et al., 2010b;Rubinsztein et al., 2007). In terms of the time line of cell death signaling events associated with MA treatment, we observed a concomitant decline in mitochondrial membrane potential (MMP) and proteasomal activity as early as 3 h following MA treatment. Both of these events were accompanied by induction of autophagy, which may represent an adaptive mechanism to compensate for the removal of damaged mitochondria and aggregate prone proteins during early stages of MA exposure. During prolonged exposure to MA for 12–24 hr, excessive accumulation of aggregated proteins and mitochondrial dysfunction resulted in the persistent activation of proapoptotic events, including caspase-3 activation and PKCδ proteolytic cleavage. Thus, our studies raise the possibility that excessive accumulation of ubiquitin positive aggregates may overwhelm the degradative capacity of the autophagy mechanism due to lysosomal dysfunction, hence resulting in maximal activation of caspase-3 mediated PKCδ dependent cell death events that ultimately result in dopaminergic neuronal death. Our data with PKCδ knockdown and the PKCδ cleavage resistant mutant further support this conclusion.
Our data demonstrating the induction of autophagy, PKC™ cleavage, and cell death during low dose MA treatment positively correlates with the key results obtained in the high concentration studies. The major difference is that low concentrations induce changes over a prolonged period of time, whereas higher doses evoke a similar response in a shorter time frame. The fact that MA displays a similar dependency on UPS dysfunction prior to the loss of dopaminergic neuronal integrity in in vitro and in vivo studies conducted thus far (Moszczynska and Yamamoto, 2011) suggests that the mechanistic data generated from the present study may be extended to neurodegenerative effects evidenced in vivo following MA exposure.
In conclusion, our findings indicate that MA-induced early induction of autophagy may serve as an early adaptive strategy to degrade dysfunctional mitochondria and aggregated proteins. However, during later stages, the depletion of lysosomal protein leads to the inhibition of the terminal stages of autophagy, resulting in the accumulation of cytotoxic AVs containing ubiquitinated aggregates in the cytoplasm. Consequently, the cellular balance is now tilted in the direction of caspase-3 mediated cell death signaling events, presumably due to the excessive accumulation of protein aggregates and concomitant elevated activation of PKCδ dependent caspase-3 mediated cell death events, which eventually lead to dopaminergic neuronal demise. Our findings thus provide novel insights into the mechanisms underlying MA-induced dopaminergic neurodegeneration and also highlight the functional significance of the link between UPS and ALS and the key regulatory role of PKCδ in MA-induced neurodegeneration.
RESEARCH HIGHLIGHTS.
Methmaphetamine (MA)-induced mitochondrial and ubiquitin proteasomal system (UPS) dysfunction coincided with induction of autophagy.
MA-induced prominent proteolytic cleavage of protein kinase c delta (PKCd)
MA-induced lysosomal dysfunction
siRNA-mediated genetic knockdown of PKCd conferred resistance against MA-induced apoptotic cell death.
Acknowledgments
This work was supported by National Institutes of Health Grants NS74443 (AGK), NS65167 (AK) and ES19276 (AGK). The W. Eugene and Linda Lloyd Endowed Chair to AGK is also acknowledged.
ABBREVIATIONS
- ALS
autophagy-lysosome system
- AV
autophagy vacuoles
- DA
Dopamine
- LAMP-2
lysosomal-associated membrane protein 2
- MA
Methamphetamine
- MAP-LC3
microtubule-associated protein 1 light chain 3
- MMP
mitochondrial membrane potential
- PKC
protein kinase C
- TH
tyrosine hydroxylase
- Ub
ubiquitin
- UPS
ubiquitin-proteasome system
Footnotes
Publisher's Disclaimer: This is a PDF file of an unedited manuscript that has been accepted for publication. As a service to our customers we are providing this early version of the manuscript. The manuscript will undergo copyediting, typesetting, and review of the resulting proof before it is published in its final citable form. Please note that during the production process errors may be discovered which could affect the content, and all legal disclaimers that apply to the journal pertain.
Contributor Information
Mengshien Lin, Email: mhlin@iastate.edu.
Prashanth Chandramani Shivalingappa, Email: prashcs@iastate.edu.
Huajun Jin, Email: egb761@iastate.edu.
Anamitra Ghosh, Email: aghosh@iastate.edu.
Vellareddy Anantharam, Email: anantram@iastate.edu.
Syed Ali, Email: syed.ali@fda.hhs.gov.
Anumantha G. Kanthasamy, Email: akanthas@iastate.edu.
Arthi Kanthasamy, Email: arthik@iastate.edu.
Reference List
- Anantharam V, Kitazawa M, Wagner J, Kaul S, Kanthasamy AG. Caspase-3-dependent proteolytic cleavage of protein kinase Cdelta is essential for oxidative stress-mediated dopaminergic cell death after exposure to methylcyclopentadienyl manganese tricarbonyl. J Neurosci. 2002;22:1738–1751. doi: 10.1523/JNEUROSCI.22-05-01738.2002. [DOI] [PMC free article] [PubMed] [Google Scholar]
- Asaithambi A, Kanthasamy A, Saminathan H, Anantharam V, Kanthasamy AG. Protein kinase D1 (PKD1) activation mediates a compensatory protective response during early stages of oxidative stress-induced neuronal degeneration. Mol Neurodegener. 2011;6:43, 43. doi: 10.1186/1750-1326-6-43. [DOI] [PMC free article] [PubMed] [Google Scholar]
- Betarbet R, Sherer TB, Di Monte DA, Greenamyre JT. Mechanistic approaches to Parkinson’s disease pathogenesis. Brain Pathol. 2002;12:499–510. doi: 10.1111/j.1750-3639.2002.tb00468.x. [DOI] [PMC free article] [PubMed] [Google Scholar]
- Boland B, Kumar A, Lee S, Platt FM, Wegiel J, Yu WH, Nixon RA. Autophagy induction and autophagosome clearance in neurons: relationship to autophagic pathology in Alzheimer’s disease. J Neurosci. 2008;28:6926–6937. doi: 10.1523/JNEUROSCI.0800-08.2008. [DOI] [PMC free article] [PubMed] [Google Scholar]
- Brodie C, Blumberg PM. Regulation of cell apoptosis by protein kinase c delta. Apoptosis. 2003;8:19–27. doi: 10.1023/a:1021640817208. [DOI] [PubMed] [Google Scholar]
- Castino R, Lazzeri G, Lenzi P, Bellio N, Follo C, Ferrucci M, Fornai F, Isidoro C. Suppression of autophagy precipitates neuronal cell death following low doses of methamphetamine. J Neurochem. 2008a;106:1426–1439. doi: 10.1111/j.1471-4159.2008.05488.x. [DOI] [PubMed] [Google Scholar]
- Castino R, Lazzeri G, Lenzi P, Bellio N, Follo C, Ferrucci M, Fornai F, Isidoro C. Suppression of autophagy precipitates neuronal cell death following low doses of methamphetamine. J Neurochem. 2008b;106:1426–1439. doi: 10.1111/j.1471-4159.2008.05488.x. [DOI] [PubMed] [Google Scholar]
- Chen JL, Lin HH, Kim KJ, Lin A, Ou JH, Ann DK. PKC delta signaling: a dual role in regulating hypoxic stress-induced autophagy and apoptosis. Autophagy. 2009;5:244–246. doi: 10.4161/auto.5.2.7549. [DOI] [PMC free article] [PubMed] [Google Scholar]
- Deng X, Cai NS, McCoy MT, Chen W, Trush MA, Cadet JL. Methamphetamine induces apoptosis in an immortalized rat striatal cell line by activating the mitochondrial cell death pathway. Neuropharmacology. 2002a;42:837–845. doi: 10.1016/s0028-3908(02)00034-5. [DOI] [PubMed] [Google Scholar]
- Deng X, Jayanthi S, Ladenheim B, Krasnova IN, Cadet JL. Mice with partial deficiency of c-Jun show attenuation of methamphetamine-induced neuronal apoptosis. Mol Pharmacol. 2002b;62:993–1000. doi: 10.1124/mol.62.5.993. [DOI] [PubMed] [Google Scholar]
- Djavaheri-Mergny M, Maiuri MC, Kroemer G. Cross talk between apoptosis and autophagy by caspase-mediated cleavage of Beclin 1. Oncogene. 2010;29:1717–1719. doi: 10.1038/onc.2009.519. [DOI] [PubMed] [Google Scholar]
- Du Y, Yang D, Li L, Luo G, Li T, Fan X, Wang Q, Zhang X, Wang Y, Le W. An insight into the mechanistic role of p53-mediated autophagy induction in response to proteasomal inhibition-induced neurotoxicity. Autophagy. 2009;5:663–675. doi: 10.4161/auto.5.5.8377. [DOI] [PubMed] [Google Scholar]
- Fornai F, Lazzeri G, Lenzi P, Gesi M, Ferrucci M, Soldani P, Pellegrini A, Capobianco L, De BA, Ruggieri S, Paparelli A. Amphetamines induce ubiquitin-positive inclusions within striatal cells. Neurol Sci. 2003;24:182–183. doi: 10.1007/s10072-003-0120-4. [DOI] [PubMed] [Google Scholar]
- Fornai F, Lenzi P, Capobianco L, Iacovelli L, Scarselli P, Lazzeri G, De BA. Involvement of dopamine receptors and beta-arrestin in metamphetamine-induced inclusions formation in PC12 cells. J Neurochem. 2008;105:1939–1947. doi: 10.1111/j.1471-4159.2008.05284.x. [DOI] [PubMed] [Google Scholar]
- Fornai F, Lenzi P, Gesi M, Soldani P, Ferrucci M, Lazzeri G, Capobianco L, Battaglia G, De BA, Nicoletti F, Paparelli A. Methamphetamine produces neuronal inclusions in the nigrostriatal system and in PC12 cells. J Neurochem. 2004;88:114–123. doi: 10.1046/j.1471-4159.2003.02137.x. [DOI] [PubMed] [Google Scholar]
- Galluzzi L, Morselli E, Vicencio JM, Kepp O, Joza N, Tajeddine N, Kroemer G. Life, death and burial: multifaceted impact of autophagy. Biochem Soc Trans. 2008;36:786–790. doi: 10.1042/BST0360786. [DOI] [PubMed] [Google Scholar]
- Gonzalez-Polo RA, Boya P, Pauleau AL, Jalil A, Larochette N, Souquere S, Eskelinen EL, Pierron G, Saftig P, Kroemer G. The apoptosis/autophagy paradox: autophagic vacuolization before apoptotic death. J Cell Sci. 2005;118:3091–3102. doi: 10.1242/jcs.02447. [DOI] [PubMed] [Google Scholar]
- Hara T, Nakamura K, Matsui M, Yamamoto A, Nakahara Y, Suzuki-Migishima R, Yokoyama M, Mishima K, Saito I, Okano H, Mizushima N. Suppression of basal autophagy in neural cells causes neurodegenerative disease in mice. Nature. 2006;441:885–889. doi: 10.1038/nature04724. [DOI] [PubMed] [Google Scholar]
- Iwamaru A, Kondo Y, Iwado E, Aoki H, Fujiwara K, Yokoyama T, Mills GB, Kondo S. Silencing mammalian target of rapamycin signaling by small interfering RNA enhances rapamycin-induced autophagy in malignant glioma cells. Oncogene. 2007;26:1840–1851. doi: 10.1038/sj.onc.1209992. [DOI] [PubMed] [Google Scholar]
- Janen SB, Chaachouay H, Richter-Landsberg C. Autophagy is activated by proteasomal inhibition and involved in aggresome clearance in cultured astrocytes. Glia. 2010;58:1766–1774. doi: 10.1002/glia.21047. [DOI] [PubMed] [Google Scholar]
- Jayanthi S, Ladenheim B, Cadet JL. Methamphetamine-induced changes in antioxidant enzymes and lipid peroxidation in copper/zinc-superoxide dismutase transgenic mice. Ann N Y Acad Sci. 1998;844:92–102. 92–102. [PubMed] [Google Scholar]
- Jeng W, Wong AW, Ting AK, Wells PG. Methamphetamine-enhanced embryonic oxidative DNA damage and neurodevelopmental deficits. Free Radic Biol Med. 2005;39:317–326. doi: 10.1016/j.freeradbiomed.2005.03.015. [DOI] [PubMed] [Google Scholar]
- Jin H, Kanthasamy A, Anantharam V, Rana A, Kanthasamy AG. Transcriptional Regulation of Pro-apoptotic Protein Kinase C{delta}: IMPLICATIONS FOR OXIDATIVE STRESS-INDUCED NEURONAL CELL DEATH. J Biol Chem. 2011;286:19840–19859. doi: 10.1074/jbc.M110.203687. [DOI] [PMC free article] [PubMed] [Google Scholar]
- Jin S. Autophagy, mitochondrial quality control, and oncogenesis. Autophagy. 2006;2:80–84. doi: 10.4161/auto.2.2.2460. [DOI] [PubMed] [Google Scholar]
- Kanthasamy A, Anantharam V, Ali SF, Kanthasamy AG. Methamphetamine induces autophagy and apoptosis in a mesencephalic dopaminergic neuronal culture model: role of cathepsin-D in methamphetamine-induced apoptotic cell death. Ann N Y Acad Sci. 2006;1074:234–44. 234–244. doi: 10.1196/annals.1369.022. [DOI] [PubMed] [Google Scholar]
- Kaul S, Kanthasamy A, Kitazawa M, Anantharam V, Kanthasamy AG. Caspase-3 dependent proteolytic activation of protein kinase C delta mediates and regulates 1-methyl-4-phenylpyridinium (MPP+)-induced apoptotic cell death in dopaminergic cells: relevance to oxidative stress in dopaminergic degeneration. Eur J Neurosci. 2003;18:1387–1401. doi: 10.1046/j.1460-9568.2003.02864.x. [DOI] [PubMed] [Google Scholar]
- Kita T, Miyazaki I, Asanuma M, Takeshima M, Wagner GC. Dopamine-induced behavioral changes and oxidative stress in methamphetamine-induced neurotoxicity. Int Rev Neurobiol. 2009;88:43–64. 43–64. doi: 10.1016/S0074-7742(09)88003-3. [DOI] [PubMed] [Google Scholar]
- Komatsu M, Ichimura Y. Physiological significance of selective degradation of p62 by autophagy. FEBS Lett. 2010;584:1374–1378. doi: 10.1016/j.febslet.2010.02.017. [DOI] [PubMed] [Google Scholar]
- Komatsu M, Waguri S, Chiba T, Murata S, Iwata J, Tanida I, Ueno T, Koike M, Uchiyama Y, Kominami E, Tanaka K. Loss of autophagy in the central nervous system causes neurodegeneration in mice. Nature. 2006;441:880–884. doi: 10.1038/nature04723. [DOI] [PubMed] [Google Scholar]
- Komatsu M, et al. Homeostatic levels of p62 control cytoplasmic inclusion body formation in autophagy-deficient mice. Cell. 2007a;131:1149–1163. doi: 10.1016/j.cell.2007.10.035. [DOI] [PubMed] [Google Scholar]
- Komatsu M, et al. Homeostatic levels of p62 control cytoplasmic inclusion body formation in autophagy-deficient mice. Cell. 2007b;131:1149–1163. doi: 10.1016/j.cell.2007.10.035. [DOI] [PubMed] [Google Scholar]
- Korolchuk VI, Mansilla A, Menzies FM, Rubinsztein DC. Autophagy inhibition compromises degradation of ubiquitin-proteasome pathway substrates. Mol Cell. 2009a;33:517–527. doi: 10.1016/j.molcel.2009.01.021. [DOI] [PMC free article] [PubMed] [Google Scholar]
- Korolchuk VI, Mansilla A, Menzies FM, Rubinsztein DC. Autophagy inhibition compromises degradation of ubiquitin-proteasome pathway substrates. Mol Cell. 2009b;33:517–527. doi: 10.1016/j.molcel.2009.01.021. [DOI] [PMC free article] [PubMed] [Google Scholar]
- Krasnova IN, Cadet JL. Methamphetamine toxicity and messengers of death. Brain Res Rev. 2009;60:379–407. doi: 10.1016/j.brainresrev.2009.03.002. [DOI] [PMC free article] [PubMed] [Google Scholar]
- Larsen KE, Fon EA, Hastings TG, Edwards RH, Sulzer D. Methamphetamine-induced degeneration of dopaminergic neurons involves autophagy and upregulation of dopamine synthesis. J Neurosci. 2002;22:8951–8960. doi: 10.1523/JNEUROSCI.22-20-08951.2002. [DOI] [PMC free article] [PubMed] [Google Scholar]
- Latchoumycandane C, Anantharam V, Kitazawa M, Yang Y, Kanthasamy A, Kanthasamy AG. Protein kinase Cdelta is a key downstream mediator of manganese-induced apoptosis in dopaminergic neuronal cells. J Pharmacol Exp Ther. 2005;313:46–55. doi: 10.1124/jpet.104.078469. [DOI] [PubMed] [Google Scholar]
- LaVoie MJ, Hastings TG. Dopamine quinone formation and protein modification associated with the striatal neurotoxicity of methamphetamine: evidence against a role for extracellular dopamine. J Neurosci. 1999;19:1484–1491. doi: 10.1523/JNEUROSCI.19-04-01484.1999. [DOI] [PMC free article] [PubMed] [Google Scholar]
- Lee SJ, Kim DC, Choi BH, Ha H, Kim KT. Regulation of p53 by activated protein kinase C-delta during nitric oxide-induced dopaminergic cell death. J Biol Chem. 2006;281:2215–2224. doi: 10.1074/jbc.M509509200. [DOI] [PubMed] [Google Scholar]
- Liao YF, Hung YC, Chang WH, Tsay GJ, Hour TC, Hung HC, Liu GY. The PKC delta inhibitor, rottlerin, induces apoptosis of haematopoietic cell lines through mitochondrial membrane depolarization and caspases’ cascade. Life Sci. 2005;77:707–719. doi: 10.1016/j.lfs.2005.01.010. [DOI] [PubMed] [Google Scholar]
- Maiuri MC, Criollo A, Kroemer G. Crosstalk between apoptosis and autophagy within the Beclin 1 interactome. EMBO J. 2010a;29:515–516. doi: 10.1038/emboj.2009.377. [DOI] [PMC free article] [PubMed] [Google Scholar]
- Maiuri MC, Criollo A, Kroemer G. Crosstalk between apoptosis and autophagy within the Beclin 1 interactome. EMBO J. 2010b;29:515–516. doi: 10.1038/emboj.2009.377. [DOI] [PMC free article] [PubMed] [Google Scholar]
- Miller DB, O’Callaghan JP. Environment-, drug- and stress-induced alterations in body temperature affect the neurotoxicity of substituted amphetamines in the C57BL/6J mouse. J Pharmacol Exp Ther. 1994;270:752–760. [PubMed] [Google Scholar]
- Miyazaki I, Asanuma M. Approaches to prevent dopamine quinone-induced neurotoxicity. Neurochem Res. 2009;34:698–706. doi: 10.1007/s11064-008-9843-1. [DOI] [PubMed] [Google Scholar]
- Mizushima N. Autophagy: process and function. Genes Dev. 2007;21:2861–2873. doi: 10.1101/gad.1599207. [DOI] [PubMed] [Google Scholar]
- Moszczynska A, Yamamoto BK. Methamphetamine oxidatively damages parkin and decreases the activity of 26S proteasome in vivo. J Neurochem. 2011;116:1005–1017. doi: 10.1111/j.1471-4159.2010.07147.x. [DOI] [PMC free article] [PubMed] [Google Scholar]
- Munafo DB, Colombo MI. A novel assay to study autophagy: regulation of autophagosome vacuole size by amino acid deprivation. J Cell Sci. 2001;114:3619–3629. doi: 10.1242/jcs.114.20.3619. [DOI] [PubMed] [Google Scholar]
- Nakayama M, Koyama T, Yamashita I. Long-lasting decrease in dopamine uptake sites following repeated administration of methamphetamine in the rat striatum. Brain Res. 1993;601:209–212. doi: 10.1016/0006-8993(93)91712-2. [DOI] [PubMed] [Google Scholar]
- Olanow CW, McNaught KS. Ubiquitin-proteasome system and Parkinson’s disease. Mov Disord. 2006;21:1806–1823. doi: 10.1002/mds.21013. [DOI] [PubMed] [Google Scholar]
- Pan T, Kondo S, Le W, Jankovic J. The role of autophagy-lysosome pathway in neurodegeneration associated with Parkinson’s disease. Brain. 2008a;131:1969–1978. doi: 10.1093/brain/awm318. [DOI] [PubMed] [Google Scholar]
- Pan T, Kondo S, Zhu W, Xie W, Jankovic J, Le W. Neuroprotection of rapamycin in lactacystin-induced neurodegeneration via autophagy enhancement. Neurobiol Dis. 2008b;32:16–25. doi: 10.1016/j.nbd.2008.06.003. [DOI] [PubMed] [Google Scholar]
- Pan T, Kondo S, Zhu W, Xie W, Jankovic J, Le W. Neuroprotection of rapamycin in lactacystin-induced neurodegeneration via autophagy enhancement. Neurobiol Dis. 2008c;32:16–25. doi: 10.1016/j.nbd.2008.06.003. [DOI] [PubMed] [Google Scholar]
- Paschen W, Mengesdorf T. Cellular abnormalities linked to endoplasmic reticulum dysfunction in cerebrovascular disease--therapeutic potential. Pharmacol Ther. 2005;108:362–375. doi: 10.1016/j.pharmthera.2005.05.008. [DOI] [PubMed] [Google Scholar]
- Pasquali L, Lazzeri G, Isidoro C, Ruggieri S, Paparelli A, Fornai F. Role of autophagy during methamphetamine neurotoxicity. Ann N Y Acad Sci. 2008;1139:191–6. 191–196. doi: 10.1196/annals.1432.016. [DOI] [PubMed] [Google Scholar]
- Priault M, Salin B, Schaeffer J, Vallette FM, di Rago JP, Martinou JC. Impairing the bioenergetic status and the biogenesis of mitochondria triggers mitophagy in yeast. Cell Death Differ. 2005;12:1613–1621. doi: 10.1038/sj.cdd.4401697. [DOI] [PubMed] [Google Scholar]
- Qi L, Gang L, Hang KW, Ling CH, Xiaofeng Z, Zhen L, David WY, Sang PW. Programmed neuronal cell death induced by HIV-1 tat and methamphetamine. Microsc Res Tech. 2011;10 doi: 10.1002/jemt.21006. [DOI] [PubMed] [Google Scholar]
- Quan L, Ishikawa T, Michiue T, Li DR, Zhao D, Oritani S, Zhu BL, Maeda H. Ubiquitin-immunoreactive structures in the midbrain of methamphetamine abusers. Leg Med (Tokyo) 2005;7:144–150. doi: 10.1016/j.legalmed.2004.11.002. [DOI] [PubMed] [Google Scholar]
- Rami A, Langhagen A, Steiger S. Focal cerebral ischemia induces upregulation of Beclin 1 and autophagy-like cell death. Neurobiol Dis. 2008;29:132–141. doi: 10.1016/j.nbd.2007.08.005. [DOI] [PubMed] [Google Scholar]
- Reyland ME. Protein kinase C isoforms: Multi-functional regulators of cell life and death. Front Biosci. 2009;14:2386–99. 2386–2399. doi: 10.2741/3385. [DOI] [PMC free article] [PubMed] [Google Scholar]
- Ricaurte GA, Guillery RW, Seiden LS, Schuster CR, Moore RY. Dopamine nerve terminal degeneration produced by high doses of methylamphetamine in the rat brain. Brain Res. 1982;235:93–103. doi: 10.1016/0006-8993(82)90198-6. [DOI] [PubMed] [Google Scholar]
- Rideout HJ, Stefanis L. Proteasomal inhibition-induced inclusion formation and death in cortical neurons require transcription and ubiquitination. Mol Cell Neurosci. 2002;21:223–238. doi: 10.1006/mcne.2002.1173. [DOI] [PubMed] [Google Scholar]
- Rubinsztein DC, Gestwicki JE, Murphy LO, Klionsky DJ. Potential therapeutic applications of autophagy. Nat Rev Drug Discov. 2007;6:304–312. doi: 10.1038/nrd2272. [DOI] [PubMed] [Google Scholar]
- Shen H, Luo Y, Yu SJ, Wang Y. Enhanced neurodegeneration after a high dose of methamphetamine in adenosine A3 receptor null mutant mice. Neuroscience. 2011;194:170–80. doi: 10.1016/j.neuroscience.2011.08.013. Epub@2011 Aug 10.:170–180. [DOI] [PMC free article] [PubMed] [Google Scholar]
- Smith KJ, Self RL, Butler TR, Mullins MM, Ghayoumi L, Holley RC, Littleton JM, Prendergast MA. Methamphetamine exposure antagonizes N-methyl-D-aspartate receptor-mediated neurotoxicity in organotypic hippocampal slice cultures. Brain Res. 2007;1157:74–80. doi: 10.1016/j.brainres.2007.04.056. Epub@2007 May 4.:74–80. [DOI] [PMC free article] [PubMed] [Google Scholar]
- Soltoff SP. Rottlerin is a mitochondrial uncoupler that decreases cellular ATP levels and indirectly blocks protein kinase Cdelta tyrosine phosphorylation. J Biol Chem. 2001;276:37986–37992. doi: 10.1074/jbc.M105073200. [DOI] [PubMed] [Google Scholar]
- Song KS, Kim JS, Yun EJ, Kim YR, Seo KS, Park JH, Jung YJ, Park JI, Kweon GR, Yoon WH, Lim K, Hwang BD. Rottlerin induces autophagy and apoptotic cell death through a PKC-delta-independent pathway in HT1080 human fibrosarcoma cells: the protective role of autophagy in apoptosis. Autophagy. 2008;4:650–658. doi: 10.4161/auto.6057. [DOI] [PubMed] [Google Scholar]
- Soto C, Estrada LD. Protein misfolding and neurodegeneration. Arch Neurol. 2008;65:184–189. doi: 10.1001/archneurol.2007.56. [DOI] [PubMed] [Google Scholar]
- Sun F, Anantharam V, Zhang D, Latchoumycandane C, Kanthasamy A, Kanthasamy AG. Proteasome inhibitor MG-132 induces dopaminergic degeneration in cell culture and animal models. Neurotoxicology. 2006;27:807–815. doi: 10.1016/j.neuro.2006.06.006. [DOI] [PubMed] [Google Scholar]
- Sun F, Kanthasamy A, Anantharam V, Kanthasamy AG. Mitochondrial accumulation of polyubiquitinated proteins and differential regulation of apoptosis by polyubiquitination sites Lys-48 and -63. J Cell Mol Med. 2009;13:1632–1643. doi: 10.1111/j.1582-4934.2009.00775.x. [DOI] [PMC free article] [PubMed] [Google Scholar]
- Sun F, Kanthasamy A, Song C, Yang Y, Anantharam V, Kanthasamy AG. Proteasome inhibitor-induced apoptosis is mediated by positive feedback amplification of PKCdelta proteolytic activation and mitochondrial translocation. J Cell Mol Med. 2008;12:2467–2481. doi: 10.1111/j.1582-4934.2008.00293.x. [DOI] [PMC free article] [PubMed] [Google Scholar]
- Thompson PM, Hayashi KM, Simon SL, Geaga JA, Hong MS, Sui Y, Lee JY, Toga AW, Ling W, London ED. Structural abnormalities in the brains of human subjects who use methamphetamine. J Neurosci. 2004;24:6028–6036. doi: 10.1523/JNEUROSCI.0713-04.2004. [DOI] [PMC free article] [PubMed] [Google Scholar]
- Wang SF, Yen JC, Yin PH, Chi CW, Lee HC. Involvement of oxidative stress-activated JNK signaling in the methamphetamine-induced cell death of human SH-SY5Y cells. Toxicology. 2008;246:234–241. doi: 10.1016/j.tox.2008.01.020. [DOI] [PubMed] [Google Scholar]
- Wilson JM, Kalasinsky KS, Levey AI, Bergeron C, Reiber G, Anthony RM, Schmunk GA, Shannak K, Haycock JW, Kish SJ. Striatal dopamine nerve terminal markers in human, chronic methamphetamine users. Nat Med. 1996;2:699–703. doi: 10.1038/nm0696-699. [DOI] [PubMed] [Google Scholar]
- Yamato M, Kudo W, Shiba T, Yamada KI, Watanabe T, Utsumi H. Determination of reactive oxygen species associated with the degeneration of dopaminergic neurons during dopamine metabolism. Free Radic Res. 2010;44:249–257. doi: 10.3109/10715760903456084. [DOI] [PubMed] [Google Scholar]
- Yang Y, Kaul S, Zhang D, Anantharam V, Kanthasamy AG. Suppression of caspase-3-dependent proteolytic activation of protein kinase C delta by small interfering RNA prevents MPP+-induced dopaminergic degeneration. Mol Cell Neurosci. 2004;25:406–421. doi: 10.1016/j.mcn.2003.11.011. [DOI] [PubMed] [Google Scholar]
- Yousefi S, Perozzo R, Schmid I, Ziemiecki A, Schaffner T, Scapozza L, Brunner T, Simon HU. Calpain-mediated cleavage of Atg5 switches autophagy to apoptosis. Nat Cell Biol. 2006;8:1124–1132. doi: 10.1038/ncb1482. [DOI] [PubMed] [Google Scholar]
- Yu J, Wang J, Cadet JL, Angulo JA. Histological evidence supporting a role for the striatal neurokinin-1 receptor in methamphetamine-induced neurotoxicity in the mouse brain. Brain Res. 2004;1007:124–131. doi: 10.1016/j.brainres.2004.01.077. [DOI] [PMC free article] [PubMed] [Google Scholar]
- Zhang D, Kanthasamy A, Anantharam V, Kanthasamy A. Effects of manganese on Tyrosine Hydroxylase (TH) Activity and TH-phosphorylation in a dopaminergic neural cell line. Toxicol Appl Pharmacol. 2011 doi: 10.1016/j.taap.2010.03.023. [DOI] [PMC free article] [PubMed] [Google Scholar]
- Zhang D, Kanthasamy A, Yang Y, Anantharam V, Kanthasamy A. Protein kinase C delta negatively regulates tyrosine hydroxylase activity and dopamine synthesis by enhancing protein phosphatase-2A activity in dopaminergic neurons. J Neurosci. 2007;27:5349–5362. doi: 10.1523/JNEUROSCI.4107-06.2007. [DOI] [PMC free article] [PubMed] [Google Scholar]
- Zhu JP, Xu W, Angulo JA. Methamphetamine-induced cell death: selective vulnerability in neuronal subpopulations of the striatum in mice. Neuroscience. 2006;140:607–622. doi: 10.1016/j.neuroscience.2006.02.055. [DOI] [PMC free article] [PubMed] [Google Scholar]


