

Abstract
Background
The United States (U.S.) approved use of federal funds for needle and syringe programs (NSPs) in December 2009. This study compares syringe disposal practices in a U.S. city with NSPs to a U.S. city without NSPs by examining the prevalence of improperly discarded syringes in public places and the self-reported syringe disposal practices of injection drug users (IDUs) in the two cities.
Methods
We conducted visual inspection walkthroughs in a random sample of the top-quartile of drug-affected neighborhoods in San Francisco, California (a city with NSPs) and Miami, Florida (a city without NSPs). We also conducted quantitative surveys of adult IDUs in San Francisco (N=602) and Miami (N=448).
Results
In the visual inspections, we found 44 syringes/1000 census blocks in San Francisco, and 371/1000 census blocks in Miami. Survey results showed that in San Francisco 13% of syringes IDUs reported using in the 30 days preceding the study interviews were disposed of improperly versus 95% of syringes by IDUs in Miami. In multivariable logistic regression analysis, IDUs in Miami had over 34 times the adjusted odds of public syringe disposal relative to IDUs in San Francisco (adjusted odds ratio=34.2, 95% CI = 21.92, 53.47).
Conclusions
We found eight-fold more improperly disposed syringes on walkthroughs in the city without NSPs compared to the city with NSPs, which was corroborated by survey data. NSPs may help IDUs dispose of their syringes safely in cities with large numbers of IDUs.
Keywords: injection drug users (IDUs), needle and syringe programs (NSPs), HIV, hepatitis
1. INTRODUCTION
In 2009, injection drug users (IDUs) accounted for 9% of the 48,100 new HIV infections in the U.S. (Prejean et al., 2011). In 2007, 15% of the 43,000 new Hepatitis B Virus infections and 44% of the 17,000 new Hepatitis C Virus infections in the U.S. were among persons who reported drug injection as a risk factor (Daniels et al., 2009). Many IDUs contract these viral infections through the sharing of contaminated syringes. Furthermore, although uncommon, the possibility of viral transmission to non-IDUs through accidental needle-sticks exists from unsafely disposed contaminated syringes in community settings (Alter, 1994; Hanrahan and Reutter, 1997; Jayanth, 2009). In response to these viral epidemics, needle and syringe programs (NSPs) have been implemented in many countries including the U.S. (Mathers et al., 2010). These programs allow IDUs to dispose of contaminated syringes and receive sterile syringes, with the goal of reducing the likelihood of IDUs’ sharing used syringes and community members being exposed to unsafely disposed contaminated syringes. Many studies have shown that NSPs help to reduce both the sharing of syringes and HIV infection among IDUs (Watters et al., 1994; Neaigus et al., 2008; Woodak and Cooney, 2006).
The first NSPs in the U.S. opened in the late 1980s in Boston, MA, and Tacoma, WA, followed shortly by a program in San Francisco, CA, which opened in November of 1988 (Hagan et al., 1991). The North American Syringe Exchange Network estimates that there are currently almost 200 NSPs operating in the U.S. (Guardino et al., 2010). In December of 2009, U.S. President Barack Obama signed a bill authorizing the use of federal dollars for NSPs. This signing marked the end of a 21-year long Congressional ban on NSPs instituted at the height of the AIDS epidemic (Kerlikowske and Crowley, 2010). One of the claims of NSP opponents had been that NSPs might increase, rather than decrease, the number of unsafely disposed contaminated syringes in neighborhoods, thereby exposing unsuspecting community members, including children, to viral infections through accidental needle-stick injuries (Golub et al., 2005; Lewis et al., 2002; Springer et al., 2009).
There are relatively few studies of syringe disposal among IDUs, especially as it pertains to NSPs (Coffin et al., 2007; Doherty et al., 1997; Doherty et al., 2000; Guydish et al., 1991, Khoshnood et al., 2000). Bluthenthal et al. (2007) found that among 24 NSPs in California in 2003, IDUs reported no increased unsafe disposal in areas where NSPs were providing more syringe coverage. In 2008, members of our study team conducted a study in which we counted syringes on the streets and interviewed IDUs about disposal practices in San Francisco, which has four NSPs (Wenger et al., 2011). One important and unanswered question is whether disposal practices are different in cities with and without NSPs. No studies of which we are aware have compared the prevalence of unsafely disposed syringes in a city with NSPs to a city without NSPs. Furthermore, there have been very few studies that have empirically assessed the prevalence of unsafely discarded syringes (Wenger et al., 2011; Nyiri et al., 2004; de Montigny et al., 2009; Riley et al., 1998). Within this context, we compared syringe disposal practices in a U.S. city with NSPs (San Francisco) to a U.S. city without NSPs (Miami) by examining 1) the prevalence of improperly discarded syringes in public places and 2) the self-reported syringe disposal practices among IDUs in the two cities.
2. METHODS
2.1. Two Study Cities
In order to compare syringe disposal practices among IDUs in San Francisco and Miami, we conducted visual inspection walkthroughs and interviewed IDUs in each city. This study was first conducted in San Francisco in 2008, the methods and results of which have been previously published (Wenger et al., 2011). To be able to compare data across cities, we replicated the methods of that study in Miami in 2009.
San Francisco and Miami metropolitan areas have sizable IDU populations with estimates in San Francisco of 24,582 IDUs and 10,529 IDUs in Miami (Friedman et al., 2004). San Francisco has a population of approximately 798,000 and the City of Miami has approximately 350,000 residents (U.S. Census Bureau, 2008). HIV prevalence estimates among IDUs are 11.7% in San Francisco and 22.8% in Miami (Tempalski et al., 2009). Furthermore, while there are four NSPs that provide an estimated 2.4 million sterile syringes annually in San Francisco, NSPs are expressly forbidden by law in Miami (Huriaux, 2010; The Florida Statutes, 2011). Two NSPs in San Francisco utilize a syringe access model called “one-for-one plus” and two NSPs utilize a “distribution” syringe access model. The policy of “one-for-one plus” NSPs is to give clients a few more syringes than were disposed, whereas “distribution” NSPs give clients the number of syringes they request, regardless of number of syringes that were disposed (Kral et al., 2004). California’s Disease Prevention Demonstration Project, enacted in 2005, authorizes pharmacies to provide up to 10 syringes to adults without a prescription (California Senate Bill 1159, 2005). In Miami, the Florida Statutes forbid the transfer of a syringe to a person known to inject illegal drugs (The Florida Statutes, 2011). There are no coordinated efforts in San Francisco or Miami for syringe cleanup in drug-affected areas. Current street sweeping and litter removal policies are similar in both cities (San Francisco Department of Public Works; City of Miami Solid Waste Department).
2.2. Visual Inspection Walkthroughs
We chose to conduct visual inspection walkthroughs in a quarter of neighborhoods in each city, representing those with the highest concentration of drug use. To assess which neighborhoods represented the top quartile of drug-affected areas, we used data furnished by each city to map arrests and drug treatment admissions by neighborhood using ArcGIS Software (version 9.3; Redlands, CA). In San Francisco, we selected 11 of 44 neighborhoods totaling 2,114 census blocks. In Miami, we selected 59 of 258 neighborhoods totaling 1,769 census blocks. (The Florida Department of Children and Families only releases drug treatment data by zip code. Miami drug-affected neighborhoods were determined by Miami Police Department narcotics-related arrest data.) We then used SPSS (version 17.0; Chicago, IL) to select a random sample of 1,000 census blocks for inspection in San Francisco and 885 census blocks for inspection in Miami. A census block is an area of land bounded on all sides by streets or other visible features such as a highway, railroad track or water. In San Francisco, only one side of each census block was randomly selected for inspection. In Miami, all four sides of each census block were inspected. To mathematically adjust for having inspected all four sides of the census block in Miami and only one side in San Francisco, we simply multiplied the number of found syringes in San Francisco by four. The random selection of census block sides in San Francisco included both long and short census block sides.
Each census block was visually inspected once for discarded syringes. All publicly accessible areas including sidewalks, gutters, grassy areas, alleys and parking lots were inspected. All inspection was visual and the environment was not altered. For each syringe encountered, the location was immediately recorded on a handheld device. With ArcGIS, the intersection closest to each found syringe was geocoded in both cities. This component of the study was exempt from human subjects research.
2.3. Quantitative Surveys of IDUs
To examine syringe disposal practices among IDUs, we conducted quantitative surveys of IDUs in the two study cities (N=602 in San Francisco in 2008 and N=448 in Miami in 2009). IDUs in both cities were recruited from neighborhoods known to have high levels of injection drug use using targeted sampling (TS) in San Francisco and respondent-driven sampling (RDS) in Miami (Bluthenthal and Watters, 1995; Watters and Biernacki, 1989; Magnani et al., 2005). RDS and TS have been shown to yield samples similar in demographics (age, race, sex, and drug of choice) and similar to Census and HIV surveillance data across multiple cities (Kral et al., 2010; Robinson et al., 2006). IDUs in San Francisco were not recruited from NSPs, though many IDUs reported having used a NSP. Eligibility criteria for participation in the quantitative interviews were (1) recent injection of illicit drugs as verified by checking for signs of recent venipuncture or assessing knowledge of injection practices; (2) age 18 years or older; and (3) ability to provide informed consent. Trained interviewers conducted computer-assisted personal interviewing in confidential settings. The survey questionnaire included items on demographic characteristics as well as syringe disposal practices. This component of the study was approved by the Institutional Review Boards at RTI International, the University of Miami, and the Florida Department of Health.
2.4. Measures
We assessed syringe disposal practices of IDUs in two ways. First we asked participants “In the last 30 days, have you gotten rid of or disposed of used syringes…(a) in a public place (alleys; parks; bushes; bridges; canals; railroad tracks; parking lot; street, public trash); (b) by selling them or giving them away; (c) by putting them in the trash at home or another person's home or hotel room; (d) at a needle exchange program; (e) at a hospital clinic; (f) at a pharmacy; (g) using a sharps container; (h) at some other place (specify)." The interviewers gave no instructions so the responses may not have been mutually exclusive. For each affirmative answer, we asked the follow-up question “in the last 30 days, how many syringes did you dispose of using each of the methods “a” through “h.” The responses to these questions indicating the number of syringes disposed by an individual were summed by each method for all participants. We defined improper disposal as any disposal of syringes in a public place, by selling them or giving them away, by putting them in the trash at home or another person’s home or hotel room, in the sewer, or by flushing. We defined safe disposal as syringe disposal at a NSP, hospital, clinic or pharmacy, and using a sharps container or public disposal box. We ascertained the proportion of improperly disposed syringes by dividing the number of syringes disposed of improperly by the total number of disposed syringes.
2.5. Statistical Analyses
2.5.1. Visual Inspection Walkthroughs
The number of syringes was normalized to syringe density and syringe prevalence to facilitate comparison between the two cities. We defined syringe prevalence as the number of syringes per 1,000 population living in inspected census blocks. We defined syringe density as the number of syringes per 1,000 census blocks in the sample.
2.5.2. Quantitative Survey of IDUs
The demographic differences and difference in the percentages of participants disposing in a particular location were tested for site differences using a chi-squared test. In order to determine site differences in the rate of public disposal, a multivariable logistic regression model was developed; independent variables included site and demographic variables. The adjusted odds ratios (AOR), 95% confidence intervals (CI) and p-value for the site differences and each demographic group were calculated using SAS release 9.13 Service Pack 4 (SAS Institute, Inc., Cary, NC).
3. RESULTS
3.1. Prevalence of Improperly Discarded Syringes from Visual Inspection Walkthroughs
The locations of improperly discarded syringes in San Francisco and Miami are presented in Figures 1A and 1B. We found 11 syringes in our inspections in San Francisco and 328 in our inspections in Miami. The number of syringes found in San Francisco was multiplied by 4 to extrapolate to the entire census block and facilitate comparison between the 2 cities. In San Francisco, the syringe density was 44/1000 census blocks and the syringe prevalence was 0.3/1000 people in the census blocks inspected. In contrast, in Miami the syringe density was 371/1000 census blocks and the syringe prevalence was 4.9/1000 people in the census blocks inspected.
Figure 1.
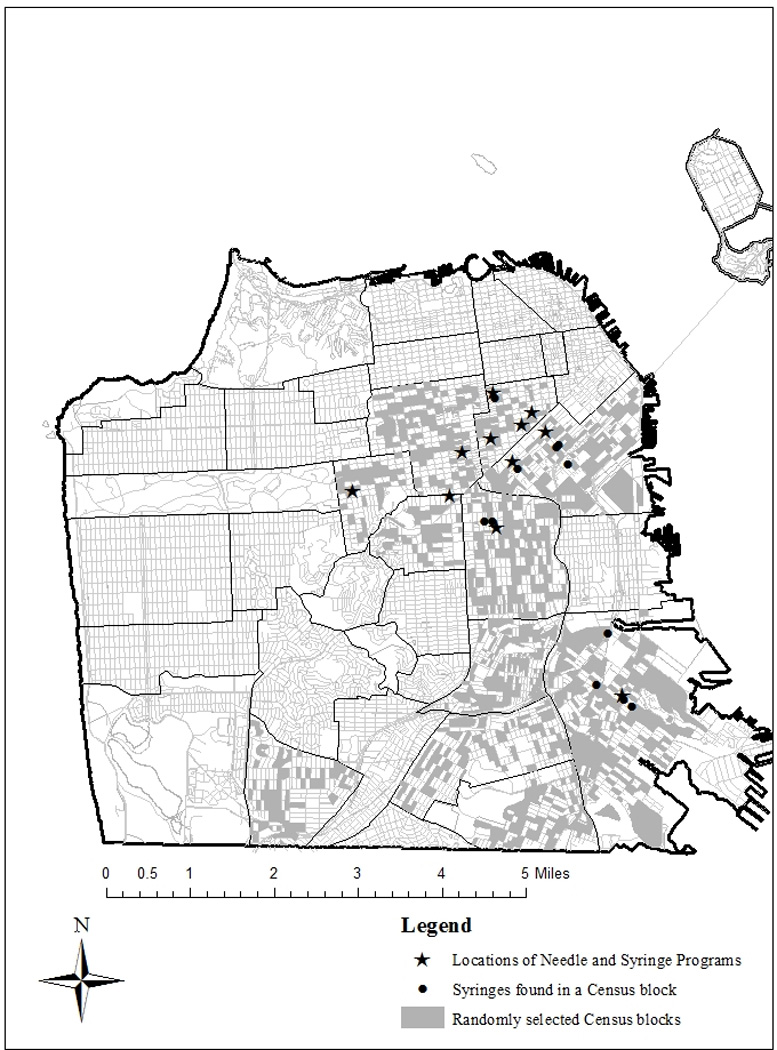

A. Locations of found syringes, San Francisco, CA
B. Locations of found syringes, Miami, FL
3.2. Syringe Disposal Practices reported by IDUs in Quantitative Surveys
Demographic characteristics are presented in Table 1. The majority of respondents in San Francisco and Miami were male and over 40 years of age. Respondents in San Francisco were less likely to be Hispanic (10% vs. 40%, p<0.001) and more likely to be homeless (69% vs. 50%, p<0.001) than respondents in Miami. Fifteen percent of IDUs in San Francisco and 10% of IDUs in Miami self-reported being HIV positive (p<0.05).
Table 1.
Demographic Characteristics of Injection Drug Users in San Francisco (2008) and Miami (2009) and Self-reported Syringe Disposal Locations
| San Francisco (n=602) |
Miami (n=448) |
p value | |
|---|---|---|---|
| Biological sex | |||
| Male | 73% | 79% | 0.045 |
| Female | 26% | 21% | |
| Intersex | <1% | 0% | |
| Race/ethnicity | |||
| White (Non-Hispanic) | 44% | 23% | 0.000 |
| Black (Non-Hispanic) | 37% | 36% | |
| Hispanic | 10% | 40% | |
| Native American | 4% | 1% | |
| Asian or Pacific Islander | <1% | 1% | |
| Multiple Races/Other | 5% | 0% | |
| Age (years) | |||
| 18–29 | 6% | 8% | 0.009 |
| 30–39 | 18% | 20% | |
| 40–49 | 41% | 31% | |
| 50+ | 35% | 41% | |
| Currently homeless | 69% | 50% | 0.000 |
| HIV-positive (self report) | 15% | 10% | 0.014 |
| Syringe Disposal Locations | |||
| Public place | 11.0% | 68.7% | <0.001 |
| Selling/giving away | 12.7% | 12.6% | 0.979 |
| Trash | 52.5% | 66.2% | <0.001 |
| NSP | 61.5% | 0% | - |
| Hospital or clinic | 11.5% | 1.6% | <0.001 |
| Pharmacy | 1.2% | 0% | - |
| Sharps container | 2.3% | 3.8% | <0.077 |
| Flush down the toilet | 15.0% | 2.0% | <0.001 |
| Public disposal box | 7.0% | 0% | - |
| Sewer/manhole | 3.7% | 4.5% | 0.496 |
| Any improper disposal | 64.8% | 96.6% | <0.001 |
Eleven percent of IDUs in San Francisco reported having disposed of syringes in the past 30 days in a public place compared to 69% of IDUs in Miami (p<0.001) (Table 1). Sixty-five percent of IDUs in San Francisco reported any improper disposal in the past 30 days versus 97% of IDUs in Miami (p<0.001). Overall, in San Francisco, 13% (8,474 of 64,259) of syringes disposed by IDUs in the past 30 days were disposed of improperly (Table 2). In Miami, 95% (9,845 of 10,379) of syringes disposed by IDUs in the past 30 days were disposed of improperly. In San Francisco, 1% (718) of syringes were disposed of in a public place, whereas in Miami 45% (4,689) of syringes were disposed of in a public place. In San Francisco, 80% (53,143) of all syringes were disposed at NSPs. No syringes in Miami were disposed at an NSP. In the multivariable logistic regression analysis, after adjusting for age, gender, homelessness, and self-reported HIV seropositivity, IDUs in Miami had over 34 times the adjusted odds of public syringe disposal relative to IDUs in San Francisco (adjusted odds ratio (AOR)=34.2, 95% CI = 21.92, 53.47) (Table 3). Those homeless had almost 5 times the adjusted odds of public disposal (AOR=5.0 95% CI = 3.30–7.46).
Table 2.
Number of Syringes Disposed in the Past 30 Days as Reported by Injection Drug Users in San Francisco (2008) and Miami (2009)
| San francisco (%) | Miami (%) | |
|---|---|---|
| Public place | 718 (1.1) | 4,689 (45.2) |
| Selling/giving away | 680 (1.1) | 675 (6.5) |
| Trash | 5,865 (9.1) | 4,004 (38.6) |
| NSP | 53,143 (82.7) | 0 (0.0) |
| Hospital or clinic | 1,049 (1.6) | 200 (1.9) |
| Pharmacy | 220 (0.3) | 0 (0.0) |
| Sharps container | 238 (0.4) | 334 (3.2) |
| Public disposal box | 1,135 (1.8) | 0(0.0) |
| Sewer/manhole | 136 (0.2) | 234(2.2) |
| Flush down the toilet | 1,026 (1.6) | 163(1.6) |
| Other | 49 (0.1) | 80 (0.8) |
| Total syringes improperly disposed | 8474 (13.2) | 9,845 (94.9) |
| Total syringes disposed | 64,259 | 10,379 |
Table 3.
Self-reported disposal of syringes in a public place: adjusted odds ratios and 95% confidence intervals
| Adjusted Odds Ratio | 95% Cl | |
|---|---|---|
| Miami vs San Francisco | 34.234 | (21.920, 53.467) |
| Female (vs. Male) | 0.599 | (0.395, 0.907) |
| Age (years) | 0.973 | (0.955, 0.992) |
| Homeless | 4.958 | (3.296, 7.457) |
| HIV Positive | 1.391 | (0.845, 2.289) |
| Race/Ethnicity | ||
| Black | 1.000 | |
| White | 1.640 | (1.048, 2.567) |
| Other | 1.298 | (0.563, 2.991) |
| Hispanic | 1.764 | (1.090, 2.856) |
Note: n= 1036
4. DISCUSSION
This study is the first of which we are aware to compare the prevalence of improperly discarded syringes in a city with NSPs and a city without NSPs. We found eight times the number of syringes on walkthroughs in Miami as compared to San Francisco. Our surveys of IDUs in both cities corroborated the walkthrough data, showing that IDUs in Miami are much more likely to dispose of syringes in public places than IDUs in San Francisco. The relative abundance of free syringes in San Francisco compared to Miami might suggest that IDUs in San Francisco possess and therefore dispose of more syringes over a given period of time. However, IDUs in San Francisco disposed of the majority of used syringes at NSPs. These results suggest that NSPs are a significant means of collecting used syringes and do not increase the amount of publically discarded used syringes. Coupled with results from prior studies showing that NSPs help reduce the risk of viral transmission among IDUs, this study suggests that NSPs may also help reduce the risk of transmission to community members at large.
The survey of IDUs in both cities showed that in Miami, IDUs have few alternatives for disposal other than in public areas or the trash—these methods accounted for 83.8% of disposed syringes in the quantitative survey. Any syringe thrown in the trash is both a public health risk to sanitation workers and the general public. Importantly, there were locations in which syringes had accumulated in large quantities in Miami. There were four locations in which there were greater than 10 syringes encountered. Proper disposal venues such as NSPs are needed along with education and social marketing of those venues to IDUs in Miami.
This study has several limitations. First, both the walkthroughs and the survey were conducted in two U.S cities in two different years. While we control for key demographic characteristics, we may not have captured all important variation. Since both cities have similar street cleaning and litter removal policies and walkthroughs were conducted at random times, it is unlikely there was systematic under- or over- estimation of the syringe density as a result of cleanup. Secondly, visual inspection was not conducted of all blocks in these two cities, but rather a random sample of the areas of the cities that were likely most affected. Thirdly, the quantitative surveys relied on self-reported data by study participants which has the potential of being biased by recall and social desirability. However, there is no reason to believe that this bias was differential in these two cities. Fourthly, while our survey field sites were located in neighborhoods with high numbers of IDUs in both cities, we cannot infer that the results generalize to other areas of the cities where syringe disposal behaviors may differ. Finally, while we utilized different sampling techniques, targeted sampling and respondent driven sampling, these two recruitment strategies are the most widely utilized methods for reaching community-based IDUs and have been shown to yield similar distribution of demographic and risk characteristics in four major U.S. cities including one of the study cities, San Francisco (Kral et al., 2010; Robinson et al., 2006). To address limitations of the individual study designs, we used a triangulation approach with a quantitative survey to corroborate the visual inspections.
Despite these limitations, this study provides important comparative data that demonstrates the potential value of NSPs in terms of providing a venue for safe syringe disposal. These findings add to the vast literature that shows the benefits of NSPs (Shalala, 1997) and demonstrate that cities such as Miami may benefit from implementation of NSPs to reduce the transmission of blood-borne diseases to IDUs and other community members.
Acknowledgements
We would like to thank the San Francisco Department of Public Health and the National Institute on Drug Abuse (R01 DA021627-01A1 and R01 DA023377) for funding this study in San Francisco and the CDC-National HIV Behavioral Surveillance and the Developmental Center For AIDS Research (5U62PS000967-02 and 5P30AI073961) for funding the study in Miami. We also would like to thank the following individuals for their contributions to the study: Cindy Changar, Grant Colfax, Allison Futeral, Noah Gaiser, Dara Geckeler, Alexandra Lutnick, Askia Muhammad, Israel Nieves-Rivera, Jeffery Schonberg, and Michele Thorsen, Dano W. Beck, Thomas Saul, Eric Thompson, Kate Duchowny, Cristobal Plaza, Jonathan Kish, Sheila Kaupert, Cheryl Riles, Emelina Martinez, Michael Salvatore, Christopher Hanson, Carlos Sandoval, Irene Hung, Jorge Cepero and Keith Rolle, Maria Duque and Marsha Stevens.
Role of Funding Source
San Francisco Department of Public Health and the National Institute on Drug Abuse (R01 DA021627-01A1 and R01 DA023377) provided financial support for the conduct of this study in San Francisco. The CDC-National HIV Behavioral Surveillance and the Developmental Center For AIDS Research (5U62PS000967-02 and 5P30AI073961) provided financial support for the conduct of this study in Miami. Funders had no further role in study design; in the collection, analysis and interpretation of data; in the writing of the report; or in the decision to submit the paper for publication.
Footnotes
Publisher's Disclaimer: This is a PDF file of an unedited manuscript that has been accepted for publication. As a service to our customers we are providing this early version of the manuscript. The manuscript will undergo copyediting, typesetting, and review of the resulting proof before it is published in its final citable form. Please note that during the production process errors may be discovered which could affect the content, and all legal disclaimers that apply to the journal pertain.
Contributors
Authors Tookes, Kral, Wenger, Martinez, Sherman, Forrest and Metsch designed the study. Author Tookes managed the literature searches and summaries of previous related work. Authors Martinez and Sherman undertook the ArcGIS mapping. Author Tookes conducted the study in Miami. Authors Cardenas and Pereyra undertook the statistical analysis, and author Tookes wrote the first draft of the manuscript. All authors contributed to and have approved the final manuscript.
Conflict of Interest
All authors declare that they have no conflicts of interest.
REFERENCES
- Alter MJ. Occupational exposure to hepatitis C virus: a dilemma. Infect. Control Hosp. Epidemiol. 1994;15:742–744. doi: 10.1086/646850. [DOI] [PubMed] [Google Scholar]
- Bluthenthal RN, Anderson R, Flynn NM, Kral AH. Higher syringe coverage is associated with lower odds of HIV risk and does not increase unsafe disposal among syringe exchange program clients. Drug Alcohol Depend. 2007;89:214–222. doi: 10.1016/j.drugalcdep.2006.12.035. [DOI] [PMC free article] [PubMed] [Google Scholar]
- Bluthenthal RN, Watters JK. Multimethod research from targeted sampling to HIV risk environments. NIDA Res. Monogr. 1995;157:212–230. [PubMed] [Google Scholar]
- California Senate Bill 1159. Disease Prevention Demonstration Project, Vasconcellos, Statutes of 2004. 2004. [Google Scholar]
- City and County of San Francisco Department of Public Works. [Accessed on 9.7.11];Mechanical Street Sweeping Program. http://sfdpw.org/index.aspx?page=322.
- City of San Francisco Department of Public Works. [Accessed on 9.7.11];Community One-Stop: Litter. http://sfdpw.org/index.aspx?page=1111.
- City of Miami Solid Waste Department. [Accessed on 9.7.11];Street Sweeping. http://www.miamigov.com/solidwaste/pages/solidwaste_services/sweeping.asp.
- City of Miami Solid Waste Department. [Accessed on 9.7.11];Mayor’s Clean Up Program. http://www.miamigov.com/SolidWaste/pages/cleanup/default.asp.
- Coffin PO, Latka MH, Latkin C, Wu Y, Purcell DW, Metsch L, Gomez C, Gourevitch MN INSPIRE STUDY GROUP. Safe syringe disposal is related to safe syringe access among HIV-positive injection drug users. AIDS Behav. 2007;11:652–662. doi: 10.1007/s10461-006-9171-x. [DOI] [PubMed] [Google Scholar]
- Daniels D, Grytdal S, Wasley A Centers for Disease Control and Prevention. Surveillance for Acute Viral Hepatitis—United States, 2007. MMWR Surveill. Summ. 2009;58:1–27. [PubMed] [Google Scholar]
- de Montigny L, Vernez Moudon A, Leigh B, Kim SY. Assessing a drop box programme: a spatial analysis of discarded needles. Int. J. Drug Policy. 2010;21:208–214. doi: 10.1016/j.drugpo.2009.07.003. [DOI] [PubMed] [Google Scholar]
- Doherty MC, Garfein RS, Vlahov D, Junge B, Rathouz PJ, Galai N, Anthony JC, Bellenson P. Discarded needles do not increase soon after the opening of a needle exchange program. Am. J. Epidemiol. 1997;145:730–737. doi: 10.1093/aje/145.8.730. [DOI] [PubMed] [Google Scholar]
- Doherty MC, Junge B, Rathouz P, Garfein RS, Riley E, Vlahov D. The effect of a needle exchange program on numbers of discarded needles: a 2-year follow-up. Am. J. Public Health. 2000;90:936–939. doi: 10.2105/ajph.90.6.936. [DOI] [PMC free article] [PubMed] [Google Scholar]
- Florida Statutues. Chapter 893. Sections 893.145, 893.146, 893.147 [Google Scholar]
- Friedman SR, Tempalski B, Cooper H, Perlis T, Keem M, Friedman R, Flom PL. Estimating numbers of injecting drug users in metropolitan areas for structural analyses. J. Urban Health. 2004;81:377–400. doi: 10.1093/jurban/jth125. [DOI] [PMC free article] [PubMed] [Google Scholar]
- Golub ET, Bareta JC, Mehta SH, McCall LD, Vlahov D, Strathdee SA. Correlates of unsafe syringe acquisition and disposal among injection drug users in Baltimore, Maryland. Subst. Use Misuse. 2005;40:1751–1764. doi: 10.1080/10826080500259513. [DOI] [PubMed] [Google Scholar]
- Guardino V, Des Jarlais DC, Arasteh K, Johnston R, Purchase D, Solberg A, Lansky A, Lentine D. Syringe Exchange Programs---United States, 2008. MMWR. 2010;59:1488–1491. [PubMed] [Google Scholar]
- Guydish JR, Clark G, Garcia D, Downing M, Case P, Sorenson JL. Evaluating needle exchange: do distributed needles come back? Am. J. Public Health. 1991;81:617–619. doi: 10.2105/ajph.81.5.617. [DOI] [PMC free article] [PubMed] [Google Scholar]
- Hagan H, Des Jarlais DC, Purchase D, Reid T, Friedman SR. The Tacoma Syringe Exchange. J. Addict. Dis. 1991;10:81–88. doi: 10.1300/J069v10n04_06. [DOI] [PubMed] [Google Scholar]
- Hanrahan A, Reutter L. A critical review of the literature on sharps injuries: epidemiology, management of exposures and prevention. J. Adv. Nurs. 1997;25:144–154. doi: 10.1046/j.1365-2648.1997.1997025144.x. [DOI] [PubMed] [Google Scholar]
- Huriaux E. Personal Communication from the Health Program Coordinator, HIV Prevention Section and Community Behavioral Health Services, San Francisco Department of Public Health. 2010. [Google Scholar]
- Jayanth ST, Kirupakaran H, Brahmadathan KN, Gnanaraj L, Kang G. Needle stick injuries in a tertiary care hospital. Indian J. Med. Microbiol. 2009;27:44–47. [PubMed] [Google Scholar]
- Kerlikowske G, Crowley JS. [accessed on 7.26.10];Expanding Access to Evidence-Based Services for Injection Drug Users. 2010 whitehouse.gov.
- Khoshnood K, Blankenship KM, Pollack HA, Roan CT, Altice FL. Syringe source, use, and discard among injection-drug users in New Haven, Connecticut. AIDS Public Policy J. 2000;15:88–94. [PubMed] [Google Scholar]
- Kral AH, Anderson R, Flynn NM, Bluthenthal RN. Injection Risk Behaviors Among Clients of Syringe Exchange Programs With Different Syringe Dispensation Policies. J. Acquir. Immune Defic. Syndr. 2004;37:1307–1312. doi: 10.1097/01.qai.0000127054.60503.9a. [DOI] [PubMed] [Google Scholar]
- Kral AH, Malekinejad M, Vaudrey J, Martinez AN, Lorvick J, McFarland W, Raymond HF. Comparing Respondent-Driven Sampling and Targeted Sampling Methods of Recruiting Injection Drug Users in San Francisco. J. Urban Health. 2010;87:839–850. doi: 10.1007/s11524-010-9486-9. [DOI] [PMC free article] [PubMed] [Google Scholar]
- Lewis BA, Koester SK, Bush TW. Pharmacists’ attitudes and concerns regarding syringe sales to injection drug users in Denver, Colorado. J. Am. Pharm. Assoc. (Wash.) 2002;42:S46–S51. doi: 10.1331/1086-5802.42.0.s46.lewis. [DOI] [PubMed] [Google Scholar]
- Magnani R, Sabin K, Saidel T, Heckathorn D. Review of sampling hard-to-reach and hidden populations for HIV surveillance. AIDS. 2005;19:S67–S72. doi: 10.1097/01.aids.0000172879.20628.e1. [DOI] [PubMed] [Google Scholar]
- Mathers BM, Degenhardt L, Ali H, Wiessing L, Hickman M, Matick RP, Myers B, Ambekar A, Strathdee SA. HIV prevention, treatment and care services for people who inject drugs: a systematic review of global, regional and national coverage. Lancet. 2010;375:1014–1028. doi: 10.1016/S0140-6736(10)60232-2. [DOI] [PubMed] [Google Scholar]
- Neaigus A, Zhao M, Gyarmathy VA, Cisek L, Friedman SR, Baxter RC. Greater drug injecting risk for HIV, HBV and HCV infection in a city where syringe exchange and pharmacy syringe distribution are illegal. J. Urban Health. 2008;85:309–322. doi: 10.1007/s11524-008-9271-1. [DOI] [PMC free article] [PubMed] [Google Scholar]
- Nyiri P, Leung T, Zuckerman MA. Sharps discarded in inner city parks and playgrounds--risk of bloodborne virus exposure. Commun. Dis. Public Health. 2004;7:287–288. [PubMed] [Google Scholar]
- Prejean J, Song R, Hernandez A, Ziebell R, Green T, Walker F, Lin LS, An Q, Mermin J, Lansky A, Hall HI HIV Incidence Surveillance Group. Estimation of HIV Incidence in the United States. PloS ONE. 2011;6:e17502. doi: 10.1371/journal.pone.0017502. [DOI] [PMC free article] [PubMed] [Google Scholar]
- Riley E, Beilenson P, Vlahov D, Smith L, Koenig M, Jones TS, Doherty M. Operation Red Box. A pilot project of needle and syringe drop boxes for injection drug users in East Baltimore. J. Acquir. Immune Defic. Syndr. Hum. Retrovirol. 1998;18:S120–S125. doi: 10.1097/00042560-199802001-00020. [DOI] [PubMed] [Google Scholar]
- Robinson WT, Risser J, McHoy S, Becker AB, Rehman H, Jefferson M, Griffin V, Wolverton M, Tortu S. Recruiting injection drug users: a three-site comparison of results and experiences with respondent-driven and targeted sampling procedures. J. Urban Health. 2006;83:i29–i38. doi: 10.1007/s11524-006-9100-3. [DOI] [PMC free article] [PubMed] [Google Scholar]
- Shalala DE. Report to the Committee on Appropriations for the Departments of Labor, Health and Human Services, Educations and Related Agencies. 1997. Feb 18, Needle Exchange Programs in America: Review of Published Studies and Ongoing Research. 1997. [Google Scholar]
- Springer KW, Sterk CE, Jones TS, Friedman L. Syringe disposal options for injection drug users: a community-based perspective. Subst. Use Misuse. 1999;34:1917–1934. doi: 10.3109/10826089909039432. [DOI] [PubMed] [Google Scholar]
- Tempalski B, Lieb S, Cleland CM, Cooper H, Brady JE, Friedman SR. HIV prevalence rates among injection drug users in 96 large US metropolitan areas, 1992–2002. J. Urban Health. 2009;86:132–154. doi: 10.1007/s11524-008-9328-1. [DOI] [PMC free article] [PubMed] [Google Scholar]
- U.S. Census Bureau. [Accesed on 7.26.10];American Community Survey, 3-year estimates. 2006–2008 Census.gov.
- Watters JK, Biernacki P. Targeted sampling: options for the study of hidden populations. Soc. Prob. 1989;36:416–430. [Google Scholar]
- Watters JK, Estilo MJ, Cark GL, Lorvick J. Syringe and needle exchange as HIV/AIDS prevention for injection drug users. JAMA. 1994;271:115–120. [PubMed] [Google Scholar]
- Wenger L, Martinez AN, Carpenter L, Geckeler D, Colfax G, Kral AH. Syringe disposal among injection drug users in San Francisco. Am. J. Public Health. 2011;101:484–486. doi: 10.2105/AJPH.2009.179531. [DOI] [PMC free article] [PubMed] [Google Scholar]
- Woodak A, Cooney A. Do needle syringe programs reduce HIV infection among injecting drug users: a comprehensive review of the international evidence. Subst. Use Misuse. 2006;41:777–813. doi: 10.1080/10826080600669579. [DOI] [PubMed] [Google Scholar]