Abstract
Visually impaired people may legally drive if wearing bioptic telescopes in some developed countries. To address the controversial safety issue of the practice, we have developed a low cost in-car recording system that can be installed in study participants’ own vehicles to record their daily driving activities. We also developed a set of automated identification techniques of informative behaviors to facilitate efficient manual review of important segments submerged in the vast amount of uncontrolled data. Here we present the methods and quantitative results of the detection performance for six types of driving maneuvers and behaviors that are important for bioptic driving: bioptic telescope use, turns, curves, intersections, weaving, and rapid stops. The testing data were collected from one normally sighted and two visually impaired subjects across multiple days. The detection rates ranged from 82% up to 100%, and the false discovery rates ranged from 0% to 13%. In addition, two human observers were able to interpret about 80% of targets viewed through the telescope. These results indicate that with appropriate data processing the low-cost system is able to provide reliable data for natural bioptic driving studies.
Index terms: Driving behavior, instrumented vehicle, bioptic driving, natural driving study
I. Introduction
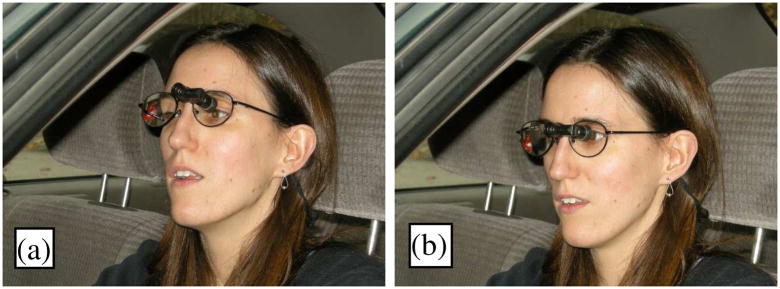
In growing jurisdictions, now including at least 40 US states, the Netherlands [1, 2] and Quebec, Canada, people with moderate vision loss (usually corrected visual acuity between 20/40 and 20/200) may be licensed to drive with bioptic telescopes. In 21 US states, it is even possible for older drivers with age related vision loss to renew their driving license simply by passing the vision test with the telescopes, whereas the other 19 states require a road test with the telescopes [3]. The premise of bioptic driving is that the magnification provided by the telescope can compensate for reduced visual acuity. Most of the time, the users view and scan the environment through the carrier spectacle lenses, with an unrestricted field of vision (Figure 1). They look intermittently and briefly through the telescope by a downward tilt of the head to read road or street signs, determine the status of traffic lights, or scan ahead for road hazards. Although bioptic drivers’ self reports suggest that the telescope helps with driving [4], there is little scientific evidence to either support or oppose the practice. The safety of bioptic driving remains controversial. In years past there has been some opposition to the use of these devices while driving [5–7].
Figure 1.
Visually impaired people may legally drive if wearing bioptic telescope to compensate for their vision loss in some jurisdictions. (a) The bioptic driver views below the telescope most of the time, and (b) looks intermittently through the telescope with brief downward tilts of the head.
To address the controversial issue with data, we are conducting natural bioptic driving studies using a low cost in-vehicle recording system that we have developed. The system can be easily installed in and removed from drivers’ own cars, to capture the bioptic use events as well as other potentially informative behaviors over a long period of time. Use of the telescope can be infrequent in bioptic driving. Our pilot natural recording study [8] found some cases where telescope use was less than once per day. This highlights the need for long term recording of natural driving in order to better understand how telescopes are and should be used. This paper addresses how to handle the vast amount of data collected.
A driver’s car equipped with our recording system actually becomes an instrumented vehicle. Instrumented vehicles have been developed and used in many driving studies for years. Large volumes of data can be collected using these apparatus so that the dynamic driving situations can be reconstructed and evaluated. Some recent recording systems are so elaborate that they fill a minivan and drain up to 2kw power [9]. Although the technology can generate very detailed data in field tests, many of these instrumented vehicles are used on pre- determined driving courses with experimenters on-board [10–14]. Use of consistent driving courses (especially closed courses) allows researchers to control experimental variability and compare across subject groups. However, a disadvantage of this experimental design is that this type of field experiment may not sufficiently reflect what actually happen in real life because: (a) the drivers may perform differently in field testing with experimenters on-board with them, (b) rarely occurring events important for safety assessment may not be provided at a sufficient frequency, and (c) truly hazardous conditions that occur naturally cannot be introduced ethically.
To address these limitations, a growing trend in recent driving studies is to apply instrumented vehicle technology in natural driving conditions [15]. The drivers perform their daily activities as usual and the recording systems installed in their vehicles record video, GPS, acceleration, and other parameters whenever and wherever the drivers go. For instance, to understand factors contributing to crashes, the 100-car project conducted by the Virginia Tech Transportation Institute recorded 43,000 hours and 2 million miles of driving by 241 drivers over one year [16]. They were able to capture 82 crashes (mostly minor physical contact, with 15 reported to the police). Such data are unobtainable in traditional field driving tests. While the advantages of recording natural driving are many, a problem that needs to be addressed is how to analyze the vast amount of recorded data where there isn’t a crash involved. An effective way proposed here is to identify potentially informative segments by automated screening methods.
Assessment of behaviors and performance in a variety of non-crash situations has been widely used in field experiments, driving simulation studies, and road tests for licensure. It is also sensible for natural driving studies to examine some informative non-crash driving segments. In the 100-car project, event triggers were set for segments with high lateral or longitudinal acceleration [17]. West et al. studied red light running incidents in more than 1,000 older drivers based on 5-day recording of habitual driving [18]. They found an association between reduced attentional visual field and failure to stop at red lights. In their study, red light running was interpreted by observers manually reviewing the recorded videos. They were able to locate the segments of driving through traffic lights by using a geographic database of traffic lights in the Maryland area. Thus, the reviewing work was efficient and practical.
To conduct natural bioptic driving studies, we will need a compact and robust recording system that can be easily installed in any driver’s car, and also can provide sufficient data that allow us to identify a variety of informative segments. In this paper, we present the computational methods for detecting six types of segments associated with particular maneuvers and behaviors, and evaluate the detection performance to demonstrate the reliability of our automated screening techniques based on the low cost system. Such an evaluation is necessary before putting the system into use, because we need to know if too much information might be missed.
In addition, we also evaluated the accuracy of human observers’ interpretation of targets viewed through the telescope. Although eye tracking technology has long been used in driving studies, it is mostly used for analysis of eye movement characteristics. We have not seen any report that evaluates gaze interpretation. The accuracy of our telescope tracking technique is slightly better than 1° [19], but many objects drivers look at are smaller than 1°. For example, at 50m, a 24-inch stop sign is a little less than 0.7°, and at 200m, the width of sedan car is about 0.5°. We hypothesize that observers can use common sense and driving context from the videos to interpret the targets gazed correctly, even with the common level of errors in tracking.
II. Methods
A. Recording System
The recording system was built based on a commercial mobile digital video recorder (MDVR), WT-65N (Witchol, China). Similar products are widely available on the market, and they typically cost a few hundred US dollars. It can record 4 video channels (each 352×240 pixels, 30Hz), GPS coordinates (0.5Hz), XYZ acceleration (30Hz), vehicle speed, and multiple ON/OFF signals (1Hz), including turn signals and braking. We chose low cost micro cameras (resolution: 450 lines) that are intended for surveillance use.
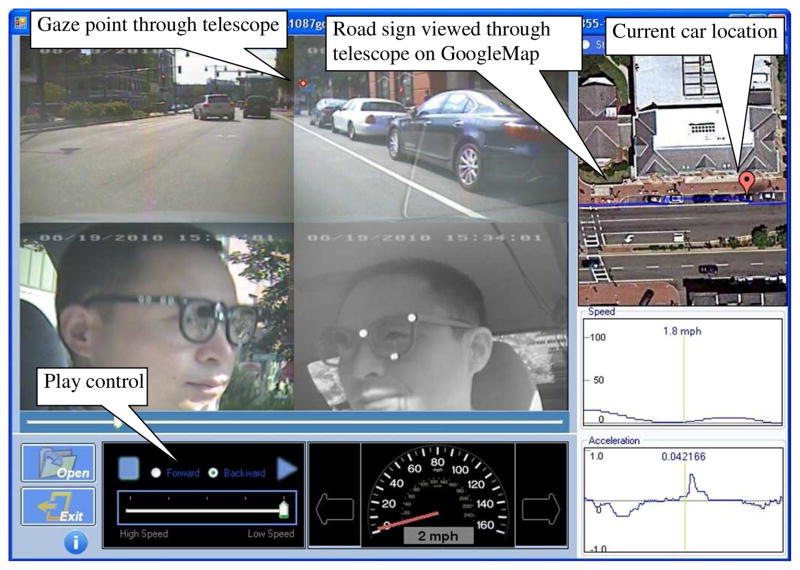
To collect data that meet the requirement of our driving study, we used two side-by-side scene cameras to provide an 88°×33° forward view, which is almost as wide as the view the driver has through the windshield (about 90°×30°) [20]. In spite of a very wide view, the resolution of traffic and road images is not compromised. This is crucial for interpretation of targets viewed through the telescope as described below. If a single wide angle camera were used to provide the same horizontal field of view, a large portion of the image would be empty sky and the resolution would be low. An infrared camera equipped with an infrared LED illuminator and a band pass filter is used for robust head movement tracking in the real world driving conditions. The tracking technique allows detection of bioptic use and estimation of gaze through the telescope with slightly better than 1° accuracy across a wide field of view [19]. Importantly, the tracking technique requires only one-time calibration when the system is installed in a car. Calibration is not needed for each drive. Thus, it is well-suited to natural driving over extended periods. Figure 2 shows a dedicated reviewing interface we have developed that presents all the recorded and processed data graphically to experimenters.
Figure 2.
A snapshot of the playback interface we have developed for reviewing recorded and processed data. This interface can play recorded videos and vehicle “black box” data, and also present the tracked gaze point through the telescope on the scene images (red circle). Once viewed targets are visually interpreted, it is possible to measure the viewing distance (for permanent objects) on the integrated Google Map panel. The distance can also be used for parallax correction in order to achieve more accurate registration of the gaze point on scene images.
B. Data Collection
Using the recording system, one normally sighted subject (male, 41 years old) recorded his daily driving activities (GPS data only) in the metropolitan Boston area for 10 days within 3 weeks. Comprehensive data including 1.4 hours of video, acceleration data, and vehicle black box data were also recorded from him in test drives near downtown Boston on 2 consecutive days, in which he purposely made weaving maneuvers and rapid stops, and used a bioptic telescope a number of times, when the traffic situation was safe to do so. Telescope tracking calibration was performed only once on the first day. A passenger recorded the times of weaving, rapid stop and bioptic use events, as well as the targets viewed through the telescope (as called out by the driver). The notes were used as the ground truth to evaluate the accuracy of automated detection, and interpretation of viewed targets. The subject drove a total distance of 503km and the total driving time was 12.1 hours. These data were not used for parameter tuning of the detection algorithms described below.
We also collected about 1.4 hours of driving data from two visually impaired drivers (one 18-year old female, one 51-year old male) when they participated in another driving performance assessment experiment. The road tests were conducted on different days on the same 11.2-km route in the busy Longwood medical area of Boston. The subjects drove a dual-brake controlled car following instructions given by a driving instructor, while an occupational therapist in the back seat scored their performance and made notes regarding all relevant events. The subjects used their own habitual bioptic telescopes. Targets viewed with their telescopes were not called out and recorded, because it could distract the visually impaired subjects and compromise safety.
The study was conducted in accordance with the tenets of the Declaration of Helsinki. All participants signed a consent form approved by the Schepens Eye Research Institute institutional review board.
C. Detection of Curves
Torbic [21] reported that for the general driving population crash rate on curve roads is approximately three times that on straight sections, and Vogt [22] reported that crashes are correlated with degree of curved road. Driving through curves was also reported to be difficult by some bioptic drivers, especially when driving at high speed [23]. Therefore, it is of interest to detect curved segments.
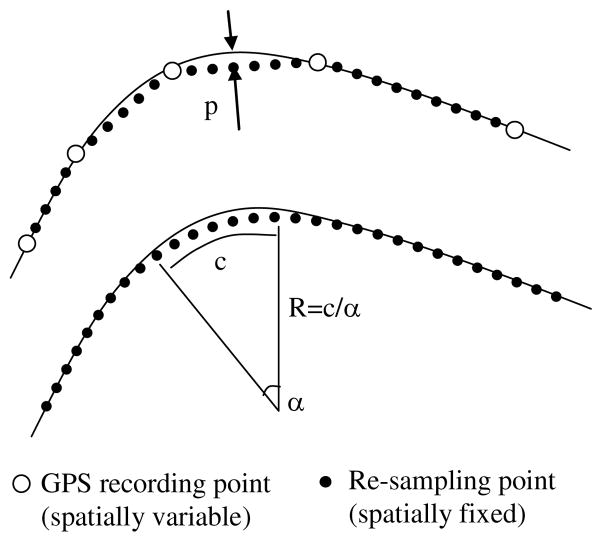
Curves are detected by computing change in direction along the driving route. This requires that the direction be calculated based on spatially fixed sampling (equal distance between samples), but the recorder saves GPS data at a fixed temporal frequency (0.5Hz). To correct for the variable distance intervals provided by the GPS, the whole route was first resampled at a fixed resolution of 1m by means of linear interpolation, and then smoothed using a 10-point moving window to approximate the curves (Figure 3). This processing has a similar effect as non-linear regression, but it is much easier to do. Theoretically, reconstructed curves by this processing will have slightly shorter radii than the real ones, but the difference is negligible. Given the 0.5Hz sampling frequency of our GPS data, the maximum error, measured as the distance between the top of an arc and the chord (indicated as p in Figure 3), will be merely 1m if one drives at speed of 102, 72 and 51km/h at curves of radius 400, 200 and 100m, respectively. In addition, the smoothing can further reduce the error. Curve segments are identified from the resampled data by detecting change in direction. Curve radius can be computed according to the arc length and central angle.
Figure 3.
Curve detection. Given spatially variable GPS samplings (due to change in speed), the driving route is resampled at a fixed spatial step by linear interpolation (top), and the resampled data are smoothed to approximate the shape of the driving path. The approximation error will be smaller than p, the distance between arc top and chord. Curve radius (R) can be estimated based on arc length (c) and turning angle (α).
D. Detection of Turns
Making turns generally requires careful visual examination of the traffic situations and upcoming roads. Behaviors at turns are often studied in normally sighted drivers [24]. The visual demands of turning may be even more challenging for drivers with impaired vision.
In this paper, turns are not treated as curves with small radii, because the low GPS sampling rate may not provide sufficient samples for such analysis. To detect turns, GPS recordings are first down-sampled by discarding some intermediate sampling points such that the resulting two consecutive sampling points are at least 15m apart. This down-sampling results in short segments along the driving path, as shown in Figure 4. Turns are detected by computing the direction change between a segment and the next non-adjacent segment. If there is a turning point within the skipped segment, the examined angle change equals the actual turning angle. The turn detection is carried out by treating each segment as the skipped segment sequentially. The threshold for turn detection was 45°.
Figure 4.
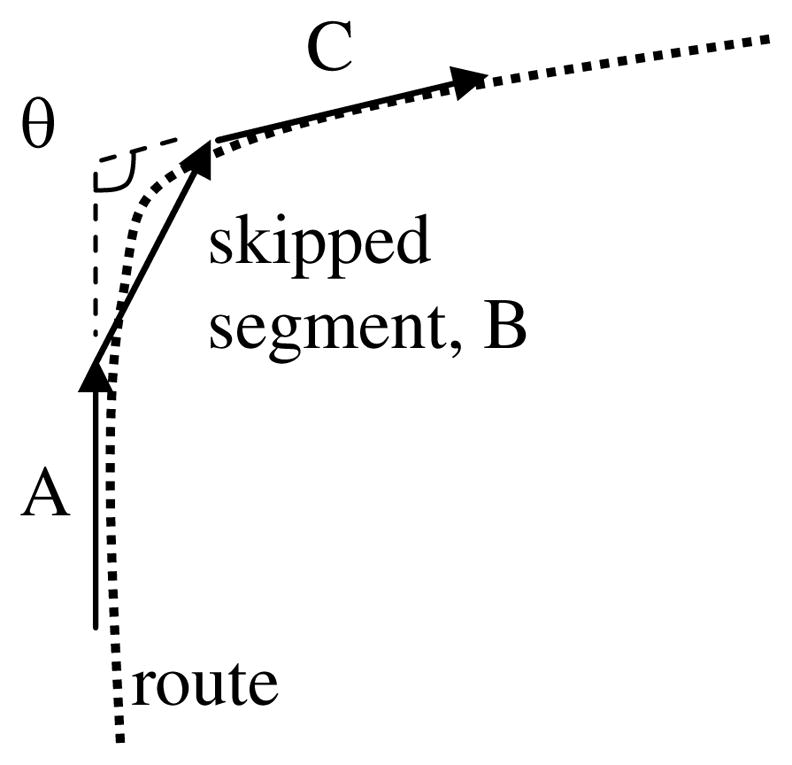
Turn detection by examining the change in direction between segments A and C with a skipped segment B in between. If a turning point is within the skipped segment B, the change in direction will equal the actual turning angle.
E. Detection of Left Turns at Major Intersections
As most crashes occur at intersections, observing behavior when driving through intersections is important for evaluation of driving skills [25, 26]. Turning left at intersections is more challenging than turning right in countries that drive on the right, since it may be across traffic. We are particularly interested in behavior of visually impaired drivers when they make left turns at major road intersections, where traffic is usually heavy.
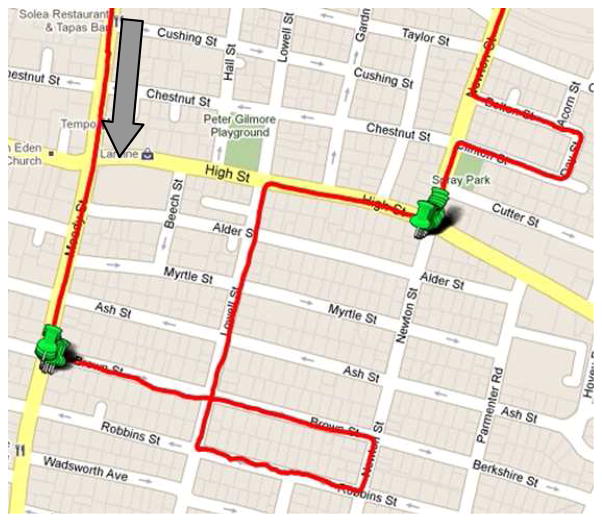
We have created a database of geographic coordinates of 654,491 intersections and interchanges in the New England area (Connecticut, New Hampshire, Maine, Massachusetts, Rhode Island, and Vermont), including road class information (highway, major road, local street etc). Using the turn detection technique above and this database, we can identify left turns at major intersections (Figure 5). The major roads included in this experiment are those shown in yellow on Google Earth or Google Maps. Similar techniques can be used to identify other maneuvers, such as right turns at major intersections or straight through, but they were not tested for this paper.
Figure 5.
Detection of left turns on major roads (shown in yellow) by filtering left turn detection results with road class data at intersections. Note that the two left turns at minor intersections are not flagged, nor are the right turns.
F. Detection of Weaving Maneuvers
Maintaining lane position is an important driving skill which may be affected by impaired vision especially during bioptic use. On the other hand, steering changes may also occur in response to certain traffic situations (swerving to avoid pedestrians, animals, or objects on the road, for example), which require awareness of the surrounding situation, correct judgment, and appropriate skill operating the vehicle. Because visually impaired drivers may spot those situations late (short eye lead time), they might make more weaving maneuvers than normally sighted drivers. In addition, looking through telescopes for too long may affect steering stability, which is referred as “bioptic weave”. We are thus interested in their driving performance before and during weaving events.
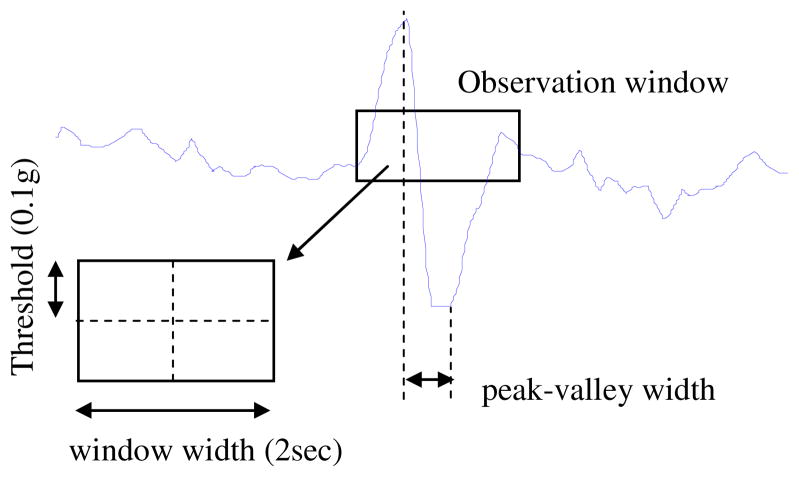
Abnormal weaving maneuvers usually feature one cycle of sinusoid pattern in the lateral acceleration signal. As Figure 6 shows, a weaving maneuver is marked if there is such a signal within a sliding observational window that meets the following criteria: (a) there is a peak above a positive threshold and a valley below a negative threshold; (b) the peak and the valley fall into different half sides of the window; and (c) the peak-valley width is smaller than the window width. In this report, the threshold used is 0.1g, and the window width is 2sec. Before the weaving detection, the lateral acceleration signal was filtered using a 10-point moving window.
Figure 6.
Detection of a weaving maneuver. A peak and a valley in the lateral acceleration signal must be present within the observation window.
G. Detection of Rapid Stops
Rapid stops may indicate crashes, near-crashes or responses to urgent situations. Distractions can often cause late detection of hazards, and then lead to rapid stops. Traffic situations and drivers’ behaviors before rapid stops provide important information about their performance [27].
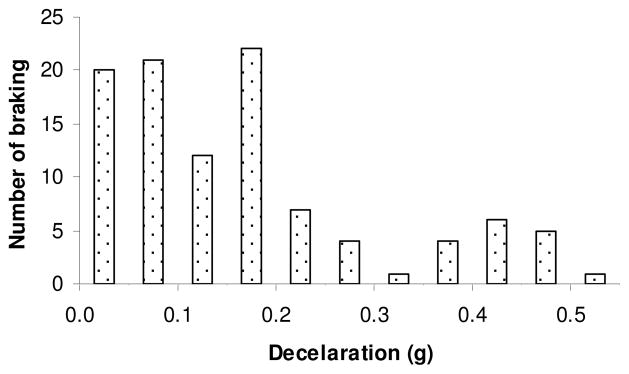
Rapid stops can be detected easily by looking for longitudinal deceleration above a certain threshold. A threshold of 0.45g has been used to detect rapid stops for teenage drivers [27]. Different thresholds should be used for different cohorts. The purpose of rapid stop detection is to identify the rapid stops obviously different from the driver’s normal behavior, but there is no gold standard for what difference is “obvious” for each individual. We can choose those above a certain percentile, depending on how many rapid stop segments we want to review. In this paper, we chose those above 99.87%, which is equivalent to a common practice that uses 3 times the standard deviation to identify outliers for normally distributed data, although braking deceleration might not be normally-distributed. According to our normally sighted subject’s ordinary 178-km non-test driving on other days, his 99.87 percentile was 0.349g. Therefore, we selected 0.35g as the rapid stop threshold for him. Comparing with his braking deceleration data in the test drive, in which he purposely applied hard braking a number of times, this threshold is consistent with a trough point of a bimodal distribution (see Figure 7). For the two bioptic drivers, we used their individual 99.87 percentile as the threshold.
Figure 7.
Histogram of peak deceleration because of braking. Results are from the test drive of the normally sighted subject, who purposely applied hard braking a number of times. The trough point of the bimodal distribution is consistent with the 99.87 percentile level of his braking in other non-test natural driving sessions.
H. Detection of Bioptic Use
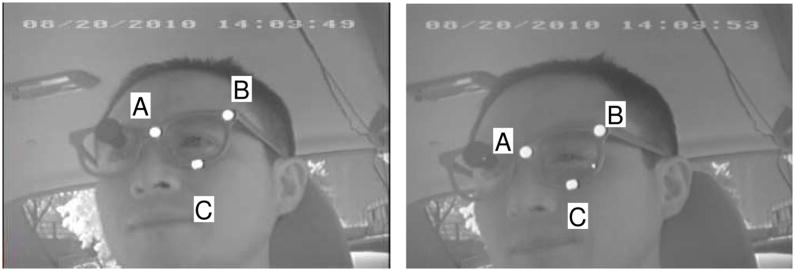
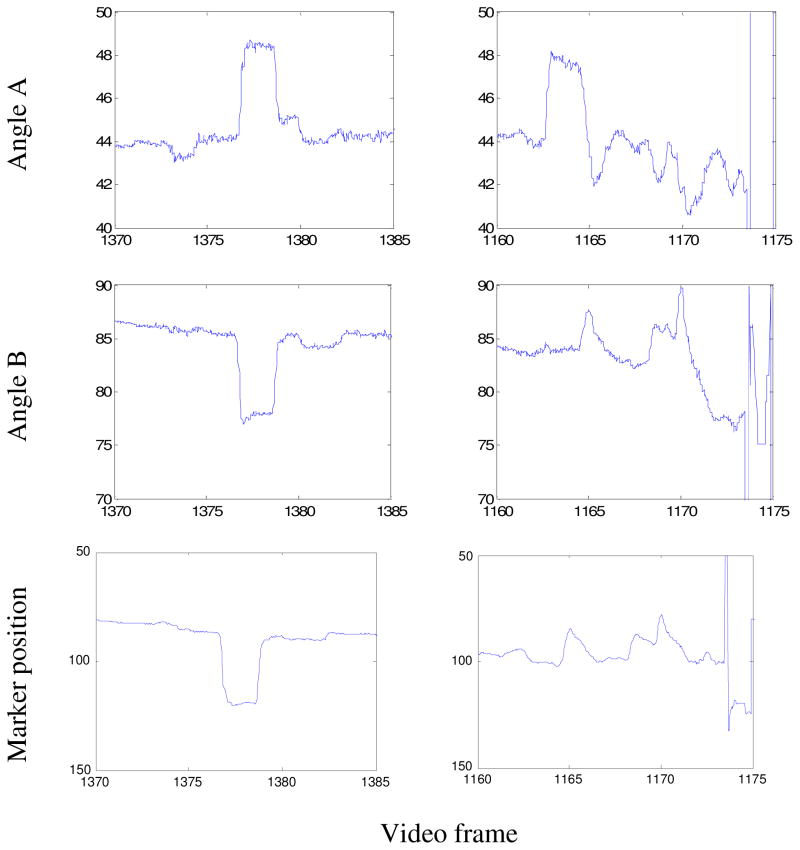
How and when the telescope is used is of the utmost interest for bioptic driving studies. To look through the telescope, the wearer makes a quick downward head tilt that aligns the eye with the telescope (Figure 8). In our system, the downward head movement causes a change in the angles of the reflective marker triangle image. We have developed a technique to estimate the telescope aiming point (registered on the scene image) based on the angles [19]. However, other head movements, for instance lateral head movements, can also cause the angles to change. Therefore, both the angles and the vertical coordinates of the markers are used to detect bioptic use. Actual bioptic use should feature characteristic changes in at least one of the angles as well as a downward change in the marker position (see Figure 8 and Figure 9 left column). If either criterion is not met, the action is not flagged as a use of the telescope (Figure 9 right column).
Figure 8.
When making a downward head tilt to look through the telescope, the angles of the reflective marker triangle change. The angles are used to estimate the telescope aiming point.
Figure 9.
Detection of bioptic telescope use based on change in marker positions and change in one of the two angles of the marker triangle. The left column is a bioptic use, and the right column is not, because no signature signal is found in the marker position.
I. Ground Truth
Ground truth for curves in the driving routes was manually marked using a MATLAB program we designed. Observers first visually identified a curve within a route plotted by the program. Then the start and end points of the curve were selected by checking the tangent points between the curve and two straight lines plotted before and after the curve. The program fitted a circle to the selected segment and computed the circle’s radius, arc length and direction change. Criteria for included curves were: radius between 50 m and 400 m, and curve length longer than 200m or change in direction from the start to the end of the curve larger than 40° if the length is shorter than 200m. Using these criteria, 86 curves were manually marked on Google Earth, to be compared visually with automated detection results.
The recorded driving routes were visually examined using Google Earth, and 128 left turns and 111 right turns were manually marked. The only criterion for turns was a turning angle of at least 40°. The automated detection of turns was compared with the locations marked on Google Earth.
Similarly, 78 left turns at major intersections (turning onto or off major local roads) were manually marked on Google Earth. The automated detection of these intersections was then compared with the manual markings on Google Earth.
There were 17 rapid stops, 17 weaving maneuvers and 37 bioptic use events purposely made by the normally sighted subject, and they were compared with automated detection results based on occurrence time. There was no weaving behavior made by the visually impaired subjects in the road tests, and there were two rapid stop events noted by the occupation therapist. By watching the videos, we identified 127 bioptic use events in total by the two visually impaired subjects.
III. Results
A. Detection of Maneuvers and Behaviors
The detection rates of the six types of informative maneuvers and behaviors are shown in Table 1. Missed detection and false discovery rates (ratio of false alarm and total detection) of turns were all due to GPS recording error and slight turns (much less than 90°) that were similar to curves. Our algorithm is able to filter out obvious GPS errors – a sudden jump of a few hundred meters, for example – but not for small errors due to signal obstruction by buildings and overpasses. Most inconsistencies for curve detection occurred at curves with varying radii, typically with a larger radius near the start and end of a curve and smaller radius in the middle. The observers’ selection of the start and end points of a curve could be different from the detection algorithm, and this caused some curves near the criteria limits to be included in one but not the other. Some of the missed detection of left turns at major intersections were because those intersections were missing in our database. Updating the database should address the problem. The other missed turns at intersections and false discoveries were due to incorrect detection of turns: turns similar to curves or curves similar to turns.
Table 1.
Detection rates of informative Maneuvers and behaviors.
| Maneuvers/Behaviors (n) | Detection rates % (n) | False discovery rates* % (n) |
|---|---|---|
| Turns (239) | 99.2 (237) | 4.8 (12) |
| Curves (86) | 84.9 (73) | 3.9 (3) |
| Left turns at major intersections (78) | 93.6 (73) | 3.9 (3) |
| Rapid stops (19) | 94.7 (18) | 0 (0) |
| Weaving maneuvers (17) | 100 (17) | 0 (0) |
| Bioptic use (164) | 81.7 (147) | 12.9 (19) |
False discovery rate: ratio of false alarm and total detection
The rapid stop events include a “real” one by each visually impaired subject. Both were noted by the occupation therapist, and correctly detected by using the 99.87% threshold. One subject did not see a 4-way stop sign, and made a rapid stop after the driving instructor’s verbal intervention. The other subject “almost went through yellow light, but changed his mind”, and made a rapid stop. The visually impaired drivers did not have weaving events, based on the occupational therapist’s judgment. Automated detection did not detect any weaving events.
Missed detections of bioptic use were mainly due to tracking failures, which occurred due to out-of-sight markers when the drivers’ heads turned to the far right side (out of windshield), or interference from the background, such as direct sunlight on the driver’s face near the glasses and reflections on the glasses. For all the recorded videos, the markers were tracked for 93% of the time. The false discovery rate for bioptic use events is higher than the other events. The majority of the false alarms were indeed head tilts, but the subjects just did not look through the telescopes.
B. Interpretation of Bioptic Use
Objects viewed through the telescope by the normally sighted bioptic driver were visually interpreted by two observers, based on the telescope aiming points registered on the scene video images (see Figure 2). All manually-noted bioptic use events were examined. Because the resolution of the scene image was limited (704×240pixels), for distant objects the observers sometimes needed to continue watching the video until the car drove closer to the targets. In some cases there were more than one potential targets in the indicated viewing direction. In such cases, the observers used their judgment to select the likely target.
Among the 37 noted bioptic use events, one was discarded because there was no telescope tracking data available (but it was included in the statistics evaluation of automated detection). The two observers watched 36 video segments (15 seconds long) of noted bioptic use events, and they correctly interpreted 83.3% and 77.8% of viewed targets, respectively. There were 3 events (8.3%) that both observers interpreted incorrectly because the tracking was erroneous. The other incorrect interpretations (8.3% and 13.9%, respectively) were due to ambiguous targets.
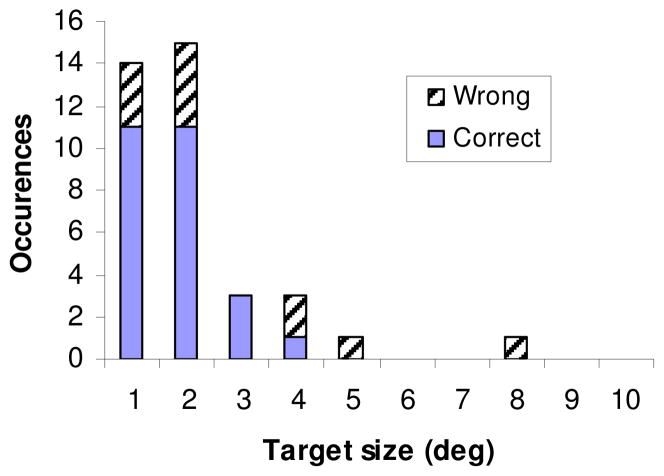
The median target angular size (measured as the mean of vertical and horizontal sizes) at telescope viewing distance was 1°. About 80% of the targets were smaller than 2°. Targets incorrectly interpreted were not necessarily small (Figure 10), with a median size of 2.4° and 1.4° for the two observers, respectively. A 5° target was incorrectly interpreted by both observers, and an 8° target was incorrectly interpreted by one observer.
Figure 10.
Histogram of angular size of targets viewed through the telescope by the normally sighted subject. Most targets were smaller than 2°. Striped portion represents targets incorrectly interpreted by at least one of the observers. These targets were not necessarily small.
IV. Conclusions
We have developed an in-vehicle recording system, based on a commercial mobile DVR, to study daily bioptic driving activities by visually impaired drivers. Easy integration and low cost of hardware development allowed us to spend most of our resources on data analysis. This work has practical value for researchers who need a simple form of instrumented vehicle technology. Using a set of automated analysis techniques, we are able to identify a range of driving behaviors that are relevant to bioptic driving. Most of the methods and findings can be applied to driving studies of other populations. The contribution of this paper is to show quantitatively that automated screening of natural driving data can be reliable based on the low-cost system and relatively simple data processing. Such systems would be more suitable for natural driving studies that involve many participants than sophisticated and expensive in-vehicle recording systems.
We argue that evaluation of a small number of selected segments associated with specific behaviors in natural driving conditions can be a practical and efficient approach for driving performance evaluation. We are conducting experiments to provide additional evidence to the claim.
Assuming all the detected curves (73), left turns at major intersections (73), rapid stops (18), weaving maneuvers (17), and bioptic use events (147) were all to be evaluated, and each evaluation segment is 15 seconds long, the total recorded 13.5 hours of driving would be reduced to 82 minutes (10%), making effective and comprehensive reviewing possible. Of course, the evaluation would take more than 82 minutes, as the observers may chose to view a single event more than once, but it will still result in very significant time savings.
Some informative maneuvers (e.g. weaving) may be different in amplitude as well as occurring frequency from driver to driver. Generally, it would be ideal that the parameters in the detection algorithms can be adaptively changed and tuned based on a large sample. However, at current stage, our first priority is to detect the rarely occurring events in natural driving as many as possible by using liberal thresholds, which is the same strategy used in the 100-car study on crashes [17]. This may cause increased number of false alarms, but it is not our first concern as long as the manual reviewing effort to reject them is much more affordable than reviewing all data. Given the practical restriction that there is no gold standard for unusual behaviors, using liberal thresholds at current stage becomes more sensible than using conventional methods, such as ROC, to find a balance between detection and false alarm rates.
In addition, our experiment interpreting bioptic usage demonstrates for the first time with data that interpretation of gaze (through telescope) for driving studies is reasonably accurate, as about 80% of the gaze targets were correct. Even if targets are smaller than the tracking accuracy, they can be generally interpreted correctly. The main challenge is not target size, but ambiguous potential targets near the gaze point. This finding can be applied to other gaze tracking data in different driving studies.
Acknowledgments
Supported by NIH grants: AG034553 (GL), EY12890 (EP). We thank Jeff Blossom, Center for Geographic Analysis of Harvard University, for helping create the intersection database, Jie Tang, Kathryn Recker, Xu Zhou and Akarsha Ramani for data processing.
References
- 1.Kooijman A, Melis-Dankers B, Peli E, Brouwer W, Pijnakker P, Van Delden G, Van Pluuren E, Van Iddinge B, Derksen P, Busscher R, Bredewoud R, Van Rosmalen J, Postema F, Wanders, De Vries J, Witvliet J. The Introduction of Bioptic Driving in The Netherlands. Visual Impairment Research. 2008;10:1–6. doi: 10.1080/13882350802053582. [DOI] [PMC free article] [PubMed] [Google Scholar]
- 2.Melis-Dankers B, Kooijman A, Brouwer W, Busscher R, Bredewoud R, Derksen P, Amersfoort A, Ijsseldijk M, Van Delden G, Grotenhuis T, Witvliet J. A Demonstration Project on Driving with Reduced Visual Acuity and a Bioptic Telescope System in the Netherlands.pdf. Visual Impairment Research. 2008;10:7–22. doi: 10.1080/13882350802053582. [DOI] [PMC free article] [PubMed] [Google Scholar]
- 3.Peli E, Peli D. Driving with confidence: a practical guide to driving with low vision. Singapore: World Scientific Publishing Company; 2002. [Google Scholar]
- 4.Bowers A, Apfelbaum D, Peli E. Bioptic telescopes meet the needs of drivers with moderate visual acuity loss. Investigative Ophthalmology & Visual Science. 2005;46:66–74. doi: 10.1167/iovs.04-0271. [DOI] [PubMed] [Google Scholar]
- 5.Fonda G. Bioptic telescopic spectacle is a hazard for operating a motor vehicle. Arch Ophthalmol. 1983;101:1907–1908. doi: 10.1001/archopht.1983.01040020909015. [DOI] [PubMed] [Google Scholar]
- 6.Tallman CB. Bioptic telescopic spectacle: a hazard for operating a motor vehicle? Arch Ophthalmol. 1984;102:1119–20. doi: 10.1001/archopht.1984.01040030901001. [DOI] [PubMed] [Google Scholar]
- 7.Fonda G. Training in use of the bioptic telescopic spectacle (BTS) for driving is unreasonable. Transactions - Pennsylvania Academy of Ophthalmology and Otolaryngology. 1988;40:716–8. [PubMed] [Google Scholar]
- 8.Luo G, Peli E. Recording and automated analysis of naturalistic bioptic driving. Ophthalmic and Physiological Optics. 2011;31:318–325. doi: 10.1111/j.1475-1313.2011.00829.x. [DOI] [PMC free article] [PubMed] [Google Scholar]
- 9.Perez A, Garcia MI, Nieto M, Pedraza JL, Rodriguez S, Zamorano J. Argos: An Advanced In-Vehicle Data Recorder on a Massively Sensorized Vehicle for Car Driver Behavior Experimentation. IEEE Transactions on Intelligent Transportation Systems. 2010;11:463–473. [Google Scholar]
- 10.Boyce TE, Geller ES. An instrumented vehicle assessment of problem behavior and driving style: Do younger males really take more risks? Accident Analysis and Prevention. 2002;34:51–64. doi: 10.1016/s0001-4575(00)00102-0. [DOI] [PubMed] [Google Scholar]
- 11.Victor TW, Harbluk JL, Engstrom JA. Sensitivity of eye-movement measures to in-vehicle task difficulty. Transportation Research Part F-Traffic Psychology and Behaviour. 2005;8:167–190. [Google Scholar]
- 12.Engstrom J, Johansson E, Ostlund J. Effects of visual and cognitive load in real and simulated motorway driving. Transportation Research Part F-Traffic Psychology and Behaviour. 2005;8:97–120. [Google Scholar]
- 13.Horrey WJ, Lesch MF, Garabet A. Assessing the awareness of performance decrements in distracted drivers. Accident Analysis and Prevention. 2008;40:675–682. doi: 10.1016/j.aap.2007.09.004. [DOI] [PubMed] [Google Scholar]
- 14.Reimer B. Impact of Cognitive Task Complexity on Drivers’ Visual Tunneling. Transportation Research Record. 2009:13–19. [Google Scholar]
- 15.Hanowski RJ, Wierwille WW, Dingus TA. An on-road study to investigate fatigue in local/short haul trucking. Accident Analysis and Prevention. 2003;35:153–160. doi: 10.1016/s0001-4575(01)00098-7. [DOI] [PubMed] [Google Scholar]
- 16.Neale V, Dingus T, Klauer J, Goodman M. An Overview of The 100-Car Naturalistic Study and Findings. 19th ESV Conference; 2005. [Google Scholar]
- 17.NHTSA, “The 100-Car Naturalistic Driving Study Phase II – Results of the 100-Car Field Experiment,” DOT HS 810–593, 2006.
- 18.West SK, Hahn DV, Baldwin KC, Duncan DD, Munoz BE, Turano KA, Hassan SE, Munro CA, Bandeen-Roche K. Older drivers and failure to stop at red lights. J Gerontol A Biol Sci Med Sci. 2010;65:179–83. doi: 10.1093/gerona/glp136. [DOI] [PMC free article] [PubMed] [Google Scholar]
- 19.Fu X, Luo G, Peli E. Telescope Aiming Point Tracking Method for Bioptic Driving Surveillance. IEEE Transactions on Neural Systems and Rehabilitation Engineering. 2010;18:628–636. doi: 10.1109/TNSRE.2010.2052131. [DOI] [PMC free article] [PubMed] [Google Scholar]
- 20.Vargas-Martin F, Garcia-Perez MA. Visual fields at the wheel. Optometry and Vision Science. 2005;82:675–681. doi: 10.1097/01.opx.0000175624.34252.73. [DOI] [PubMed] [Google Scholar]
- 21.Torbic DJ, Harwood DW, Gilmore DK, Pfefer R, Neuman TR, Slack KL, Hardy KK. A Guide for Reducing Collisions on Horizontal Curves. NCHRP Report 500: Guidance for Implementation of the AASHTO Strategic Highway Safety Plan. 2004 [Google Scholar]
- 22.Vogt A, Bared J. Accident Models for Two-Lane Rural Segments and Intersections. Transportation Research Record: Journal of the Transportation Research Board. 1998;1635:18–29. [Google Scholar]
- 23.Spitzberg L. A patient’s experience on driving with a bioptic. Journal of Vision Rehabilitation. 1991;5:17–21. [Google Scholar]
- 24.Chan CY. Characterization of driving behaviors based on field observation of intersection left-turn across-path scenarios. IEEE Transactions on Intelligent Transportation Systems. 2006;7:322–331. [Google Scholar]
- 25.Hakamies-Blomqvist LE. Fatal accidents of older drivers. Accid Anal Prev. 1993;25:19–27. doi: 10.1016/0001-4575(93)90093-c. [DOI] [PubMed] [Google Scholar]
- 26.Al-Ghamdi AS. Analysis of traffic accidents at urban intersections in Riyadh. Accid Anal Prev. 2003;35:717–24. doi: 10.1016/s0001-4575(02)00050-7. [DOI] [PubMed] [Google Scholar]
- 27.Simons-Morton B, Ouimet M, Wang J, Klauer S, Lee S, Dingus T. Hard braking events among novice teenage drivers by passenger characteristics. Fifth International Driving Symposium on Human Factors in Driver Assessment, Training and Vehicle Design; 2009. [DOI] [PMC free article] [PubMed] [Google Scholar]


