Abstract
The kinetic stabilities and relaxivities of a series of Eu2+-containing cryptates have been investigated. Transmetallation studies that monitored the change in the longitudinal relaxation rate of water protons in the presence of Ca2+, Mg2+, and Zn2+ demonstrated that cryptate structure influences stability, and two of the cryptates studied were inert to transmetallation in the presence of these endogenous ions. The efficacy of these cryptates was determined at different magnetic field strengths, temperatures, and pH values. Cryptate relaxivity was found to be higher at ultra-high field strengths (7 and 9.4 T) relative to clinically relevant field strengths (1.4 and 3 T), but the efficiency of these cryptates decreased as temperature increased. In addition, variation in pH did not yield significant changes in the efficacy of the cryptates. These studies establish a foundation of important properties that are necessary to develop effective positive contrast agents for magnetic resonance imaging from Eu2+-containing cryptates.
Keywords: Cryptands, Imaging agents, Lanthanides
Introduction
Most paramagnetic contrast agents for magnetic resonance imaging (MRI) are used to improve the inherent contrast in MRI images by increasing the relaxation rates of the water protons. This ability of Gd3+-based contrast agents to alter the relaxation rates, known as relaxivity, decreases at ultra-high field strengths.[1] While Eu2+-containing complexes have been explored as contrast agents in the past,[2] we have recently shown that Eu2+-containing cryptates outperform Gd3+ 1,4,7,10-tetraazacyclododecane-N,N′,N″,N‴-tetraacetate (GdDOTA) at ultra-high field strengths.[3] Here, we describe studies that measure the kinetic stability of Eu2+-containing cryptates as well as studies that explore the influence of magnetic field strengths, temperature, and pH values on relaxivity.
Kinetic stability, which relates to the inertness of a complex to transmetallation in vivo, is a critical parameter for contrast agents. Weaver and coworkers have reported the stability of cryptate Eu–1 in the presence of Na+, Ba2+, and tetraethylammonium cations, which are components of electrolytes in cyclic voltammetric experiments.[4] However, the kinetic stability of Eu2+-containing cryptates in the presence of biologically relevant ions including Ca2+, Mg2+, and Zn2+ is of utmost importance due to the toxicity of uncomplexed europium.[5] Therefore, our kinetic studies explore the stability of the Eu2+-containing complexes of cryptands 1–4 that contain a variety of functional groups (Scheme 1) in the presence of Ca2+, Mg2+, and Zn2+. The use of these ligands allowed us to establish the relationship between ligand structure and kinetic stability. Additionally, understanding the structural characteristics of Eu2+-containing cryptates that influence relaxivity as a function of pH value, temperature, and magnetic field strength is important because this knowledge should enable the design of improved ligands for use at ultra-high field strengths.
Scheme 1.
Structures of cryptands 1–4.
Results and Discussion
Synthesis
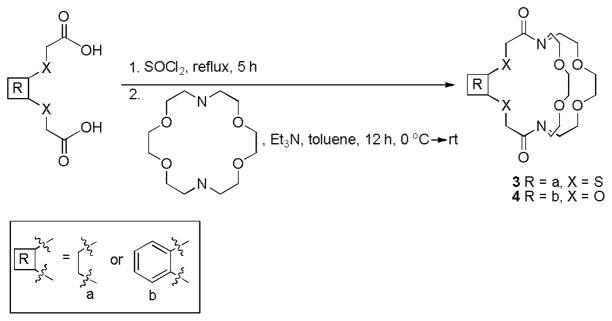
To synthesize cryptands 3 and 4, a two-step synthetic procedure was used that involved thionyl chloride and 1,4,10,13-tetraoxa-7,16-diazacyclooctadecane (diazacrown ether). Briefly, diacids were converted into diacid chlorides followed by immediate reaction with diazacrown ether to produce the desired cryptands. (Scheme 2)
Scheme 2.
Synthetic route to cryptands 3 and 4.
Kinetic Stability Studies
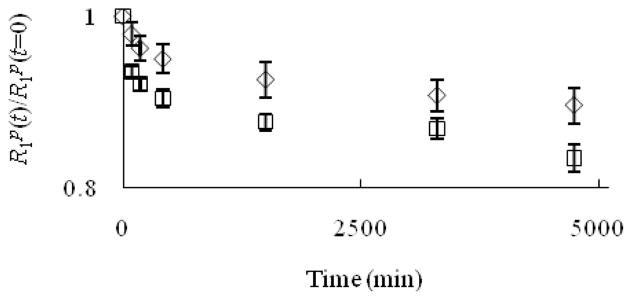
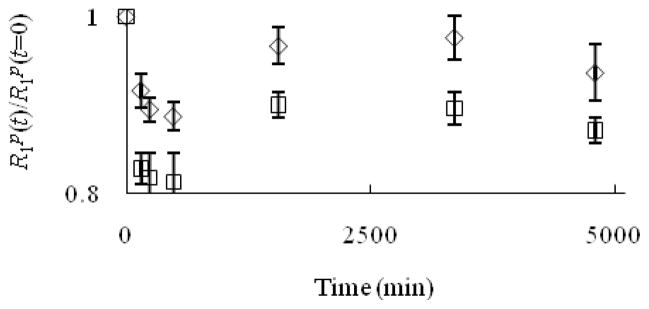
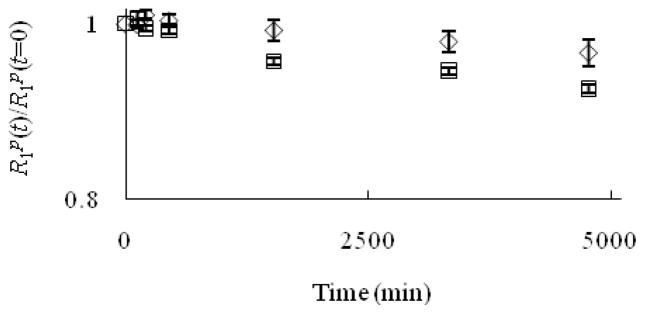
One critical feature of a useful contrast agent is stability towards dechelation under physiological conditions. While thermodynamic stability constant of Eu–1 is high (log K = 13.0),[6] kinetic stability is also crucial in evaluating the possibility of demetalation of these contrast agents in the presence of endogenous ions. For a small molecule contrast agent to be used in vivo, it should be kinetically inert at least long enough to be excreted (t1/2 ≈ 5–6 min in mice, t1/2 ≈ 90 min in humans).[7] Kinetic stability is important because uncomplexed Eu2+ oxidizes to Eu3+ more easily than Eu2+ that is encapsulated in cryptands,[8] and Eu3+ is toxic.[5] Prior to excretion, one possible pathway to the release of Eu2+ is through transmetallation with endogenous ions. Ions that are found in blood plasma include Ca2+, Mg2+, and Zn2+, and these ions are of particular concern because of their abundance in serum and their tendency to be complexed by ligands. Uncomplexed Ca2+ and Mg2+ ions, despite having lower affinity than Zn2+ to many ligands,[9] are present in higher concentrations than Zn2+ in blood serum (1.05, 1.34, and 0.125 mM for Ca2+, Mg2+, and Zn2+, respectively).[9,10] However, the relatively low concentration of zinc in serum is sufficient to displace gadolinium in diethylenetriamine pentaacetate (DTPA).[9,11] Therefore, we have examined the stability of Eu2+-containing cryptates of 1–4 towards transmetallation by monitoring the change in longitudinal relaxation rate of water protons at 60 MHz in the presence of Ca2+, Mg2+, and Zn2+ following the procedure of Muller and coworkers.[9,11] In this procedure, a Eu2+-containing complex is prepared in degassed phosphate buffered saline (PBS) and then other metals are added to the solution. The Eu2+ complexes are soluble in PBS; however, uncomplexed Eu2+ is insoluble, and upon transmetallation, it immediately precipitates.[12] Once Eu2+ precipitates, a measurable decrease in the relaxation rate of water protons is detected. A plot of the ratio of the longitudinal relaxation rates (R1p) of the Eu2+-containing solutions at time t relative to initial values (t = 0) versus time allows monitoring of the extent of transmetallation. Muller and coworkers have developed this technique as a way to measure the degree of transmetallation in terms of the kinetic index, which is defined as the time required to reach 80% of the initial longitudinal relaxation rate of water protons. We used concentrations of Ca2+, Mg2+, and Zn2+ that are 2.38, 1.87, and 20 times greater than normal in vivo levels, respectively, and the results of our experiments are shown in Figures 1–3.
Figure 1.
Evolution of R1p(t)/R1p(t=0) versus time for the Eu2+-containing cryptates Eu–1 (◇) and Eu–2 (□) (2.5 mM) in the presence of Ca2+ (2.5 mM). The value 0.8 on the y-axis is the threshold for the kinetic index. Error bars represent standard error of the mean.
Figure 3.
Evolution of R1p(t)/R1p(t=0) versus time for the Eu2+-containing cryptates Eu–1 (◇) and Eu–2 (□) (2.5 mM) in the presence of Zn2+ (2.5 mM). The value 0.8 on the y-axis is the threshold for the kinetic index. Error bars represent standard error of the mean.
As seen from the ratio of the longitudinal relaxation rates versus time (Figures 1–3), the kinetic index of Eu–1 and Eu–2 are greater than 4740 minutes in the presence of Ca2+, Mg2+, and Zn2+, more than 53 times longer than the half-life of small molecules in vivo. This kinetic index indicates that Eu–1 and Eu–2 did not fall below 80% of their efficacy at this time period, which suggests that these complexes are inert to transmetallation in the presence of Ca2+, Mg2+, and Zn2+ at greater than normal in vivo levels. Interestingly, the values in the presence of Zn2+ appeared to decrease during initial time points and then increase again; however, analysis of variance revealed that all of the data points for Eu–1 and Eu–2 in the presence of Zn2+ are not different (α = 0.01). The stability of these Eu2+-containing complexes is likely due to the effective binding of the cryptand to the metal ion.
While Eu–1 and Eu–2 showed stability towards transmetallation in the presence of endogenous metal ions, precipitates were observed as soon as PBS was added to Eu–3 and Eu–4, consequently, these data are not included in Figures 1–3. This observation suggests of a weaker interaction between Eu2+ and the amide-containing cryptands 3 and 4 relative to cryptands 1 and 2. A further decrease in the longitudinal relaxation rate was observed in the presence of Ca2+, Mg2+, and Zn2+. Studies with cryptands 3 and 4 were stopped once the longitudinal relaxation rate fell below 80% of the initial value.
The weak binding of Eu2+ to cryptands 3 and 4 can be attributed to the presence of amide groups in the cryptand structure. Amides have resonance structures (Figure 4) that change both electronic and structural properties of the ligands relative to cryptands 1 and 2. Because of the presence of partial positive charges on nitrogen atoms, it is unlikely that these nitrogen atoms serve as donors. Thus, the denticity of the ligand is decreased relative to cryptands 1 and 2. Furthermore, when the lone pairs on the nitrogen atoms are delocalized, the geometry of the nitrogen atoms changes from pyramidal to trigonal planar, and this change in geometry could also make it harder for Eu2+ to coordinate with the cryptands 3 and 4 relative to 1 and 2. Consequently, a decrease in kinetic stability is observed. Because of the ineffective complexation of Eu2+ in the amide-containing cryptands 3 and 4, we did not include Eu–3 and Eu–4 in relaxometric studies in the remainder of this report. While cryptands with amides are not good ligands for Eu2+, Eu–1 and Eu–2 were observed to have a high kinetic stability in the presence of Ca2+, Mg2+, and Zn2+ in concentrations higher than those found in vivo, a promising result for potential use as contrast agents.
Figure 4.
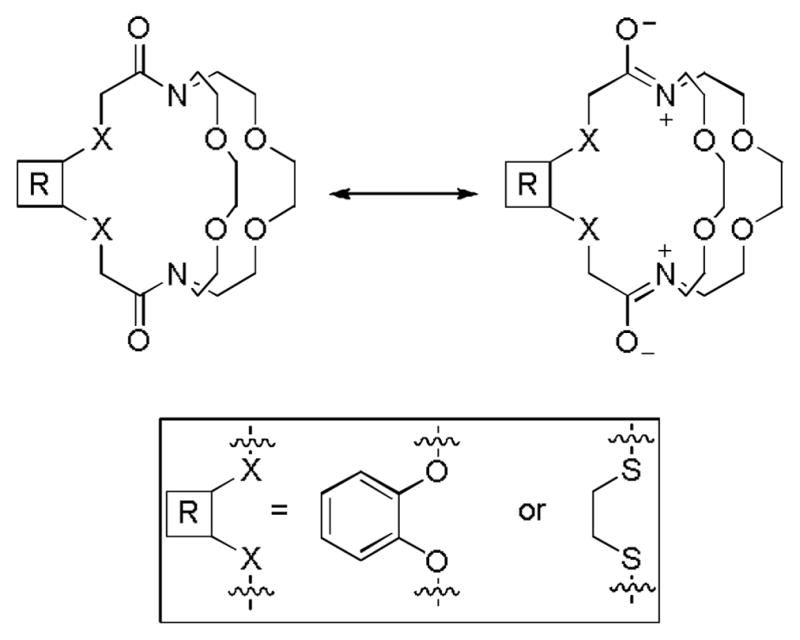
Contributing resonance structures of cryptands 3 and 4.
Proton relaxometry
Influence of Magnetic Field Strength on Relaxivity
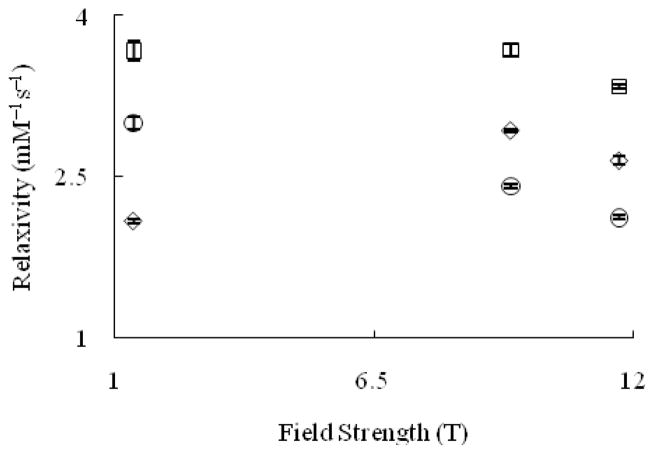
Eu2+-containing cryptates have desirable features that include the presence of two inner-sphere water molecules and fast water-exchange rates, two key factors that influence relaxivity. These cryptates are one of a few examples of paramagnetic materials that demonstrate an increase in relaxivity at ultra-high field strengths relative to lower field strengths.[3,13] To establish a more complete understanding of the behavior of the efficacy of these cryptates as a function of field strength, we have measured the relaxivity of Eu–1 and Eu–2 at field strengths of 1.4, 3, 7, 9.4, and 11.7 T. These measurements allowed us to compare the efficiency of Eu2+-containing complexes at clinically relevant field strengths (1.4 and 3 T) to higher field strengths that are commonly used in preclinical research (>3 T). Because relaxivity is dependent on temperature,[14] we only compared field strengths at the same temperature.
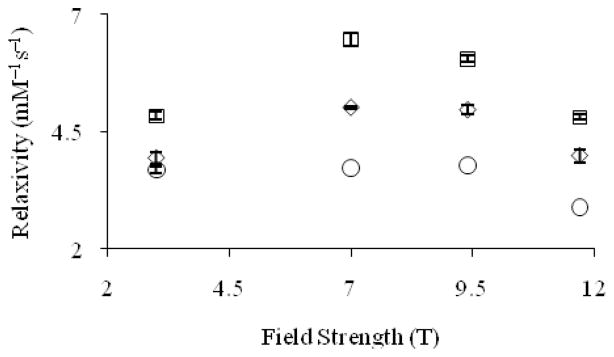
In comparing the efficacy of Eu2+-containing cryptates at field strengths of 3, 7, 9.4, and 11.7 T (20 °C, pH = 7.4), the relaxivity of Eu–2 is higher than Eu–1 at all field strengths (Figure 5). This difference in relaxivity between the two cryptates is likely due to the difference in rotational correlation rate, which is the rate at which these molecules tumble in solution. This rate is proportional to molecular weight for structurally similar compounds.[15] The relaxivity for Eu–1 displays an increase in relaxivity from 3 to 7 T followed by a decrease above 9.4 T, and Eu–2 shows an increase in relaxivity from 3 to 7 T followed by a decrease above 7 T. This “bump” could be similar to the “bump” with a maximum value between 7 and 9.4 T observed at lower field strengths in the nuclear magnetic resonance dispersion plots of slowly rotating Gd3+-based contrast agents.[16] An attempt to explain this increase in relaxivity at higher fields was made using a simulation of the Solomon–Bloembergen–Morgan (SBM) equations. While the relaxivity values from this simulation matched the trend observed for GdDOTA, it did not fit the experimental data for Eu2+-containing complexes. The results of this simulation indicate that SBM theory alone cannot explain our observations.
Figure 5.
Proton longitudinal relaxivity (T = 20 °C, pH = 7.4) of GdDOTA (○) and Eu2+-containing cryptates Eu–1 (◇) and Eu–2 (□) as a function of magnetic field strength. Values at 3, 7, and 11.7 T are from reference 3. Error bars represent standard error of the mean.
At higher temperature (T = 37 °C, pH = 7.4) (Figure 6), Eu–1 displays an increase in relaxivity from 1.4 to 7 T and a decrease above 9.4 T. However, at this temperature, the relaxivity of Eu–2 at 1.4 and 9.4 T is the same. At all field strengths and temperatures measured (except 1.4 T), Eu–1 and Eu–2 have a higher relaxivity than GdDOTA. To further explain the influence of temperature on the relaxivity of Eu–1 and Eu–2, we measured relaxivity as a function of temperature at constant field strength.
Figure 6.
Proton longitudinal relaxivity (T = 37 °C, pH = 7.4) of GdDOTA (○) and Eu2+-containing cryptates Eu–1 (◇) and Eu–2 (□) as a function of magnetic field strength. Values at 1.4 and 11.7 T are from reference 3. Error bars represent standard error of the mean.
Influence of Temperature on Relaxivity
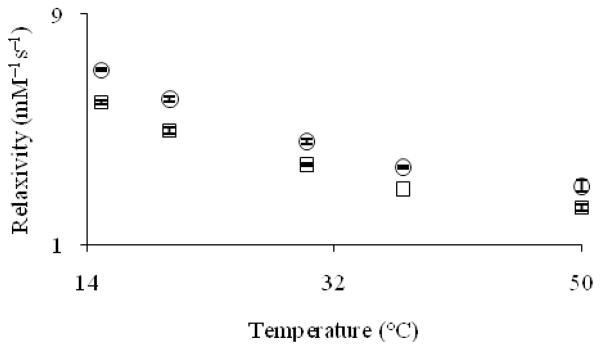
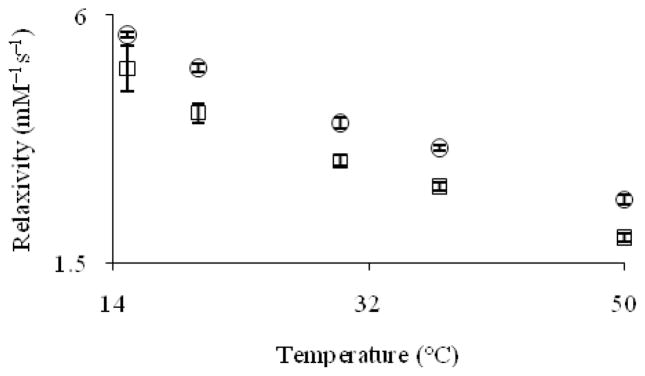
Temperature can have a dramatic influence on the relaxivity of contrast agents. To explore the temperature dependence of the relaxivity of cryptates Eu–1 and Eu–2, we measured relaxivity at 15, 20, 30, 37, and 50 °C at 9.4 and 11.7 T and pH = 7.4 (Figures 7 and 8).
Figure 7.
Proton longitudinal relaxivity (9.4 T and pH = 7.4) of Eu2+-containing cryptates Eu–1 (□) and Eu–2 (cir;) as a function of temperature. Error bars represent standard error of the mean.
Figure 8.
Proton longitudinal relaxivity (11.7 T, pH = 7.4) of Eu2+-containing cryptates Eu–1 (□) and Eu–2 (cir;) as a function of temperature. Error bars represent standard error of the mean.
The relaxivity of cryptates Eu–1 and Eu–2 decreases by 62 and 57%, respectively, at 9.4 T and 61 and 53%, respectively, at 11.7 T when the temperature is increased from 15 to 50 °C. This drop in relaxivity is expected when temperature is varied based on the Stokes–Einstein–Debye equation, which relates rotational correlation rate to temperature.[17] For small molecules such as Eu–1 and Eu–2, an important molecular parameter that affects relaxivity is rotational correlation rate.[18] This parameter increases with temperature, thereby decreasing relaxivity as predicted by Solomon–Bloembergen–Morgan theory.[19]
Another temperature-dependent parameter that contributes to relaxivity is water-exchange rate, which is important when it approaches the magnitude of the relaxation rate of the bound water. When this happens, the plot of relaxivity versus temperature should show a plateau or a positive slope in the low temperature region. This case was not observed for either Eu–1 or Eu–2, implying that the water-exchange rates of Eu–1 and Eu–2 are fast enough to not limit relaxivity even at low temperatures. This conclusion is supported by the results of variable temperature 17O NMR studies, which revealed that crypates Eu–1 and Eu–2 have water-exchange rates of 3.3 × 10⁸ s−1 and 0.85 × 10⁸ s−1, respectively.[3] In general, the variation in the relaxivities of these cryptates with temperature is likely due to the changes in the rotational correlation rate of the complexes as temperature changes, similar to what is observed with Gd3+-containing complexes.
Influence of pH on Relaxivity
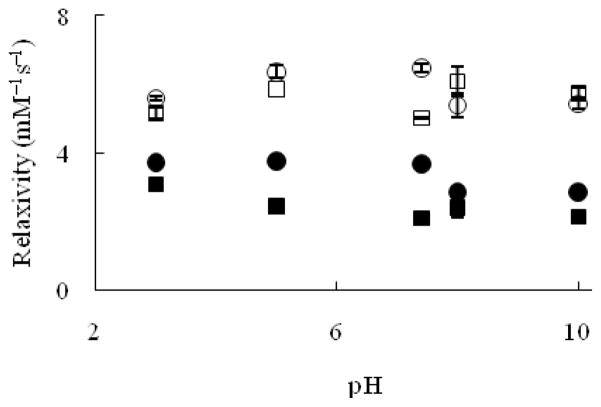
The effect of pH on the relaxivity of Eu2+-containing cryptates as contrast agents was examined as a gauge of their performance in vivo and to explore the potential of these complexes to behave as pH responsive agents (Figure 9).
Figure 9.
Longitudinal relaxivity at 1.4 T at 37 °C (Eu–1 (■) and Eu–2 (●)) and 7 T at 19 °C (Eu–1 (□) and Eu–2 (cir;)) as a function of pH. Error bars represent standard error of the mean.
At 7 T and 19 °C, the relaxivity of Eu–1 did not change significantly at any of the pH values measured from 3 to 10 (p = 0.01). The relaxivity of Eu–2 exhibited the same behavior. These observations are expected for complexes that do not have functional groups that are sensitive to pH changes. Also, at 1.4 T and 37 °C, the relaxivity of Eu–1 is independent of pH value (p = 0.01). However, the relaxivity of Eu–2 remained constant below pH 7.4, but between pH values of 7.4 and 8, the relaxivity of Eu–2 decreased by 22% (from 3.67 ± 0.09 to 2.86 ± 0.02 mM−1s−1) and remained constant above pH 8. In summary, the experiments at different pH values for Eu–1 and Eu–2 under two different sets of conditions (7 T at 19 °C and 1.4 T at 37 °C) indicate that the relaxivity of these cryptates is not influenced by pH over a physiologically relevant range.
Conclusions
Eu2+-containing cryptates that have no amide moieties in their structures were kinetically stable in the presence of Ca2+, Mg2+, and Zn2+ at concentrations that are 1.87–20 times higher than biological concentrations. In addition, these transmetallation studies demonstrated that the kinetic stability of Eu2+-containing cryptates is affected by the presence of amides.
Relaxometric studies of cryptates Eu–1 and Eu–2 showed that the efficiencies of these cryptates were higher at 7 and 9.4 T at 20°C. Furthermore, the relaxivity of these complexes decreased as the temperature was increased from 15 to 50 °C, likely due to the increase in rotational correlation rate with increasing temperature. In addition, the efficacy of Eu–1 and Eu–2 did not vary significantly in the pH range of 3–10 suggesting that these complexes are expected to display constant relaxivity in biologically relevant pH ranges. These studies lay the foundation for the use of Eu2+-containing cryptates as contrast agents for MRI, and we are currently pursuing synthetic modifications of these cryptates, thermodynamic stability and electron paramagnetic resonance measurements, and in vivo testing.
Experimental Section
General
Commercially available chemicals were of reagent-grade purity or better and were used without further purification unless otherwise noted. Water was purified using a PURELAB Ultra Mk2 water purification system (ELGA). Dicholoromethane was dried using a solvent purification system (Vacuum Atmospheres Company) and degassed under vacuum. Triethylamine was distilled from CaH2 under an atmosphere of Ar.[20]
Flash chromatography was performed using silica gel 60, 230–400 mesh (EMD Chemicals).[21] Analytical thin-layer chromatography (TLC) was carried out on ASTM TLC plates precoated with silica gel 60 F254 (250 μm layer thickness). TLC visualization was accomplished using a UV lamp followed by charring with potassium permanganate stain (2 g KMnO4, 20 g K2CO3, 5 mL 5% w/v aqueous NaOH, 300 mL H2O).
1H NMR spectra were obtained using a Varian Unity 400 (400 MHz) spectrometer, and 13C NMR spectra were obtained using a Varian Unity 400 (101 MHz) spectrometer. Chemical shifts are reported relative to residual solvent signals (CDCl3: 1H: δ 7.27, 13C: δ 77.23). 1H NMR data are assumed to be first order, and the apparent multiplicity is reported as “d” = doublet and “m” = multiplet. Italicized elements are those that are responsible for the shifts. High-resolution electrospray ionization mass spectra (HRESIMS) were obtained using an electrospray time-of-flight high-resolution Waters Micromass LCT Premier XE mass spectrometer.
Samples for inductively coupled plasma mass spectrometry (ICP–MS) were diluted using aqueous nitric acid (2% v/v). Standard solutions were prepared by serial dilution of a Eu standard (High-Purity Standards). ICP–MS measurements were conducted on a PE Sciex Elan 9000 ICP–MS instrument with a cross-flow nebulizer and Scott-type spray chamber.
Longitudinal relaxation times, T1, were measured using standard receovery methods with a Bruker Minispec mq 60 (1.4 Tesla (T)) at 60 MHz and 37 °C; a Varian Unity 400 (9.4 T) at 400 MHz and 15, 20, 30, 37, and 50 °C; and a Varian 500S (11.7 T) at 500 MHz and 15, 20, 30, 37, and 50 °C. A plot of 1/T1 vs concentration of the Eu was performed to calculate relaxivity. In the measurements, 4–5 different concentrations including a blank were used, and measurements were repeated 3 times with independently prepared samples.
Susceptibility weighted imaging (SWI) was performed at 3 (Siemens TRIO) and 7 (ClinScan) T using volume coils. The acquisition parameters were as follows: TR = 37 ms, TE = 5.68–31.18 ms, and resolution = 0.5 × 0.5 × 2 mm3 for 3 T; TR = 21 ms, TE = 3.26–15.44 ms, and resolution = 0.27 × 0.27 × 2 mm3 for 7 T. Multiple flip angles (5, 10, 15, 20, 25, and 30°) were used in the SWI experiments to allow for the determination of longitudinal relaxation time, T1.[22] MR images were processed using SPIN software (SVN Revision 1751). Matlab (7.12.0.635 R2011a) was used to generate effective transverse relaxation time, T2*, and corrected T1 maps. The T1 values from the corrected T1 maps were plotted vs the concentration of Eu in the samples to calculate longitudinal relaxivities, r1, as previously reported.[3]
4,7,21,24-tetraoxa-13,16-dithia-1,10-diazabicyclo[8.8.8]hexaco-sane-11,18-dione (3)
A solution of (ethylenedithio)diacetic acid (0.500 g, 2.38 mmol) in thionyl chloride (5.0 mL, 68 mmol) under Ar was heated at reflux for 5 h. Excess thionyl chloride was removed under reduced pressure, and the residue was dissolved in anhydrous toluene (40 mL). The resulting solution and a solution of 1,4,10,13-tetraoxa-7,16-diazacyclooctadecane and triethylamine (1.5 mL, 0.010 mol, 4.2 equiv) in anhydrous toluene (40 mL) were added simultaniously (50 mL/h) to a separate flask containing anhydrous toluene (100 mL) at 0–5 °C under an Ar atmosphere. The resulting solution was stirred for 12 h at ambient temperature. A yellow–orange suspension formed and was filtered, and the solvent from the filtrate was removed under reduced pressure. Purification using silica gel chromatography (10:1 CH2Cl2/methanol) yielded 0.215 g (43%) of 3 a fluffy yellow solid. 1H NMR (400 MHz, CDCl3, δ): 2.77–4.32 (m, CH2); 13C NMR (101 MHz, CDCl3, δ): 32.9 (CH2), 33.6 (CH2), 49.7 (CH2), 50.5 (CH2), 69.2 (CH2), 69.5 (CH2), 71.2 (CH2), 71.4 (CH2), 170.7; TLC: Rf = 0.54 (10:1 CH2Cl2/methanol); HRESIMS (m/z): [M + Na]+ calcd for NaC18H32N2S2O6, 459.1600; found, 459.1602.
5,6-benzo-4,7,13,16,20,23-hexaoxa-1,10-diazabicyclo[8.8.8]hex-acosane-2,9-dione (4)
A solution of catechole-1,4-o,o-diacetic acid (0.40 g, 1.8 mmol) in thionyl chloride (5.0 mL, 68 mmol) under Ar was heated at reflux for 5 h. Excess thionyl chloride was removed under reduced pressure, and the residue was dissolved in anhydrous toluene (25 mL). The resulting solution and a solution of 1,4,10,13-tetraoxa-7,16-diazacyclooctadecane (0.32 g, 1.2 mmol, 1.0 equiv) and triethylamine (0.50 mL, 3.3 mmol, 2.4 equiv) in anhydrous toluene (25 mL) were added simultaniously (50 mL/h) to a separate flask containing anhydrous toluene (60 mL) at 0–5 °C under an Ar atmosphere. The solution was stirred for 12 h at ambient temperature. An orange suspension formed and was filtered, and the solvent was removed under reduced pressure. Purification using silica gel chromatography (9:1 CH2Cl2/methanol) yielded 0.144 g (36%) of 4 a fluffy white solid. 1H NMR (400 MHz, CDCl3, δ): 2.77–3.22 (m, CH2, 2H), 3.37–3.83 (m, CH2, 20H), 4.08–4.35 (m, CH2, 2H), 4.64–4.91 (m, CH2, 2H), 5.15–5.23 (d, J = 14.4 Hz, CH2, 2H), 6.86–7.10 (m, CH, 4H); 13C NMR (101 MHz, CDCl3, δ): 48.5 (CH2), 48.9 (CH2), 68.1 (CH2), 69.4 (CH2), 69.7 (CH2), 71.1 (CH2), 71.3 (CH2), 116.1 (CH), 122.2 (CH), 148.3, 169.0; TLC: Rf = 0.8 (9:1 CH2Cl2/methanol); HRESIMS (m/z): [M + Na]+ calcd for NaC22H32N2O8, 475.2062; found, 475.2060.
General Procedure for the synthesis of Eu2+-containing cryptates Eu–1, Eu–2, Eu–3, and Eu–4
A degassed aqueous solution of EuCl2 (1 equiv) was mixed with a degassed aqueous solution of a cryptand (2 equiv). The resulting mixture was stirred for 12 h at ambient temperature under Ar. Degassed PBS (10×) was added to make the entire reaction mixture 1× in PBS, and stirring was continued for 30 min. The concentration of Eu in the resulting solution was verified by ICP–MS, and the solution was used directly for relaxivity measurements. For transmetallation experiments, the same procedure was followed with only 1 equivalent of ligand.
pH Buffers
The following commercially available buffers were degassed and used in relaxometric experiments: glycine–HCl (pH = 3), acetate (pH = 5), PBS (pH = 7.4), 2-amino-2-hydroxymethylpropane-1,3-diol (TRIS) (pH = 8), and glycine–NaOH (pH = 10).
Transmetallation kinetics
The following procedure was adapted from Muller and coworkers.[9] A stock solution consisting of a Eu2+-containing cryptate (5 mM) was prepared in degassed PBS. To an aliquot of this solution was added a solution of Ca2+ (12.1 mM) in degassed PBS such that the resulting solution was 2.5 mM in both Eu2+ and Ca2+. This solution was stirred at 37 oC under Ar. Aliquots were taken at 90, 180, 420, 1500, 3300, and 4740 min after the addition of Ca2+. All aliquots were filtered using 0.2 μm filters prior to T1 measurements. The T1 of these aliquots (60 MHz, 37 °C) was immediately measured at each time point. The experiment was triplicated with independently prepared solutions. The entire procedure was repeated using Mg2+ (16.4 mM) and Zn2+ (9.97 mM) in place of Ca2+ (12.1 mM). Stastical analysis of varience was performed using the program found at faculty.vassar.edu/lowry/anova1u.html.
Figure 2.
Evolution of R1p(t)/R1p(t=0) versus time for the Eu2+-containing cryptates Eu–1 (◇) and Eu–2 (□) (2.5 mM) in the presence of Mg2+ (2.5 mM). The value 0.8 on the y-axis is the threshold for the kinetic index. Error bars represent standard error of the mean.
Table 1.
Kinetic index data.
| Complexes | Ca2+ (min) | Mg2+ (min) | Zn2+ (min) |
|---|---|---|---|
| Eu–1 | >4740 | >4770 | >4800 |
| Eu–2 | >4740 | >4770 | >4800 |
| Eu–3 | <90 | <120 | <240 |
| Eu–4 | <90 | <120 | <240 |
Acknowledgments
This research was supported by startup funds from Wayne State University (WSU) and a Pathway to Independence Career Transition Award (R00EB007129) from the National Institute of Biomedical Imaging and Bioengineering of the National Institutes of Health. J. G. was supported by a Schaap Fellowship, and M. J. A. gratefully acknowledges a Schaap Faculty Scholar Award. We thank Latif Zahid and Yimin Shen for performing imaging experiments.
Footnotes
Supporting Information: 1H and 13C spectra of cryptands 3 and 4.
References
- 1.Caravan P, Farrar CT, Frullano L, Uppal R. Contrast Media Mol Imaging. 2009;4:89–100. doi: 10.1002/cmmi.267. [DOI] [PMC free article] [PubMed] [Google Scholar]
- 2.a) Burai L, Scopelliti R, Toth E. Chem Commun. 2002:2366–2367. doi: 10.1039/b206709a. [DOI] [PubMed] [Google Scholar]; b) Toth E, Burai L, Merbach AE. Coord Chem Rev. 2001;216–217:363–382. [Google Scholar]; c) Caravan P, Toth E, Rockenbauer A, Merbach AE. J Am Chem Soc. 1999;121:10403–10409. [Google Scholar]
- 3.Garcia J, Neelavalli J, Haacke EM, Allen MJ. Chem Commun. 2011;47:12858–12860. doi: 10.1039/c1cc15219j. [DOI] [PMC free article] [PubMed] [Google Scholar]
- 4.Yee EL, Gansow OA, Weaver MJ. J Am Chem Soc. 1980;102:2278–2285. [Google Scholar]
- 5.a) Wolfson JM, Kearns DR. Biochemistry. 1975;14:1436–1444. doi: 10.1021/bi00678a014. [DOI] [PubMed] [Google Scholar]; b) Ogawa Y, Suzuki S, Naito K, Saito M, Kamata E, Hirose A, Ono A, Kaneko T, Chiba M, Inaba Y, Kurokawa Y. J Environ Pathol Oncol. 1995;14:1–9. [PubMed] [Google Scholar]
- 6.Burns JH, Baes CF., Jr Inorg Chem. 1981;20:616–619. [Google Scholar]
- 7.a) Penfield JG, Reilly RF., Jr Nat Clin Pract Nephrol. 2007;3:654–668. doi: 10.1038/ncpneph0660. [DOI] [PubMed] [Google Scholar]; b) Tweedle MF, Wedeking P, Kumar K. Invest Radiol. 1995;30:372–380. doi: 10.1097/00004424-199506000-00008. [DOI] [PubMed] [Google Scholar]
- 8.Gamage NDH, Mei Y, Garcia J, Allen MJ. Angew Chem Int Ed. 2010;49:8923–8925. doi: 10.1002/anie.201002789. [DOI] [PMC free article] [PubMed] [Google Scholar]
- 9.Laurent S, Vander Elst L, Henoumont C, Muller RN. Contrast Media Mol Imaging. 2010;5:305–308. doi: 10.1002/cmmi.388. [DOI] [PubMed] [Google Scholar]
- 10.a) Deng B, Zhu P, Wang Y, Feng J, Li X, Xu X, Lu H, Xu Q. Anal Chem. 2008;80:5721–5726. doi: 10.1021/ac800715c. [DOI] [PubMed] [Google Scholar]; b) Pors Nielsen S. Scand J Clin Lab Invest. 1969;23:219–225. doi: 10.3109/00365516909077652. [DOI] [PubMed] [Google Scholar]
- 11.Laurent S, Vander Elst L, Muller RN. Contrast Media Mol Imaging. 2006;1:128–137. doi: 10.1002/cmmi.100. [DOI] [PubMed] [Google Scholar]
- 12.A xylenol-orange-based colorimetric assay was used to test for the presence of free europium as described in reference 14. When a solution of EuCl2 (2.5 mM) in PBS was prepared, a precipitate immediately formed. The filtrate of the mixture was exposed to air to allow oxidation of Eu2+ to Eu3+, and the Eu3+ concentration was measured with xylenol orange as an indicator using a calibration curve made from a purchased Eu standard. A concentration of 1.63 μM was measured, which corresponds to 0.07% of the original Eu in solution.
- 13.a) Kowalewski J, Egorov A, Kruk D, Laaksonen A, Nikkhou Aski S, Parigi G, Westlund P-O. J Magn Reson. 2008;195:103–111. doi: 10.1016/j.jmr.2008.08.011. [DOI] [PubMed] [Google Scholar]; b) Kruk D, Kowalewski J. J Chem Phys. 2002;116:4079–4086. [Google Scholar]; c) Nilsson T, Parigi G, Kowalewski J. J Phys Chem A. 2002;106:4476–4488. [Google Scholar]; d) Svoboda J, Nilsson T, Kowalewski J, Westlund PO, Larsson PT. J Magn Reson A. 1996;121:108–113. [Google Scholar]
- 14.Averill DJ, Garcia J, Siriwardena-Mahanama BN, Vithanarachchi SM, Allen MJ. J Vis Exp. 2011;53:e2844. doi: 10.3791/2844. [DOI] [PMC free article] [PubMed] [Google Scholar]
- 15.a) Chan KWY, Wong WT. Coord Chem Rev. 2007;251:2428–2451. [Google Scholar]; b) Reichert DE, Hancock RD, Welch MJ. Inorg Chem. 1996;35:7013–7020. doi: 10.1021/ic960495m. [DOI] [PubMed] [Google Scholar]
- 16.Helm L. Future Med Chem. 2010;2:385–396. doi: 10.4155/fmc.09.174. [DOI] [PubMed] [Google Scholar]
- 17.Anderton RM, Kauffman JF. J Phys Chem. 1994;98:12117–12124. [Google Scholar]
- 18.Caravan P. Chem Soc Rev. 2006;35:512–523. doi: 10.1039/b510982p. [DOI] [PubMed] [Google Scholar]
- 19.Caravan P, Ellison JJ, McMurry TJ, Lauffer RB. Chem Rev. 1999;99:2293–2352. doi: 10.1021/cr980440x. [DOI] [PubMed] [Google Scholar]
- 20.Armarego WLF, Chai CLL. Purification of Laboratory Chemicals. 5. Elsevier; Burlington, MA: 2003. p. 375. [Google Scholar]
- 21.Still WC, Kahn M, Mitra A. J Org Chem. 1978;43:2923–2925. [Google Scholar]
- 22.Haacke EM, Brown RW, Thompson MR, Venkatesan R. Magnetic Resonance Imaging Physical Principles and Sequence Design. John Wiley & Sons, Inc; New York: 1999. p. 654. [Google Scholar]


