

Abstract
The discovery of melanopsin, the non-visual opsin present in intrinsically photosensitive retinal ganglion cells (ipRGCs), has created great excitement in the field of circadian biology. Now, researchers have emphasized melanopsin as the main photopigment governing circadian activity in vertebrates. Circadian biologists have tested this idea under standard laboratory, 12h Light: 12h Dark, lighting conditions that lack the dramatic daily colour changes of natural skylight. Here we used a stimulus paradigm in which the colour of the illumination changed throughout the day, thus mimicking natural skylight, but luminance, sensed intrinsically by melanopsin containing ganglion cells, was kept constant. We show in two species of cichlid, Aequidens pulcher and Labeotropheus fuelleborni, that changes in light colour, not intensity, are the primary determinants of natural circadian activity. Moreover, opponent-cone photoreceptor inputs to ipRGCs mediate the sensation of wavelength change, and not the intrinsic photopigment, melanopsin. These results have implications for understanding the evolutionary biology of non-visual photosensory pathways and answer long-standing questions about the nature and distribution of photopigments in organisms, including providing a solution to the mystery of why nocturnal animals routinely have mutations that interrupt the function of their short wavelength sensitive photopigment gene.
Keywords: Circadian behaviour, retinal photoreceptors, colour vision, evolution of vision, cichlid fishes
For several decades, cycles of alternating white light and darkness have been the standard stimuli used in laboratory studies of circadian activity. These stimuli have been used to investigate circadian behavioural patterns in organisms ranging from bacteria to primates (Tang et al. 1999; Morgan 2004). In nature, however, dramatic diel changes in skylight colour are associated with concomitant changes in luminance (Krull et al. 1985; Endler 1993). Although the role such chromatic changes might play in the setting of circadian activity patterns has been largely ignored, two recent studies on captive redheaded bunting (Emberiza bruniceps) show that wavelength is crucial in the regulation of circadian activity (Rani and Kumar 2000; Malik et al. 2004).
A careful consideration of the role chromatic changes might play in circadian activity patterns via cone opponent neural pathways has the potential to resolve the unexplained associations between cone photoreceptor complement (i.e., both the sensitivity and relative numbers of photoreceptors) and circadian activity. Arrhythmic and strongly nocturnal organisms lack functioning short wavelength sensitive photopigments (Peichl and Moutairou 1998; Peichl 2005). Furthermore, with the exception of some strongly nocturnal species, sensory systems involved in the entrainment of daily activity rhythms include spectrally opponent components that could detect chromatic time-of-day information in the natural world (Neitz and Neitz 2011). Well-characterized examples of such sensory systems include the simple intracellular photoreceptor complex of Halobacterium salinarium (Kokoeva et al. 2002), the parietal eye of Uta stansburiana (Su et al. 2006), and the retinal ganglion cells of Macaca (Dacey et al. 2005).
Retinoid-based photopigments evolved in the most ancient organisms, the archeans, which lack the visuoneural capacity for object discrimination. Furthermore, photoreceptors are thought to have evolved only once throughout the history of life and were co-opted into the various types of eyes that evolved much later within the animals (Land and Nilsson 2002). Evidence from the aforementioned marine archean H. salinarium demonstrates that its spectrally-opponent photoreceptor complex, with opposing actions produced by peak sensitivities to orange and ultraviolet wavelengths, acts as a solar clock to confer an essentially crepuscular activity pattern. Phototaxis toward the ocean surface is exhibited at dawn and dusk when long wavelength light used in photosynthesis is prevalent, and migration away from the surface is exhibited at midday when lethal ultraviolet light is most intense (Dundas and Larsen 1962).
The universal presence of colour-opponent inputs to circadian systems in extant animals suggests that they would retain the ability to compare the relative stimulation among spectral subtypes of photoreceptors in order to extract time-of-day information from the natural world, much like H. salinarium (Land and Nilsson 2002; Arendt 2003). Furthermore, the key component of such a system is the presence and spectral positioning of a short- wavelength sensitive photoreceptor (Gehring and Rosbash 2003). We hypothesize that colour opponency initially evolved to regulate activity patterns in response to changes in sunlight colour that accompany the approximately 24-hour rotation of the earth, and that this colour-opponent input remains the most important source for time-of-day information under natural conditions. A prediction of this hypothesis, then, is that if cone photoreceptors play a role in determining circadian activity patterns, some wavelengths of light should suppress activity. This is counter to the prevailing notion that light, in general, stimulates activity (Tang et al. 1999; Morgan 2004).
Rod, cone, and non-rod/non-cone photopigments all have inputs into circuitry that provides information about illumination to systems that control daily activity patterns. Since fishes have a wide variety of photoreceptors, including several non-visual receptors found in the pineal area and in the retinal ganglion cells (e.g., Forsell et al. 2001; Foster and Hankins 2002; Falcon et al. 2003; Davies et al. 2011), and since, except for highly specialized species, they also lack eyelids, we believe that fish are an ideal and overlooked organism to use in the determination of the roles of the different photopigment inputs to circadian behaviour under natural, as opposed to laboratory, conditions.
Methods
The experimental arena was an 80 L aquarium with lighting provided by a custom-engineered light-emitting diode (LED) system. 28 groupings of three computer-controlled LEDs (manufacturer specified wavelengths of 440 nm, 505 nm, and 630 nm, respectively; obtained from LEDSupply.com) were arranged across a circuit board. Four infrared emitter/detector packages monitored fish activity patterns, and programmable logic devices controlled the output of the infrared detectors. The entire circuit board was connected to a remote computer via a parallel port, and this same computer recorded the activity counts from the infrared detectors. The circuit board was held 10.16 cm above the aquarium, and a diffuser was placed underneath the LEDs. The aquarium, with circuit board and detectors, was placed in a light-tight enclosure, in which the fish only received light from the LEDs.
LED calibration
Crucial to these experiments was both the accuracy and consistency of the LEDs. One non-ideal property of LEDs is that peak wavelength can vary with current. This was eliminated by implementing a pulse-width modulation (PWM) paradigm to control intensity. This produces an all-or-nothing current through the LED for a varying length of time (duty cycle) within a fixed period. The period of the switching frequency is much faster than the integration time of the photoreceptor, and therefore duty cycle sets the LED intensity. The linearity of the PWM method was verified as follows: Each LED type was set to intensity gains of 0.25, 0.50, 0.75, and 1times their maximum power. Spectroradiometric measurements in watts/m2/wavelength was measured (Figure 1a), converted to quanta, integrated across wavelength, and then normalized by the maximum value. Those quotients were then plotted against the theoretical setpoints of 0.25, 0.5, 0.75 and 1.00 (Figure 1b, c, & d). A linear trend line fit to the data with x-intercept fixed to zero yielded R2 values for the 440nm, 505nm, and 630nm LEDs of 0.976, 0.996, and 1.000, respectively. Additionally, the dominant wavelength (as measured by the spectroradiometer) shifted by only 1 nm over the intensity ranges of all 3 LEDs.
Figure 1.

Verification of LED peaks and pulse-width modulation (PWM) of LED output. (A) LED peak wavelengths for each of the three LED types used. Upper trace = output at 100% power; next lowest trace = output at 75% power; next lowest trace = output at 50% power; lowest trace = output at 25% power. (B) Linearity of the violet LED. (C) Linearity of aqua LED. (D) Linearity of red LED.
A diffuser was placed between the tank and the LED array to integrate the light output from the LED triads. A UV-Visible Spectrometer (StellarNet EPP2000C-50) placed inside the empty tank was used to measure LED reflection off of a calibrated (250–2000 nm) Spectralon white diffuse reflectance standard placed in the centre of the tank and at least two other locations. The spectral profiles of the LEDs were roughly Gaussian functions with spectral bandwidths FWHM (full width at half maximum) of about 20 nm. The maximum percent error between the reference and each random location was 3.12%, 4.74%, and 2.61% (440nm, 505nm, and 630nm, respectively).
Lighting Paradigms
The lighting paradigms were based on observed diel changes in skylight colour throughout a typical day in southeastern Wisconsin (Figure 2). Natural sky light spectra were quantified using a spectroradiometer to measure skylight reflected off a barium sulphate (BaSO4) disc (Oriel Corporation, Stratford, CT) with > 97% reflectance through a range of 380–780 nm (Spectrocal, Cambridge Research Systems). The spectrum of the skylight was measured at 1 nm intervals. The measurements were made in a flat open area devoid of trees or buildings with the surface of the disk parallel to the ground. All measurements were made on clear days with the spectrophotometer located 10 cm above and 21.5 cm away from the reflectance standard; the spectroradiometer was angled 65° below the horizontal.
Figure 2.

Diel changes in the colour of skylight on two separate occasions in south-eastern Wisconsin. (A) Change in dominant wavelength over the course of a day; red line = summer, blue line = winter. (B – D) Spectral composition of skylight at three representative points of the summer sky; (B) pre-dawn/post-sunset night sky; (C) sunrise/sunset; (D) mid-day. While taken from the summer morning, these spectra are representative of both the summer and winter data, and also characterize the events surrounding sunset.
In the experimental arena, the length of subjective day was constant among trials, conforming to a 12L:12D cycle. We developed several different experimental lighting paradigms, all of which, for the sake of clarity, are described in the Results section. For the purposes of these experiments, luminance is defined as the photon catch of the 480 nm opsin found in certain non-rod/non-cone photoreceptors. While the actual λmax of melanopsin of any species of cichlid is unknown, 480 nm is a common peak sensitivity value of these opsins, and falls within the values for teleost fishes obtained by Davies et al. (2011). Because these photoreceptors are thought to be important in encoding luminance information for a variety of non-visual functions (Foster and Hankins 2002; Foster and Bellingham 2004; Dacey et al. 2005), we define luminance as a physiological quantity, as opposed to a physical one.
Constant luminance (“melanopsin constant”) calculations
Photopigment absorptions were obtained using the Neitz template model (Carroll et al. 2000). This template can be translated along an axis of the log of wavenumber to produce an accurate absorption spectrum of any peak sensitivity. The Neitz template includes a beta band region and has been demonstrated to be valid for all vitamin-A based photopigments (Neitz and Neitz 2011). Photopeaks were set to 453nm, 480nm, 530nm, and 570nm for S-, Melanopsin, M-, and L-photopigments respectively (appropriate for the Blue Acara; see below), and then activity of each cone class, in terms of quantal catch, was given by the general equation:
where P(λ) is the photopigment spectrum, gn are the gains of each LED (values between 0...1), and Qn(λ) are the LED intensities (in quanta) at 100% of their maximum. This equation was solved for each photopigment present to obtain activations for each cone class. A series of these equations were placed in an iterative loop and subject to Newton’s Method to minimize a least squares variable. This was repeated for every time of day in each lighting condition’s to achieve the desired retinal activation pattern which was melanopsin constant (defined here as constant luminance), except when specifically noted otherwise.
Validation of luminance constant conditions
The calibration of the lights was validated by running the LED light control program and making 96 light measurements corresponding to the LED output at 15 minute intervals throughout the day. These actual light spectra were integrated with the 480 nm melanopisn spectrum to determine the degree the lights were capable of holding melanopsin constant. The maximum error was ± 10%. This assumed a spectral peak of exactly 480 nm for these species. We demonstrate the success of our method graphically in Figure 3, which compares the quantal catch of melanopsin (luminance) and the ratio of the sum of the quantal catches of the L- and M-cones to the quantal catch of the S-cone (colour; (L+M/S). While the quantal catch of melanopsin changed dramatically throughout the day under natural conditions, it remained quite steady under our laboratory conditions, despite the similar changes in colour between the two different settings. Thus, our “melanopsin constant” paradigm successfully keeps luminance constant throughout the day despite the subjects’ constant exposure to changes in stimulus colour. When the same procedure was repeated for pigments with other peak wavelengths the error increased about 10% for each 10 nm shift in peak.
Figure 3.
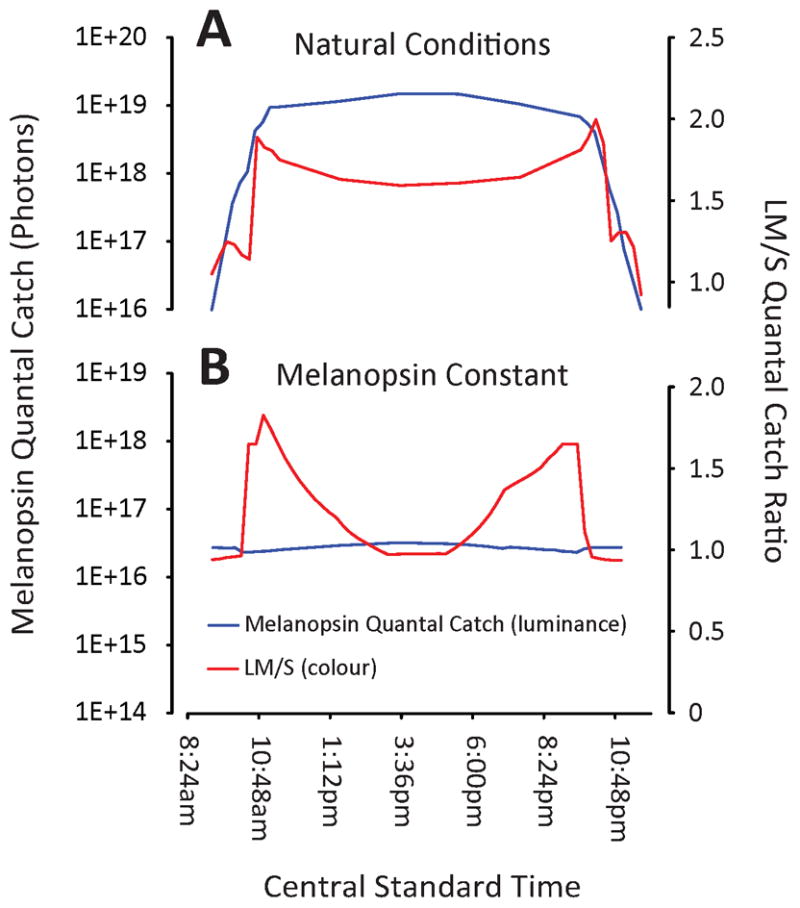
Changes in colour and luminance in natural conditions and our experimental, “Melanopsin Constant” lighting paradigm. Right y-axis: quantal catch of melanopsin, which we here treat as luminance; left y-axis: ratio of the sum of the quantal catches of the L- and M-cones to the quantal catch of the S-cone, which we treat as colour. x-axis, Central Standard Time, used to more closely compare the natural conditions and our stimulus conditions; note that we have truncated the overnight hours, during which both luminance and colour level off under both natural and experimental conditions. Further, note that while colour changes in a similar fashion throughout the day in both natural and our experimental conditions, luminance is held constant in our experimental conditions, but changes dramatically throughout the day under natural conditions.
Study Species
Two species of cichlid fish were used for these experiments, each with a distinct complement of photoreceptors. Aequidens pulcher (the Blue Acara), native to the Amazon Basin, has a relatively long-wavelength-shifted set of photoreceptors, including an SWS-2 opsin in its S-cone. The photoreceptor sensitivities (Wagner and Kroger 2005) of A. pulcher are shown in Figure 4a. Labeotropheus fuelleborni, a Lake Malawi endemic, has a photoreceptor complement maximally sensitive to shorter wavelengths (Carleton et al. 2000), as its S-cone opsin is an SWS-1 family opsin. Labeotropheus fuelleborni’s photoreceptor sensitivities are shown in Figure 4b. In all of the experiments described below, a group of six adult individuals of either species was used as the experimental cohort.
Figure 4.
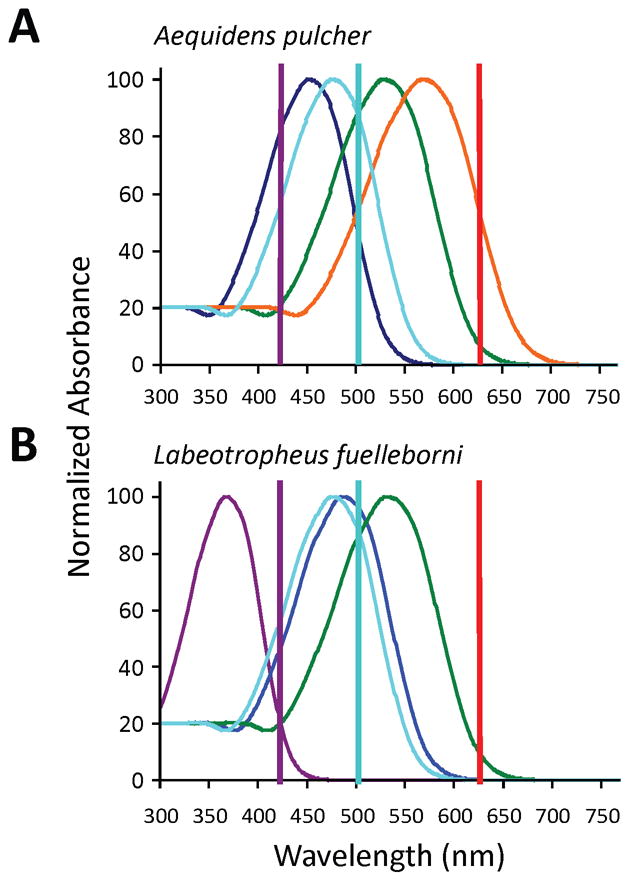
(A) Retinal photoreceptor complement in Aequidens pulcher: dark blue = 453nm, in S-cones; green = 530nm, in M cones; orange = 570nm, in L cones; light blue = 480nm, in intrinsically photosensitive retinal ganglion cells (ipRGCs). (B) Retinal photoreceptor complement in Labeotropheus fuelleborni: violet = 368nm, in UV cones; blue = 488nm, in S cones; green = 533 nm, in M cones; light blue = 480nm, in ipRGCs. In both (A) and (B), vertical lines represent the peak wavelength of the LEDs used in this experiment: violet = 420nm LED; aqua = 505nm LED; red = 630nm LED.
Data Collection and Analysis
Activity data were recorded as the sum of the activity counts from all four detectors per 10 minute period. To analyze the data, activity counts were tallied for each individual ten-minute interval throughout the trial. A running average was calculated, and the result was divided by the number of days in the trial, yielding a per diem average level of activity per ten minute period per six fish throughout a typical day. These per diem activity levels were then standardized as the percentage of the maximum activity count for each lighting paradigm. Data were recorded for 21 days within each lighting paradigm described below.
Results
We first examined the behaviour of A. pulcher under a naturalistic pattern of illumination in which both colour and luminance changed which, in terms of the stimulation of the different photopigments, closely simulated daily patterns of skylight. The colour of the illumination was more red-orange at dusk and dawn and bluer at midday, and under these conditions, a non-rod/non-cone opsin peaking at 480 nm would be subject to strong quantal catches during the subjective day and very sparse quantal catches during subjective night. The activity of the fish showed a diurnal/crepuscular pattern with activity peaks during the subjective sunrise and sunset when colour opponent circuits would be most active, and a prolonged quiescent period occurred during subjective night (Figure 5a).
Figure 5.

Circadian behaviour of A. pulcher under fully naturalistic vs. constant-luminance natural colour-changing conditions. (A) Activity under conditions in which both light intensity and colour of illumination in the enclosure changed in a naturalistic manner. During the first 12 hours of the photoperiod, a 480 nm opsin would be stimulated as would be the rods and cones; there was darkness for the second 12 hours; black line = activity, red line = ratio of L-cone to S-cone quantal catch. (B) Behaviour under the luminance constant stimulation regime. Quantal catches of pigments with a 480 nm spectral peak were kept constant for the full 24-hours photoperiod but wavelength content of the illumination changes in a naturalistic manner mimicking daily changes in the colour of the sky; red and black traces as above. (C) Behaviour under same conditions as (B), but onset of stimulus advanced 4 hours. Black trace = activity; red trace = standardized L:S quantal catch ratio; blue trace = standardized S-cone quantal catch. (D) Behaviour under free-running, 12D:12D, conditions. The smaller panels to the right of A-C illustrate the duration and intensities of the LEDs (red = 630 nm LED; aqua = 505 nm LED; violet = 420 nm LED) during each experiment.
The spectrally opponent nature of cone inputs to circadian systems makes them exquisitely responsive to chromatic changes in illumination but relatively unresponsive to luminance changes. In order to determine the relative roles of luminance and colour in determining circadian activity, the conditions were modified so that luminance was kept constant throughout a 24-hour period, but colour changed in a naturalistic fashion. Remarkably, even though the luminance remained constant, the main features of the natural activity pattern were maintained (Figure 5b). The most salient behavioural feature common to both of these conditions is that the fish were most active at subjective sunrise and sunset, periods in which long-wavelength light dominated the illumination of their enclosure. A quiescent period occurred during the midday and night time periods, during which short wavelength light dominated (Figure 5b). Phase shifting the lighting condition produced a corresponding advance in the phase of fishes’ activity, which demonstrated that the activity pattern was under the control of the colour changing light (Figure 5c).
In order to determine if colour changes alone could synchronize the circadian clock, the A. pulcher were allowed to free run in complete darkness (12 dark: 12 dark) following two weeks of entrainment on the chromatic-changing/luminance constant photoperiods. The free-running fish displayed a unimodal pattern of circadian activity, lacking both the morning and evening peaks that correspond to orange skylight and the midday trough; however, the daily activity pattern was synchronized to the fundamental component of the diurnal rhythm set by the daily colour changes light during the previous weeks (Figure 5d). Thus, these data also provide insight into relative roles of the endogenous clock and light colour in governing the resultant crepuscular/diurnal pattern of the fish. In 12D:12D, the internal clock drives activity during subjective day but when natural light is on, this is dramatically modulated by the masking effects of light colour which stimulate crepuscular activity.
The pattern of activity exhibited by A. pulcher under the changing colour/constant luminance condition suggests that stimulation of the S cones inhibits activity. To distinguish whether S cone stimulation, per se, or the relative S vs. L/M cone stimulation determines behaviour, we designed a photoperiod to constantly stimulate S-cones throughout a 24-hour day, while modulating the absorptions of the L and M cones with a 50% duty cycle (12 light:12 dark). The L, M, and S cones were stimulated during subjective night, and the simulation of the L and M cones was reduced during subjective day. Under this condition, the fish exhibited a strongly nocturnal pattern, with a large, sustained bout of activity lasting most of the subjective night, and a quiescent period lasting most of the subjective day (Figure 6a). Thus, it appears that activity is determined by a colour opponent system in which the relative activity of S vs. M and L cones is important.
Figure 6.

Circadian behaviour of A. pulcher in S-cone constant and standard laboratory12L:12D conditions. (A) Behaviour under constant S-cone stimulation; red and black traces as in Figure 2. (B) Behaviour under “standard” laboratory 12L:12D conditions; red and black traces as described in Figure 3. (C) Behaviour under 12L:12D conditions, without violet LED; traces as described above. (D) Behaviour under 12L:12D conditions, aqua LED only; traces as described above. The smaller panels to the right of A-D illustrate the duration and intensities of the LEDs during each experiment (red = 630 nm LED; aqua = 505 nm LED; violet = 420 nm LED).
The behaviour of A. pulcher, under a standard laboratory 12L:12D photoperiod of white light during subjective day and complete darkness during subjective night, was very similar to the S-cone constant condition, but was completely unlike that of the naturalistic conditions (Figure 6b). Under the naturalistic condition, the most sustained bouts of activity occurred during subjective night whereas activity was suppressed during subjective day. The square wave, 50% duty cycle, of light and dark has been considered a reasonable surrogate for the diel pattern of illumination change of the natural world; however, here we find that the absence of chromatic changes in illumination creates unnatural activity patterns. This naturally diurnal/crepuscular fish exhibits nocturnal behaviour under standard laboratory 12L:12D conditions.
We performed two additional experiments involving square-wave, 50% duty cycle, photoperiods aimed at further clarifying the role of S, M, and L cone stimulation in circadian activity. In the first, we turned off the violet LED in the skylight-simulating illuminator, leaving only the red and aqua LEDs on in this paradigm. Under these conditions, the blue acara displayed a diurnal activity pattern, virtually inverted from their activity under a 12L:12D photoperiod that included the violet LED (Figure 6c). The final 50% duty cycle photoperiod only presented the aqua LED, which more strongly stimulated the M cones than the L cones. The overall activity pattern (Figure 6d) was largely the same as that found when L and M cones were stimulated more equally (Figure 6c). These results suggest that the M and L cones work synergistically, both opposed by the S cones in governing circadian behaviour; specifically, it appears that stimulation of the S cone suppresses activity, while stimulation of the L and M cones promotes activity. This arrangement of cone inputs is similar to that of melanopsin containing ganglion cells in macaques (Dacey et al. 2005), which suggests that the circadian behaviours of primates and fish may be evolutionarily homologous.
Our hypothesis is that unique photopigment complements can explain differences in circadian activity patterns across species, including L. fuelleborni and A. pulcher. We tested this by subjecting an experimental group of L. fuelleborni to two different lighting conditions: a 12L:12D condition in which all three LEDs in the aquarium illuminator were on, and a 12L:12D condition in which only the aqua and red LEDs were on (Figure 7a, b). Under both conditions, the L. fuelleborni displayed a diurnal activity rhythm which was a virtual inversion of that of A. pulcher.
Figure 7.

Circadian behaviour of L. fuelleborni. (A) Behaviour under 12L:12D conditions using all three LEDs; black trace = activity; red trace = L-cone:S-cone quantal catch ratio; dashed trace = activity of A. pulcher under the same conditions (cf. Figure 3D). (B). Behaviour under 12L:12D conditions without the violet LED; traces as described above, except no dashed trace for A. pulcher.
Discussion
There are several competing explanations concerning the evolution of the diversity of photoreceptor compliments observed in modern-day organisms. Many of these ideas emphasize object recognition (i.e., food, mates, predators), while others additionally or separately argue that this is a product of an evolutionarily adaptive response to the wavelengths of light available within a particular habitat (Lythgoe 1979; Endler 1990; Dominey and Lucas 2001; Peichl et al. 2001; Carleton et al. 2005; Seehausen et al. 2008). While such factors doubtlessly have helped shape photoreceptor complement, observations from nature challenge the idea that object recognition and adaptation to habitat are the main historical forces underlying the evolution of photoreceptor compliment. If spectral habitat were the critical factor in determining which types of photopigments an organism would have, then all organisms within a given habitat should have very similar, if not identical, photopigment sensitivities. While this may be true within a defined taxonomic grouping (Peichl et al. 2001; Jordan et al. 2006), it is certainly not the case across taxa. Within a given habitat, there can be an immense diversity of photoreceptors and photopigments among organisms, even though they experience the same quantity and wavelength distribution of light (Jacobs 1981). The results presented here suggest that by allowing different animals within the same habitat to occupy different “activity pattern niches,” the effect of photoreceptor complement on circadian rhythms may have been a major force of evolutionary diversification. Further, the presence and spectral positioning of the S-cone may have been particularly important in determining these activity patterns.
Aequidens pulcher, which has a relatively long-shifted SWS2 opsin in its S cone, displayed drastically different activity patterns depending upon the presence, timing, and intensity of the violet illumination of the enclosure. On the other hand, L. fuelleborni has a short-shifted, UV-sensitive SWS1 opsin in its S cone that was largely insensitive to the violet light used in this experiment; consequently, the activity of this cohort was not suppressed during the predominantly violet midday conditions. In these experiments, melanopsin was evenly stimulated throughout the day in both species of fish; thus, the only photoreceptors sensitive to short-wavelength light that differed between the species were the S cones. The peak sensitivities of the S-cone opsins differed by almost 90 nm between A. pulcher and L. fuelleborni, which strongly suggests that it is this activation differential that accounts for the stark differences in behaviour, and fits our prediction that some wavelengths of light should suppress activity. More specifically, our results indicate that wavelengths that stimulate the S cone suppress activity. This finding can be generalized to explain how S-opsin mutations may have enabled affected animals, and in turn entire species, to adopt new activity rhythms.
Recently, researchers have proposed that melanopsin, the non-visual opsin present in intrinsically photosensitive retinal ganglion cells (ipRGCs) is the main photopigment involved in circadian photoentrainment in vertebrates (Panda et al. 2002; Foster and Bellingham 2004; Dacey et al. 2005), suggesting that contributions from other pigments can be ignored. This is certainly true in the laboratory, and under the conditions in which these ideas have been tested. In the 12hr steady, diffuse, bright white light: 12hr dark laboratory condition, the normal rod and cone contributions to the circadian system are greatly attenuated; the ipRGC responses to rod and cone input are transient, whereas quantal catches by melanopsin produce a sustained response (Dacey et al. 2005). Furthermore, rod responses saturate and transient ganglion cells are silent to saturated inputs from rods under bright laboratory conditions, and spectrally opponent cone inputs to ipRGCs with extremely robust transient responses to coloured lights are nulled by steady diffuse white lights. However, the situation is reversed in the natural world where there are frequent transitions between light and shadow and where the light bombarding the eye constantly changes colour as an animal darts through its environment (Endler 1993; Land and Nilsson 2002). The response thresholds of the ipRGCs are orders of magnitude lower for brief increments of coloured light incident on the cones than for the same lights acting on the intrinsic photopigment (Dacey et al. 2005); thus, under natural conditions, the melanopsin contribution becomes negligible.
Other recent research, however, has demonstrated that the contribution of melanopsin alone may not be responsible for synchronizing circadian activity outside of the artificial photoperiods used in the laboratory. Mice lacking rods fail to entrain to experimental photoperiods with illumination of less than 1 Lux (Ebihara and Tsuji 1980; Mrosovsky 2003). Further, mice lacking a middle wavelength-sensitive cone, but with intact melanopsin ganglion cells, could neither entrain to standard laboratory photoperiods of 10 Lux nor to a 15-minute pulse of 530 nm light, but could entrain to 15-minute pulses of 360nm and 480nm light (Dkhissi-Benyahya et al. 2007). Thus, a circadian system reliant upon melanopsin alone would be insensitive to the longer wavelengths of light prevalent at dawn and dusk, and this effect was recapitulated within our experiments.
We argue that the cone photoreceptors, and the system of neural wiring associated with them, originally evolved to provide animals with information about diel time in the natural world, and that this retinal system continues to serve this function in modern vertebrates. The linear and sustained response characteristics produced by melanopsin are ideally suited to drive the pupillary light reflex, suggesting that it evolved for that purpose. The fact that melanopsin can provide significant input to the circadian system under conditions where rods and cones are disabled, such as in animals with photoreceptor degeneration or in the case of exposure to bright, steady, uniform laboratory lighting (sensu Semo 2003), is apparently a vestige of the SCN and OPN both using information from the retina that is multiplexed on the same ganglion cell conduit.
Acknowledgments
S. Greenwald’s comments on an earlier draft greatly improved this manuscript. D. Skryja assisted with proofreading. The work described herein was approved by and conducted under the auspices of the Medical College of Wisconsin Internal Animal Care and Use Committee, under Animal Use Agreements 0000278 and 0000279, and adheres to the Association for the Study of Animal Behaviour/Animal Behaviour Society Guidelines for the Use of Animals in Research, and the legal requirements of the country in which the work was performed. This research was funded by Research to Prevent Blindness and NEI Grant EY09303.
Footnotes
Publisher's Disclaimer: This is a PDF file of an unedited manuscript that has been accepted for publication. As a service to our customers we are providing this early version of the manuscript. The manuscript will undergo copyediting, typesetting, and review of the resulting proof before it is published in its final citable form. Please note that during the production process errors may be discovered which could affect the content, and all legal disclaimers that apply to the journal pertain.
Contributor Information
Michael J. Pauers, Email: mjpauers@gmail.com.
Jay Neitz, Email: jneitz@uw.edu.
References
- Arendt D. Evolution of eyes and photoreceptor cell types. International Journal of Developmental Biology. 2003;47:563–571. [PubMed] [Google Scholar]
- Carleton KL, Hárosi FI, Kocher TD. Visual pigments of African cichlid fishes: evidence for ultraviolet vision from microspectrophotometry and DNA sequences. Vision Research. 2000;40(8):879–890. doi: 10.1016/s0042-6989(99)00238-2. [DOI] [PubMed] [Google Scholar]
- Carleton KL, Parry JWL, Bowmaker JK, Hunt DM, Seehausen O. Colour vision and speciation in Lake Victoria cichlids of the genus Pundamilia. Molecular Ecology. 2005;14:4341–4353. doi: 10.1111/j.1365-294X.2005.02735.x. [DOI] [PubMed] [Google Scholar]
- Carroll J, McMahon C, Neitz M, Neitz J. Flicker-photometric electroretinogram estimates of L:M cone photoreceptor ratio in men with photopigment spectra derived from genetics. Journal of the Optical Society of America A. 2000;17(3):499–509. doi: 10.1364/josaa.17.000499. [DOI] [PubMed] [Google Scholar]
- Dacey DM, Liao HW, Peterson BB, Robinson FR, Smith VC, Pokorny J, Yau KW, Gamlin PD. Melanopsin-expressing ganglion cells in primate retina signal colour and irradiance and project to the LGN. Nature. 2005;433(7027):749–754. doi: 10.1038/nature03387. [DOI] [PubMed] [Google Scholar]
- Davies WI, Zheng L, Hughes S, Tamai TK, Turton M, Halford S, Foster RG, Whitmore D, Hankins MW. Functional diversity of melanopsins and their global expression in the teleost retina. Cell and Molecular Life Sciences. 2011;2011 doi: 10.1007/s00018-011-0785-4. epub ahead of print. [DOI] [PMC free article] [PubMed] [Google Scholar]
- Dominy NJ, Lucas PW. Ecological importance of trichromatic colour vision to primates. Nature. 2001;410:363–366. doi: 10.1038/35066567. [DOI] [PubMed] [Google Scholar]
- Dkhissi-Benyahya O, Gronfier C, De Vanssay W, Flamant F, Cooper HM. Modeling the role of mid-wavelength cones in circadian responses to light. Neuron. 2007;53:677–687. doi: 10.1016/j.neuron.2007.02.005. [DOI] [PMC free article] [PubMed] [Google Scholar]
- Dundas ID, Larsen H. The physiological role of the carotenoid pigments of Halobacterium salinarium. Archives of Microbiology. 1962;44(3):233–239. [Google Scholar]
- Ebihara S, Tsuji K. Entrainment of the circadian activity rhythm to the light cycle: effective light intensity for a zeitgeber in the retinal degenerate C3H mouse and normal C57BL mouse. Physiology and Behaviour. 1980;24:523–527. doi: 10.1016/0031-9384(80)90246-2. [DOI] [PubMed] [Google Scholar]
- Endler JA. On the measurement and classification of colour in studies of animal colour patterns. Biological Journal of the Linnean Society. 1990;41:315–352. [Google Scholar]
- Endler JA. The colour of light in forests and its implications. Ecological Monographs. 1993;63:1–27. [Google Scholar]
- Falcon J, Gothilf Y, Coon SL, Boeuf G, Klein DC. Genetic, temporal, and developmental differences between melatonin generating systems in the teleost fish pineal organ and retina. Journal of Neuroendocrinology. 2003;15:378–382. doi: 10.1046/j.1365-2826.2003.00993.x. [DOI] [PubMed] [Google Scholar]
- Forsell J, Ekstrom P, Novales-Flamarique I, Holmqvist B. Expression of ultraviolet- and green-like opsins in the pineal organ and retina of teleosts. Journal of Experimental Biology. 2001;204:2517–2525. doi: 10.1242/jeb.204.14.2517. [DOI] [PubMed] [Google Scholar]
- Foster RG, Hankins MW. Non-rod, non-cone photoreception in the vertebrates. Progress in Retinal and Eye Research. 2002;21:507–527. doi: 10.1016/s1350-9462(02)00036-8. [DOI] [PubMed] [Google Scholar]
- Foster RG, Bellingham J. Inner retinal photoreceptors (IRPs) in mammals and teleost fish. Photochemical and Photobiological Sciences. 2004;2004(3):617–627. doi: 10.1039/b400092g. [DOI] [PubMed] [Google Scholar]
- Gehring WJ, Rosbash M. The co-evolution of blue-light photoreception and circadian rhythms. Journal of Molecular Evolution. 2003;57:1–4. doi: 10.1007/s00239-003-0038-8. [DOI] [PubMed] [Google Scholar]
- Jacobs GH. Comparative Color Vision. Academic Press; New York: 1981. [Google Scholar]
- Jordan R, Kellogg K, Howe D, Juanes F, Stauffer JR, Jr, Loew E. Photopigment spectral absorbance of Lake Malawi cichlids. Journal of Fish Biology. 2006;68(4):1291–1299. [Google Scholar]
- Kokoeva MV, Storch KF, Klein C, Oesterhelt D. A novel mode of sensory transduction in Archea: Binding protein mediated chemotaxis towards osmoprotectants and amino acids in Halobacterium salinarum. EMBO. 2002;21:2312–2322. doi: 10.1093/emboj/21.10.2312. [DOI] [PMC free article] [PubMed] [Google Scholar]
- Krull F, Demmelmeyer H, Remmert H. On the circadian rhythms of animals in high polar latitudes. Naturwissenschaften. 1985;72:197–203. [Google Scholar]
- Land MF, Nilsson D-E. Animal Eyes. Oxford University Press; Oxford: 2002. [Google Scholar]
- Lythgoe JN. The Ecology of Vision. Oxford University Press; Oxford: 1979. [Google Scholar]
- Malik S, Rani S, Kumar V. Wavelength dependency of light-induced effects on photoperiodic clock in the migratory blackbird bunting (Emberiza melanocephala) Chronobiology International. 2004;21(3):367–384. doi: 10.1081/cbi-120038742. [DOI] [PubMed] [Google Scholar]
- Morgan E. Ecological significance of biological clocks. Biological Rhythm Research. 2004;35(1/2):3–12. [Google Scholar]
- Mrosovsky N. Contribution of classic photoreceptors to entrainment. Journal of Comparative Physiology A. 2003;189(1):69–73. doi: 10.1007/s00359-002-0378-7. [DOI] [PubMed] [Google Scholar]
- Neitz J, Neitz M. The genetics of normal and defective color vision. Vision Research. 2011;51:633–651. doi: 10.1016/j.visres.2010.12.002. [DOI] [PMC free article] [PubMed] [Google Scholar]
- Panda S, Sato TK, Castrucci AM, Rollag MD, DeGrip WJ, Hogenesch JB, Provencio I, Kay SA. Melanopsin (Opn4) requirement for normal light-induced circadian phase shifting. Science. 2002;298(5601):2213–2216. doi: 10.1126/science.1076848. [DOI] [PubMed] [Google Scholar]
- Peichl L. Diversity of mammalian photoreceptor properties: adaptations to habitat and lifestyle? Anatomical Record. 2005;287A:1001–1012. doi: 10.1002/ar.a.20262. [DOI] [PubMed] [Google Scholar]
- Peichl L, Moutairou K. Absence of short-wavelength sensitive cones in the retinae of seals (Carnivora) and African giant rats (Rodentia) European Journal of Neuroscience. 1998;10:2586–2594. [PubMed] [Google Scholar]
- Rani S, Kumar V. Phasic response of the photoperiodic clock to wavelength and intensity of light in the redheaded bunting, Emberiza bruniceps. Physiology & Behaviour. 2000;69:277–283. doi: 10.1016/s0031-9384(99)00247-4. [DOI] [PubMed] [Google Scholar]
- Seehausen O, Terai Y, Magalhaes IS, Carleton KL, Mrosso HDJ, Miyagi R, van der Sluijs I, Schneider MV, Maan ME, Tachida H, Imai H, Okada N. Speciation through sensory drive in cichlid fish. Nature. 2008;455:620–626. doi: 10.1038/nature07285. [DOI] [PubMed] [Google Scholar]
- Semo M, Peirson S, Lupi D, Lucas RJ, Jeffery G, Foster RG. Melanopsin retinal ganglion cells and the maintenance of circadian and papillary responses to light in aged rodless/coneless (rd/rd cl) mice. European Journal of Neuroscience. 2003;17(9):1793–1801. doi: 10.1046/j.1460-9568.2003.02616.x. [DOI] [PubMed] [Google Scholar]
- Su CY, Luo DG, Terakita A, Shichida Y, Liao HW, Kazmi MA, Sakmar TP, Yao KW. Parietal eye phototransduction components and their potential evolutionary implications. Science. 2006;311:1617–1621. doi: 10.1126/science.1123802. [DOI] [PubMed] [Google Scholar]
- Tang I, Murakami DM, Fuller CA. Effects of square-wave and simulated natural light-dark cycles on hamster circadian rhythms. American Journal of Physiology. 1999;276:R1195–1202. doi: 10.1152/ajpregu.1999.276.4.r1195. [DOI] [PubMed] [Google Scholar]
- Wagner HJ, Kröger RHH. Adaptive plasticity during the development of colour vision. Progress in Retinal and Eye Research. 2005;24(2005):521–536. doi: 10.1016/j.preteyeres.2005.01.002. [DOI] [PubMed] [Google Scholar]