

Abstract
Pedestrian crowds can form the substrate of important socially contagious behaviors, including propagation of visual attention, violence, opinions, and emotional state. However, relating individual to collective behavior is often difficult, and quantitative studies have largely used laboratory experimentation. We present two studies in which we tracked the motion and head direction of 3,325 pedestrians in natural crowds to quantify the extent, influence, and context dependence of socially transmitted visual attention. In our first study, we instructed stimulus groups of confederates within a crowd to gaze up to a single point atop of a building. Analysis of passersby shows that visual attention spreads unevenly in space and that the probability of pedestrians adopting this behavior increases as a function of stimulus group size before saturating for larger groups. We develop a model that predicts that this gaze response will lead to the transfer of visual attention between crowd members, but it is not sufficiently strong to produce a tipping point or critical mass of gaze-following that has previously been predicted for crowd dynamics. A second experiment, in which passersby were presented with two stimulus confederates performing suspicious/irregular activity, supports the predictions of our model. This experiment reveals that visual interactions between pedestrians occur primarily within a 2-m range and that gaze-copying, although relatively weak, can facilitate response to relevant stimuli. Although the above aspects of gaze-following response are reproduced robustly between experimental setups, the overall tendency to respond to a stimulus is dependent on spatial features, social context, and sex of the passerby.
Keywords: behavioral contagion, joint visual attention, social influence, vigilance
Among social organisms, the ability to perceive and interpret the behavior of others can be critical to survival, whether it provides clues to foraging sites (1) or an alert to an immediate predation risk (2, 3). Close behavioral coupling, such as collective movements of fish schools or bird flocks, leads to the amplification of local perturbations and can create sensory ranges exceeding the range of individual perception (4, 5), ultimately improving the ratio of responding to a stimulus per unit of observation effort. One effective means by which individuals track features in the local environment is to monitor the visual attention of others through the assessment of gaze direction. Gaze-following, or the use of perceived gaze direction to shift visual attention, is a common and recognizable phenomenon in humans as well as a number of other vertebrate species (6). In particular, gaze-following has been a popular area of investigation among psychologists, often in the context of testing individuals’ perceptions of others’ perspectives in dyadic interactions (7). Despite a growing literature in this subject area (8, 9), little is known of how gaze-following propagates in a natural and interactive setting, such as the setting experienced in crowded public environments, or what impact it has on collective visual attention. In one of the earliest studies of gaze-following in human crowds, the study by Milgram et al. (10) in 1969 instructed stimulus groups to stop and stare up into a building window on a crowded street in New York City. They then measured the probability of passersby adopting this behavior over a 15-m cross-section of the street, showing an increase in gaze-following response with the size of the stimulus group. Although informative to the effects of social influence in public settings, the findings from the work by Milgram et al. (10) raise several interesting questions.
First, it is unclear as to whether there is a quorum-like relationship in the proportion of pedestrians looking up as a function of stimulus group size (11). The threshold at which one-half of the passersby look up is very close to one stimulus individual, making it difficult to determine empirically whether the group response is a steep threshold. Depending on the functional form by which behavior is transferred from one individual to another, various consequences can be seen at the level of the group. The works by Granovetter (12) and Shelling (13) first described a model where individuals decide whether to engage in some form of action (such as rioting or voting for a particular party) when a threshold number of others has already engaged in the action. In such models, a sigmoid or quorum-like response, where above a certain group size, an action becomes much more probable, results in rapid adoption of a common behavior by members of the group and a strong dependency on initial conditions (14, 15). A quorum response can result in tipping points (16) or crowd crystallization (17), where nearly all group members adopt the action irrespective of the size of the stimulus group that originally elicited a response. However, a response where the probability of adopting a behavior increases at first proportionally and then saturates with stimulus group size does not tend to result in crystallization of choices and also results in a slower collective response (15). Organisms as diverse as schooling fish (18) and ant colonies (19) seem to adopt quorum-like responses in following conspecifics, whereas some species of monkeys show linear-like responses (20).
Second, another question arising from the work by Milgram et al. (10) concerns the functional reasons why individuals may follow the gaze of other pedestrians. One hypothesis is that gaze-following is a nonspecific expression of the tendency of individuals to socially conform to the behavior of others (21, 22), and therefore, if passersby see a fellow pedestrian looking up, they exhibit a propensity to look up as well, just as they would adopt posture or any other noninformative trait. This type of conformity can provide benefits to the individual by means of affiliation and social approval from others (23) or maintenance of a favorable self-concept (24). A second information-specific hypothesis is that passersby tend to follow gaze direction because it may provide them with relevant information about either that person’s intentions or some aspect of the local environment (e.g., a localized threat), which will allow them to react accordingly (23). To some degree, this question can be investigated by looking at the spatial positioning of individuals when looking up: are passersby more or less likely to look up when they know they are in the field of view of the stimulus group? In other words, if stimulus members cannot see the individual, the first hypothesis would predict that there should be no reason to adopt this norm.
Third, it is interesting to question whether passersby can acquire relevant information from the visual attention of others (e.g., can cues provided by the visual attention of others provide valuable information regarding the location and identification of pertinent but weak or ambiguous stimuli?). Although social connections among pedestrians are often limited because of brief contact and continuous movement, such interactions among passersby (25, 26) may create means by which social cues could be transmitted among pedestrians, and thus affect individuals’ awareness of their environment. For example, when crossing the road, pedestrians monitor and copy the movements of others around them, with decisions to cross being socially influenced (27). Furthermore, experimental studies of consensus movement decisions have shown that people are capable of identifying individuals within crowds that possess information through subtle nonverbal social cues (28).
Fourth, we question the degree to which such experiments are context-dependent. The experiments in the work by Milgram et al. (10) were performed on a city street in New York City, but it remains unknown whether different pedestrian settings would produce similar results. For example, fish modify their actions in a context-dependent way, relying more on social information in risky situations (29, 30).
To investigate these four questions, we performed two manipulative experiments where we tracked the motion and head orientation of pedestrians in public settings. The first experiment was similar in design to the experiments in the work by Milgram et al. (10); in our case, we included a spatiotemporal analysis of pedestrian movements. In the second experiment, we investigated whether visual orientation of other pedestrians can be used as a means of acquiring relevant information about the local environment. By conducting this second experiment in two different urban scenarios and presenting passersby with two different kinds of weak stimuli, we also tested the importance of context in gaze-following.
Results
Collective Visual Attention in Crowds.
In the first experiment, the movements and gaze-following behaviors of 2,822 pedestrians were quantified in a busy shopping street in Oxford, United Kingdom. Individuals were filmed using an overhead camera as they passed through a rectangular filming region of 10 (horizontal) × 8 (vertical) m. Each trial consisted of stimulus groups of 1, 3, 5, 7, 9, 12, or 15 (6–14 replicates of each) confederates (comprised of both males and females) entering the scene and standing in the center of the filming region for a period of 60 s while looking up at the camera (Fig. S1). Whereas the work by Milgram et al. (10) reported the overall proportion of pedestrians adopting the gaze direction of the stimulus groups (while walking or stopped), we were able, in addition, to track the motion of every pedestrian in our trials, recording (at a rate of 25 frames/s) their speed, accelerations, and proximity to others and when, where, and for how long gaze was followed. We used a multiple analysis of covariance to explore how the proportion of time spent looking up and stopped while looking up differed among individuals as a function of stimulus group size after controlling for features such as crowd density and pedestrian walking speed. Because the movement, position, and behavior of passersby clearly distinguished them from the stimulus group members in our experiments, we did not investigate the self-catalytic effect of passersby potentially becoming a part of the stimulus group by copying gaze direction within our statistical analyses. Unlike passersby in the street, the stimulus group members remained completely stationary with a central position and fixed gaze direction, thus allowing us to investigate the spatial aspects of gaze-following around this stimulus. We do, however, incorporate this positive feedback response between the passersby and the group level effect in a simulation model (see below).
Across all replicates of this experiment, 26.9% (760/2,822) of passersby adopted the gaze direction of the stimulus group, and of these passersby, 14.2% (108/760) stopped walking to look up. Of the passersby that copied this gaze direction, 46.6% (354/760) looked up multiple times. Only 3.7% (28/760) looked in the stimulus direction as many as five times, but gaze duration seems stereotypical and not dependent on whether that individual had previously looked up [F(4,1,332) = 0.596, P > 0.05]. Although both sexes were equally likely to look up (male = 28.8%, female = 26.2%), males spent a larger percentage of time copying this gaze direction (SI Methods).
We found that the mean speed of individual pedestrians followed a Gaussian distribution with a mean of 1.24 ms−1 and SD of 0.37 ms−1, similar to previous data obtained from various cities across the world (31, 32). The mean walking speed of pedestrians (i.e., not when stopped or gaze-following) was negatively associated with the proportion of total time looking [F(1,2,821) = 22.755, P < 0.001] and stopped and looking [F(1,2,821) = 43.833, P < 0.001], indicating that slower walking pedestrians were more influenced by the stimulus. Similarly, the proportion of time engaged in these behaviors was lower at higher crowd densities [looking: F(1,2,821) = 16.244, P < 0.001; stopped and looking: F(1,2,821) = 5.470, P < 0.05].
The proportion of pedestrians copying the gaze direction increased as a function of the stimulus group size (Fig. 1). Furthermore, the proportion of individual time spent looking and stopping to look up also increased as a function of stimulus group size [all looking: F(6,2,821) = 37.329, P < 0.001; stopping and looking: F(6,2,821) = 8.835, P < 0.001] (Fig. S2). Posthoc tests with a Bonferroni correction show that the proportion of time gaze-following was lower for stimuli consisting of one and three members compared with all other group sizes (P values < 0.01). Groups of 12 and 15 also drew a greater gaze-following response than groups of 5, 7, and 9 members (P values < 0.05). As for the proportion of time spent stopped and looking, posthoc analyses show that stimulus groups of 15 drew a longer response than all other stimulus group sizes (P values < 0.05). No other comparisons were significant.
Fig. 1.

The relationship between the proportion of passersby that will copy the gaze of the stimulus group as a function of stimulus group size fitted to Eq. 1. The solid line represents the current experiments (m = 0.66, T = 7.0, and k = 1.38; mean ± SE shown). The dotted line is data from the work by Milgram et al. (10) (m = 0.92, T = 1.2, and k = 1.05; no error measures available).
To quantify the response of passersby to the stimulus group, we fitted the function (Eq. 1)
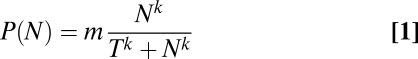 |
to the response data (Fig. 1). Here, P(N) is the observed frequency of looking up, and N is the stimulus group size. The fitted parameters T, m, and k characterize the type of response; m is the maximum proportion of individuals that will look up, T is the group size at which m/2 individuals will look up, and k determines the shape of the functional response. The larger the value of k, the more that the response becomes like a threshold switch. We classify k ≥ 2 as being a quorum-like response (11, 15). When k = 1, the response is at first proportional to group size and then, saturates with larger group sizes; we call this response proportional saturating. Fitting Eq. 1 to our data gave m = 0.66, T = 7.0, and k = 1.38 (Fig. 1). Contrasting these results with a similar retrospective fit to the data in the work by Milgram et al. (10) (m = 0.92, T = 1.2, and k = 1.05), we see that the parameters m and T vary between the two experiments. The maximum probability of responding is 66% in our experiment compared with 92% in the work by Milgram et al. (10), and the group size required to produce one-half of this maximum is roughly six times larger in our experiment. Although differences in the size of the filming region could be contributing to this difference (15 vs. 10 m diameter), we would have expected to find a larger response in the current study if the proportion of passersby to look up followed a declining function of distance to the stimulus group.
The parameter k (determining the steepness of response) is very similar in both experiments, and it suggests a proportional saturating rather than a quorum-like response (15, 33). Previous interpretations of the results in work by Milgram et al. (10) suggest that crowds will spontaneously switch between random gaze directions and a crystallized state, where nearly everyone looks in the same direction (16). However, such crystallization does not occur for k equal to or (in small groups) close to one. To show this point and make predictions about passerby response to a weak stimulus, we developed a stochastic simulation model. In the model, the time between pedestrians passing a stimulus is exponentially distributed, with an average R s between arrivals. We assume that each passerby has a probability of looking at the stimulus determined by s + (m − s)N/(T + N), where s is a spontaneous probability of looking and N is the number already looking (Eq. 1). Individuals looking up do so for an average of 2 s (Fig. 2). Fig. 2A shows that, for large R (low flow), the number looking up is Poisson-distributed, reflecting independence in each individual’s decision whether to look up when passing the stimulus. For smaller R (high flow) (Fig. 2B), copying is observed, and the distribution of the number of individuals looking at the stimulus is no longer Poisson. Rather, the distribution is stretched, with larger groups of onlookers becoming more common. This distribution is not bimodal, however, but it would be if there was a tipping point or if gaze-following was to switch between random and crystallized states. Instead, we predict that, in the presence of a weak stimulus and a high density of pedestrians, the distribution of gaze-following individuals will become skewed. We test this prediction with the next experiment.
Fig. 2.

Results from a simulation model of socially mediated gaze-following for a weak stimulus (A and B) and comparison with data in the second experiment (C and D). In the simulation, the times between individuals passing the stimulus are exponentially distributed, with mean time between passersby of (A) R = 2.4 s (low flow) and (B) R = 0.68 s (high flow). Passing individuals look at the stimulus with a probability s + (m − s)N/(T + N), where N is the number of individuals already looking at the stimulus (the other parameters are explained in the text, and here, we use values s = 0.1, m = 1, and T = 4). If an individual looks at the stimulus, she continues looking for an exponentially distributed time with mean of 2 s. The histogram boxes show the distribution of the number of individuals seen to be looking at the stimulus in a 12-s time interval taken over 10,000 simulated s. Histograms of numbers of individuals observing the suspicious stimulus and comparative Poisson distributions (solid line) are given for (C) the shopping street (low flow) and (D) the commuter station (high flow), with the same mean as the simulated data.
To investigate spatial aspects of gaze-following, we created density and vector fields for the flow of pedestrians and the points at which they looked up (Fig. 3). The direction of gaze exhibited by the stimulus group had little influence on whether pedestrians moved past it in front or behind (the color map in Fig. 3 represents the density of pedestrians around the stimulus). Approaching individuals tended to veer in the direction that took them the shortest distance around (i.e., least effort), irrespective of the gaze direction of the stimulus group (the vectors in Fig. 3 represent pedestrian flow). However, gaze-following did not spread evenly in all directions; individuals behind and to the sides of the stimulus group tended to have a higher propensity to follow gaze than did individuals in front of (and thus, within the gaze of) the group (Fig. 3). Passersby with trajectories that were more likely to have led them to be walking behind the stimulus crowd were significantly more likely to look up than those passersby walking in front [32.7% vs. 19.0%;  2(1) = 65.51, P < 0.001]. This finding was also true when comparing the proportion of time spent looking up [t(2,779.504) = 10.149, P < 0.001] with the proportion of time stopped while looking up [t(2,720.626) = 3.839, P < 0.001].
Fig. 3.

The spatial distribution of pedestrians’ locations (Upper) and gaze-following behavior (Lower) within the 10 (horizontal) × 8-m (vertical) filming region. For illustrative purposes, this area was subdivided into 50-cm2 boxes, where blues indicate low density, reds indicate high density, and vectors represent the averaged course of pedestrian flow in each box. The white arrows represent the location of the stimulus group and direction of gaze. Data presented are the mean for all replicates for each of three group sizes: (A) one, (B) five, and (C) nine.
Detection of Weak or Ambiguous Stimuli.
To further explore whether visual orientation can be used in the detection of weak or ambiguous stimuli, we performed a second experiment at two distinct sites. The two sites (the same busy shopping thoroughfare in the first experiment and a city commuter train station) represent different but commonplace types of crowded urban environment. In the shopping street, there was flow of people walking in both directions along the street and only a few stationary individuals, whereas in the train station the experiments were carried out in the station central hall where people were mostly stationary, waiting for information about train departures/arrivals. Two male confederates were asked to stand within the crowd for 60 s and instructed to act either naturally (as if they were waiting for somebody within the crowd; control) or in suspicious/irregular manner (experimental; one member sketched a map of the environment and took notes on a pad of paper, and the other member held a video camera at waist level and engaged in apparent covert filming of the environment, although they were not actually recording the scene). Therefore, unlike the previous study, members of the stimulus group were not facing in any one direction, and here, we were interested in the pedestrians’ visual orientation in response to the location of these individuals. Nine replicates of each condition were performed in the same spot of both locations, and the motion and head direction of surrounding pedestrians was tracked (Fig. 4 and Fig. S3).
Fig. 4.

Still images from the video sequence of the second experiment showing the tracking of pedestrians and their estimated gaze direction in the shopping thoroughfare (Upper) and the commuter train station (Lower). The stimulus group members are shown in the center of each scene (as indicated by the white arrows).
The stimulus used in these experiments was relatively inconspicuous compared with the first experiment, where individuals remained completely still and maintained a direct upward gaze. As a result, visual orientation in response to the stimulus group was not detectable at distances exceeding ∼2 m from its centroid (Fig. 5). Thus, in our analysis, we consider only those pedestrians (moving and stationary) whose average position throughout the experiment was within a 2-m range (n = 503), and this group was broken down into three categories (<1.500, 1.500–1.749, and 1.750–2.000 m), in which each group consisted of roughly one-third of all tracked pedestrians per location. To confirm the validity of this approach, we also compared these effects with the effects observed using the continuous data for distance. Because of the relatively high pedestrian densities in the commuter station compared with the shopping street (0.223 ± 0.098 vs. 0.088 ± 0.031 m2), we needed to compensate for interpedestrian occlusion (Fig. S4) when calculating the proportion of time pedestrians spent directing their attention to either of the stimulus group members during the course of each experiment. Therefore, only frames where a particular pedestrian had a clear line of sight to at least one of the stimulus group members were included in the analysis.
Fig. 5.

The proportion of total frames in which the visual attention of pedestrians was directed to the stimulus group as a function of decreasing distance to these individuals in (A) the shopping street and (B) the train station (3.5-m radius). For every frame in which a pedestrian was within this radius, a score of one or zero was input, indicating whether their head was visually oriented to either of the stimulus group members. Note that each distance is not representative of an independent measure, because the frames contributing to lower distances are included within the larger distances (mean ± 95% confidence interval).
A three-way analysis of variance was used to analyze differences in response by experimental condition, site location, and average distance from the centroid of the stimulus group. Crowd density and the walking speed of pedestrians were initially included as covariates but were then removed after failing to significantly predict visual orientation to either control or suspicious-acting stimulus group. Across trials, 24.2% (119/503) of passersby directed their head pose, and presumably their gaze, to the stimulus group during our experiments. This response varied by location, however, with a lower proportion of pedestrians in the shopping street directing their visual orientation to these members [14.9% vs. 37.6%;  2(1) = 34.128, P < 0.001]. This finding was also true when comparing the proportion of time spent looking in this direction [F(1,503) = 24.418, P < 0.001] (Fig. S5). We identified spatial effects in the train station, with individuals standing closer to the announcement board being less likely to look at the stimulus group (SI Methods). There was a positive correlation between time spent in the viewing area and proportion of visual attention directed to suspicious activity in both locations [shopping street: r(153) = 0.174, P = 0.034; train station: r(91) = 0.199, P = 0.05], but there was no such relationship for the control trials (P values > 0.05). As expected, there was a main effect of distance across locations [F(1,503) = 18.534, P < 0.001], with pedestrians at average distances of <1.500 m from the stimulus members showing greater orienting responses (P values < 0.001) (Fig. S6). There were also interactions between experimental condition and distance and between location and distance (Fig. S7).
The visual response to suspicious activity in the commuter station differed from the response in the other three setups, resulting in a significant interaction between location and treatment [F(1,503) = 4.130, P < 0.05]. Furthermore, pedestrians in the commuter station in very close proximity to the suspicious stimulus had a lower tendency to look in this direction (Fig. 5B and Fig. S8) [interaction between all three main effects: F(2,503) = 3.495, P < 0.05]. A logistic regression using distance to predict looking behavior confirms this result, showing that pedestrians who spent more time looking in the direction of the stimulus group were closer to these members in both nonsuspicious conditions and the suspicious condition in the shopping street (P values < 0.01); however, distance was not predictive of looking behavior in the suspicious condition within the commuter station (P > 0.05). An analysis of pedestrian sex shows that males spent less time directing their visual orientation to suspicious activity in the train station than females (SI Methods and Fig. S9). When considering that, in other treatments, visual attention increased with decreasing distance to the stimulus, these results suggest that pedestrians, and particularly male pedestrians, averted direct gaze from the suspicious-acting stimulus groups in the commuter station.
To quantify potential socially mediated gaze-following and test against the model suggested by the first experiment, we calculated for each pedestrian the number of surrounding individuals in their field of view that also looked at the stimulus group during the experiment. Across locations, pedestrians who looked at the stimulus group in the suspicious condition had a larger number of visible neighboring passersby that also recently looked in the direction of these individuals [t(248) = 2.609, P = 0.01], whereas there was no significant influence in the control trials [t(251) = 1.780, P > 0.05]. Furthermore, a runs test shows evidence of significant temporal clustering of directed gazes to the suspicious actors in the commuter station (2/9 P values < 0.05) (SI Methods). The distribution of the number of individuals with directed gazes within 12-s intervals is non-Poisson for this location (Fig. 2D), and it is skewed in a manner similar to the model when pedestrian flows are high (Fig. 2B). In the shopping street, pedestrian flows were one-third of the flows at the commuter station, and consistent with the model, the distribution of the number of individuals with directed gazes was Poisson (Fig. 2C).
Discussion
Pedestrians in public settings are both responsive and sensitive to the gaze direction of others within the crowd, with response strength increasing with the number of people already gazing. Although previously characterized as a quorum response (11), our first experiment showed that gaze-following probability is, instead, a proportional saturating response. The form of this response, determined by a value of k close to one, was robust across both our experiments and the experiments in the work by Milgram et al. (10). This response has important consequences for how information about environmental stimuli is acquired socially. Many group-living animals use quorums (i.e., k > 1) in response to the presence or behavior of others (18, 34), allowing them to make consensus decisions in which all (or the majority of) individuals adopt the same choice (15). Conversely, the proportional saturating response established here did not generate strong consensus. As a result we predicted, and in the second experiment observed, weak socially mediated gaze-following. Although pedestrians seemed to follow each other’s gazes to the stimulus (particularly in the case of the suspicious-acting condition), there was no tipping point at which large numbers of individuals simultaneously gazed in that direction. Consequently, in applications such as advertising, where gaze-following is a proven technique for attracting attention to particular features (35), we do not expect a contagion of gaze-following unless the feature itself is very obvious to many or all passersby.
Although a proportional saturating response fails to generate crystallization within crowds, our results are suggestive that the visual attention of passersby can facilitate response, although weakly, to relevant stimuli while also filtering out environmental noise. Furthermore, this response could perform effectively when integrating more subtle forms of social information. Interpreting another person’s visual attention is important in collective tasks, such as insight problem solving (36) and coordination of spatial referencing (37). Proportional responses prevent groups from becoming locked into suboptimal patterns of behaviors (11, 14, 15), and they could aid humans when trying to integrate information without verbal communication.
In the first experiment, gaze-following did not spread evenly in all directions. Individuals with trajectories leading them to walk behind the visual orientation of the stimulus group exhibited a higher propensity to follow the gaze of the stimulus group. This finding suggests that gaze-following under these conditions is not caused by social pressure (21) or some form of obedience (22). Instead, individuals followed gaze direction more often when the person that they were copying could not observe their behavior. In the second experiment, directed visual attention to the stimulus group only occurred at distances less than 2 m away, which is consistent with recent research showing that the vast majority of visual fixations on other pedestrians occurs within this range (38). This localized response and the propagation of copying mainly by those individuals not under observation of others further reduces the efficiency for transferring information about the location of weak signals or subtle features of the environment. Because of the limitations of tracking head direction as opposed to eye gaze, future experimental research studying gaze-following within crowds could be performed with eye-tracking devices mounted to moving participants (38).
Many aspects of how people monitor their environment are strongly dependent on social context. Passersby in our first experiment were less likely to look up and required a larger stimulus group before they responded than passersby in the experiment in the work by Milgram et al. (10). There were also substantial differences in the second experiment between the shopping street, where pedestrians gaze was drawn to the suspicious actors at close distances, and the train station, where gaze was drawn to nearby control activity but averted from those individuals exhibiting suspicious activity at very close positions. These locations vary in pedestrian density and mobility as well as in terms of pedestrian anonymity, allowing for a number of explanations of these differences that are consistent with previous research regarding social interaction and gaze avoidance (39–41). The lack of the aversion response in the shopping street, where individuals move quickly by one another, may be because moving individuals seek a free path in which to pass stimulus group members (42, 43) or fleeting proximity to one another gives a perceived anonymity. Moreover, aversion in a crowded commuter station consisting of largely stationary individuals could be because close proximity and directed gaze communicate threat or dominance (44). Male pedestrians, who accounted for the close range aversion in the commuter station, may have felt that prolonged staring would result in confrontation with the males in the suspiciously acting stimulus group.
In summary, this field experimental approach has produced quantitative and qualitative insights about a candidate causal link in the relation between individual and crowd behavior: the propagation of attention. We have used tracking and semiautomated analysis to quantify a number of aspects of human behavior in crowds, including the proportional saturating response to groups and the locally confined detection of stimuli. However, when we explore questions of social context, it is clear that measurements on the dynamics of crowds cannot by themselves disentangle the psychological reasons behind visual attention.
Methods
All of the experiments were conducted between March of 2007 (first experiment) and March of 2009 (second experiment). This research was sponsored by Oxford Risk, which sought all necessary ethics approvals and clearances. All data were anonymous, and individuals were given sequential numerical identities based on when they entered the scene. Tracking and methods of each experiment are in SI Methods.
Supplementary Material
Acknowledgments
This research was supported in part by Army Research Office Grant W911NG-11-1-0385, Office of Naval Research Grant N00014-09-1-1074, and NSF grant PHY-0848755 (to I.D.C.).
Footnotes
The authors declare no conflict of interest.
This article is a PNAS Direct Submission.
This article contains supporting information online at www.pnas.org/lookup/suppl/doi:10.1073/pnas.1116141109/-/DCSupplemental.
References
- 1.Galef BG, Jr, Giraldeau LA. Social influences on foraging in vertebrates: Causal mechanisms and adaptive functions. Anim Behav. 2001;61:3–15. doi: 10.1006/anbe.2000.1557. [DOI] [PubMed] [Google Scholar]
- 2.Griffin AS. Social learning about predators: A review and prospectus. Learn Behav. 2004;32:131–140. doi: 10.3758/bf03196014. [DOI] [PubMed] [Google Scholar]
- 3.Lima SL. Back to the basics of anti-predatory vigilance: The group-size effect. Anim Behav. 1995;49:11–20. [Google Scholar]
- 4.Cavagna A, et al. Scale-free correlations in starling flocks. Proc Natl Acad Sci USA. 2010;107:11865–11870. doi: 10.1073/pnas.1005766107. [DOI] [PMC free article] [PubMed] [Google Scholar]
- 5.Couzin ID. Collective cognition in animal groups. Trends Cogn Sci. 2009;13:36–43. doi: 10.1016/j.tics.2008.10.002. [DOI] [PubMed] [Google Scholar]
- 6.Shepherd SV. Following gaze: Gaze-following as a window into social cognition. Front Integr Neurosci. 2010;4:1–13. doi: 10.3389/fnint.2010.00005. [DOI] [PMC free article] [PubMed] [Google Scholar]
- 7.Frischen A, Bayliss AP, Tipper SP. Gaze cueing of attention: Visual attention, social cognition, and individual differences. Psychol Bull. 2007;133:694–724. doi: 10.1037/0033-2909.133.4.694. [DOI] [PMC free article] [PubMed] [Google Scholar]
- 8.Böckler A, Knoblich G, Sebanz N. Observing shared attention modulates gaze following. Cognition. 2011;120:292–298. doi: 10.1016/j.cognition.2011.05.002. [DOI] [PubMed] [Google Scholar]
- 9.Kuhn G, Tipples J. Increased gaze following for fearful faces. It depends on what you’re looking for! Psychon Bull Rev. 2011;18:89–95. doi: 10.3758/s13423-010-0033-1. [DOI] [PubMed] [Google Scholar]
- 10.Milgram S, Bickman L, Berkowitz L. Note on the drawing power of crowds of different size. J Pers Soc Psychol. 1969;13:79–82. [Google Scholar]
- 11.Sumpter DJT. The principles of collective animal behaviour. Philos Trans R Soc Lond B Biol Sci. 2006;361:5–22. doi: 10.1098/rstb.2005.1733. [DOI] [PMC free article] [PubMed] [Google Scholar]
- 12.Granovetter M. Threshold models of collective behavior. AJS. 1978;83:1420–1443. [Google Scholar]
- 13.Shelling T. Micromotives and Macrobehavior. New York: W. W. Norton & Company; 1978. [Google Scholar]
- 14.Nicolis SC, Deneubourg JL. Emerging patterns and food recruitment in ants: An analytical study. J Theor Biol. 1999;198:575–592. doi: 10.1006/jtbi.1999.0934. [DOI] [PubMed] [Google Scholar]
- 15.Sumpter DJT, Pratt SC. Quorum responses and consensus decision making. Philos Trans R Soc Lond B Biol Sci. 2009;364:743–753. doi: 10.1098/rstb.2008.0204. [DOI] [PMC free article] [PubMed] [Google Scholar]
- 16.Gladwell M. The Tipping Point. London: Abacus; 2001. [Google Scholar]
- 17.Woloszyn M, Stauffer D, Kulakowski K. Phase transitions in Nowak-Sznajd opinion dynamics. Physica A. 2007;378:453–458. [Google Scholar]
- 18.Ward AJW, Sumpter DJT, Couzin ID, Hart PJB, Krause J. Quorum decision-making facilitates information transfer in fish shoals. Proc Natl Acad Sci USA. 2008;105:6948–6953. doi: 10.1073/pnas.0710344105. [DOI] [PMC free article] [PubMed] [Google Scholar]
- 19.Depickere S, Fresneau D, Deneubourg JL. Dynamics of aggregation in Lasius niger (Formicidae): Influence of polyethism. Insectes Soc. 2004;51:81–90. [Google Scholar]
- 20.Meunier H, Leca JB, Deneubourg JL, Petit O. Group movement decisions in capuchin monkeys: The utility of an experimental study and a mathematical model to explore the relationship between individual and collective behaviours. Behaviour. 2006;143:1511–1527. [Google Scholar]
- 21.Asch SE. Opinions and social pressure. Sci Am. 1955;193:31–35. [Google Scholar]
- 22.Milgram S. Behavioral study of obedience. J Abnorm Psychol. 1963;67:371–378. doi: 10.1037/h0040525. [DOI] [PubMed] [Google Scholar]
- 23.Deutsch M, Gerard HB. A study of normative and informational social influences upon individual judgement. J Abnorm Psychol. 1955;51:629–636. doi: 10.1037/h0046408. [DOI] [PubMed] [Google Scholar]
- 24.Cialdini RB, Goldstein NJ. Social influence: Compliance and conformity. Annu Rev Psychol. 2004;55:591–621. doi: 10.1146/annurev.psych.55.090902.142015. [DOI] [PubMed] [Google Scholar]
- 25.Helbing D, Molnár P. Social force model for pedestrian dynamics. Phys Rev E Stat Phys Plasmas Fluids Relat Interdiscip Topics. 1995;51:4282–4286. doi: 10.1103/physreve.51.4282. [DOI] [PubMed] [Google Scholar]
- 26.Helbing D, Molnar P, Farkas IJ, Bolay K. Self-organizing pedestrian movement. Environ Plann B Plann Des. 2001;28:361–383. [Google Scholar]
- 27.Faria JJ, Krause S, Krause J. Collective behavior in road crossing pedestrians: The role of social information. Behav Ecol. 2010;21:1236–1242. [Google Scholar]
- 28.Faria JJ, Dyer JRG, Tosh CR, Krause J. Leadership and social information use in human crowds. Anim Behav. 2010;79:895–901. [Google Scholar]
- 29.Hoare DJ, Couzin ID, Godin JGJ, Krause J. Context-dependent group size choice in fish. Anim Behav. 2004;67:155–164. [Google Scholar]
- 30.Bode NWF, Faria JJ, Franks DW, Krause J, Wood AJ. How perceived threat increases synchronization in collectively moving animal groups. Proc Biol Sci. 2010;277:3065–3070. doi: 10.1098/rspb.2010.0855. [DOI] [PMC free article] [PubMed] [Google Scholar]
- 31.Knoblauch RL, Pietrucha MT, Nitzburg M. Field studies of pedestrian walking speed and start-up time. Transp Res Rec. 1996;1538:27–38. [Google Scholar]
- 32.Bornstein MH, Bornstein HG. The pace of life. Nature. 1976;259:557–559. [Google Scholar]
- 33.Sumpter DJT. Collective Animal Behavior. Princeton: Princeton University Press; 2010. [Google Scholar]
- 34.Pratt SC, Sumpter DJT. A tunable algorithm for collective decision-making. Proc Natl Acad Sci USA. 2006;103:15906–15910. doi: 10.1073/pnas.0604801103. [DOI] [PMC free article] [PubMed] [Google Scholar]
- 35.Hutton SB, Nolte S. The effect of gaze cues on attention to print advertisements. Appl Cogn Psychol. 2011;25:887–892. [Google Scholar]
- 36.Litchfield D, Ball LJJ. Using another’s gaze as an explicit aid to insight problem solving. Q J Exp Psychol (Hove) 2011;64:649–656. doi: 10.1080/17470218.2011.558628. [DOI] [PubMed] [Google Scholar]
- 37.Neider MB, Chen X, Dickinson CA, Brennan SE, Zelinsky GJ. Coordinating spatial referencing using shared gaze. Psychon Bull Rev. 2010;17:718–724. doi: 10.3758/PBR.17.5.718. [DOI] [PubMed] [Google Scholar]
- 38.Kitazawa K, Fujiyama T. Pedestrian vision and collision avoidance behavior: Investigation of the information process space of pedestrians using an eye tracker. In: Klingsch W, Rogsch C, Schadschneider A, Schreckenberg M, editors. Pedestrian and Evacuation Dynamics 2008. Berlin: Springer; 2010. pp. 95–108. [Google Scholar]
- 39.Goffman E. Behavior in Public Places: Notes on the Social Organization of Gatherings. Glencoe, IL: Free Press; 1963. [Google Scholar]
- 40.Zuckermqn M, Miserandino M, Bernieri F. Civil inattention exists—in elevators. Pers Soc Psychol Bull. 1983;9:578–586. [Google Scholar]
- 41.Laidlaw KEW, Foulsham T, Kuhn G, Kingstone A. Potential social interactions are important to social attention. Proc Natl Acad Sci USA. 2011;108:5548–5553. doi: 10.1073/pnas.1017022108. [DOI] [PMC free article] [PubMed] [Google Scholar]
- 42.Moussaïd M, Helbing D, Theraulaz G. How simple rules determine pedestrian behavior and crowd disasters. Proc Natl Acad Sci USA. 2011;108:6884–6888. doi: 10.1073/pnas.1016507108. [DOI] [PMC free article] [PubMed] [Google Scholar]
- 43.Nummenmaa L, Hyönä J, Hietanen JK. I’ll walk this way: Eyes reveal the direction of locomotion and make passersby look and go the other way. Psychol Sci. 2009;20:1454–1458. doi: 10.1111/j.1467-9280.2009.02464.x. [DOI] [PubMed] [Google Scholar]
- 44.Kleinke CL. Gaze and eye contact: A research review. Psychol Bull. 1986;100:78–100. [PubMed] [Google Scholar]
Associated Data
This section collects any data citations, data availability statements, or supplementary materials included in this article.