

Abstract
Endogenous retroviruses (ERVs) differ from typical retroviruses in being inherited through the host germline and therefore are a unique combination of pathogen and selfish genetic element. Some ERV lineages proliferate by infecting germline cells, as do typical retroviruses, whereas others lack the env gene required for virions to enter cells and thus behave like retrotransposons. We wished to know what factors determined the relative abundance of different ERV lineages, so we analyzed ERV loci recovered from 38 mammal genomes by in silico screening. By modeling the relationship between proliferation and replication mechanism in detail within one group, the intracisternal A-type particles (IAPs), and performing simple correlations across all ERV lineages, we show that when ERVs lose the env gene their proliferation within that genome is boosted by a factor of ∼30. We also show that ERV abundance follows the Pareto principle or 20/80 rule, with ∼20% of lineages containing 80% of the loci. This rule is observed in many biological systems, including infectious disease epidemics, where commonly ∼20% of the infected individuals are responsible for 80% of onward infection. We thus borrow simple epidemiological and ecological models and show that retrotransposition and loss of env is the trait that leads endogenous retroviruses to becoming genomic superspreaders that take over a significant proportion of their host's genome.
Endogenous retroviruses (ERVs) proliferate by the repeated integration of new viral sequences into their host's germline (1), integrations which can become fixed in the host population and have led to ERV sequences (loci) comprising 8–10% of the human and mouse genomes (2, 3) (this number also includes nonautonomous LTR-retrotransposons, which we do not analyze here). These loci form phylogenetically distinct lineages traditionally called “families” (4) (unrelated to the general use of this term in taxonomy), each of which is the result of the expansion of a founder infection of the organism's germline that can have occurred more than ∼100 million years ago (5).
ERVs can replicate both as transposable elements (TEs) and viruses. Some lineages copy by an entirely intracellular mechanism and are functionally indistinguishable from the class of TEs called LTR-retrotransposons, whereas others copy within the host germline using cell reinfection in the same manner as the copying within somatic cells of exogenous retroviruses (XRVs) (6). We refer to these replication mechanisms as “retrotransposition” and “reinfection,” respectively. Whether an ERV is reinfecting or retrotransposing can be determined by the integrity of its env gene, which produces the protein on the surface of the viral particle that is responsible for cell entry. We can assume that an ERV lineage with a functional env is reinfecting, whereas an ERV lineage with a disintegrated env is retrotransposing (whether reinfection can include germline cells in other host individuals of the same or other species is not known). Some retroviruses with a defective env are able to reinfect by “hitchhiking” the functional env of a coinfecting retrovirus, a mechanism known as “complementation” (7). However, complementation does not appear to be common in ERVs; in two ERV families where complementation of env might be expected to occur, because they contain both loci with intact env and loci with defective env, it has been shown that the former are reinfecting, and the latter are retrotransposing (8–10).
The relationship between an organism and its TEs poses a series of questions similar to those in ecology. For example, workers have attempted to explain the proliferation of individual TE lineages and why the genomes of more complex organisms tend to contain more TEs than do simpler ones (11, 12). We take an approach common in community ecology and ask what controls the relative abundance of different TE lineages. Our previous work (10) suggested that reinfecting lineages, inferred from detecting past negative selection on env, tended to be small, but this study was restricted to the human genome and did not account for a possible confounding effect of lineage age. Here we (i) model in detail the relationship between env integrity and proliferation in the intracisternal A-type particle (IAP ) group of ERVs and (ii) compare in 38 mammal genomes the mean env integrity of the largest ERV lineage with the env integrity of the smaller lineages. IAPs are a good model system because they invaded their hosts recently, are well-studied experimentally, and harbor both mechanisms of replication. They were found initially in the mouse and were shown by electron microscopy to replicate via intracellular particles which budded on the cisternae of the endoplasmic reticulum, hence their name (13, 14). These retrotransposing loci have a degraded, nonfunctional env gene (15). Later, however, similar loci with more intact env genes, IAPEs, were identified in the mouse, and one was shown experimentally to be able to reinfect cells in the classic viral manner (9, 16).
We find repeated transformations from reinfecting into retrotransposing ERVs and show that this transformation results in a rapid proliferation within the genome. Considering our results together with those from studies of transmission diversity in infectious disease epidemics, we propose that retrotransposition is the trait that leads ERVs to become genomic superspreaders.
Results
Distribution of IAPs in Hosts.
We found 5,969 IAP loci in 17 host genomes (Figs. 1 and 2 and Table S1). These loci formed a monophyletic clade within a tree containing all XRV species and representatives of other ERV families. The IAP loci were found mostly in rodents: Three species—Mus, Spermophilus, and Cavia—account for more than 80% of the loci. In addition, every sequenced rodent, as well as both representatives of the sister order Lagomorpha, has been invaded by IAPs. Among the equally well-sampled primates, IAPs were found only only in the more basal lineages represented by Tarsius and Microcebus; no IAP was found in monkeys and apes. Mapping host species as a character onto the IAP tree, we estimate a total of at least 18 cross-species transmission events among the IAPs (Fig. 3). Mouse and rat IAP lineages frequently are sister clades but are all independent invasions that occurred after the mouse/rat speciation.
Fig. 1.

Phylogeny of mammals (57) with ERV megafamilies (see text) shown as colored circles (area is proportional to the percentage of the ERV loci in the genome represented by that family). The placing of megafamilies on the tree shows relative age but not origin (which may be considerably earlier). Scale bar shows approximate dates in host phylogeny. Asterisked taxa are treated as duplicates and excluded from our analysis of all ERV families. Name color shows how many IAP loci were found in each species (Table S1). A typical megafamily in one genome (Spermophilus) is shown colored red.
Fig. 2.

Phylogenetic tree of IAP loci. Expansions in host species that have had multiple invasions are colored. Integrity of env gene is shown by color of terminal branch: orange indicates the longest ORF (at least 75% of the full length); red indicates an ORF between 25 and 75% of the full length; blue indicates an ORF <25% of the full length. Black shows loci for which we could not extract sequences >13 kb. Solid and open circles show Shimodaira–Hasegawa (SH) support values > 0.90 and >0.75, respectively. The two blue triangles show switches of env. The published IAPE and IAP sequences are indicated.
Fig. 3.

Phylogenetic tree of the IAPs with the inferred ancestral states of their host species. Expansions are collapsed into single taxa (white triangles), and cross-species transmission events are indicated by yellow pentagons. Colored lines show ancestral states that, according to the available host sampling, can be attributed to a single host. Dashed lines show ancestral states that could not be resolved.
Loss of env Is Associated with Proliferation in IAPs.
The phylogenetic tree of the 4,089 IAP loci with more complete pol sequences (Fig. 2) shows repeated invasions by an IAP-like virus with env and subsequent degradation of this gene as measured by the length of the longest ORF: Most loci in the largest Mus expansion have an env ORF of <200 aa and have lost >80% of their env nucleotides. The extent of env degradation appears to determine the size of the expansion within the genome; e.g., the great majority of the loci in the largest expansions have lost most of their env gene. This change is unidirectional: We find no cases of env gain (or switching) during an expansion. However, the independent invasions of the guinea pig (Cavia) and shrew (Sorex) were preceded by a switch in env (Fig. 2), both gaining their env gene from viruses more closely related to extant betaretroviruses (∼50% amino acid similarity in the transmembrane region to Mason–Pfizer monkey virus) than are IAPs (maximum of ∼20% similarity, which is to Jaagsiekte sheep retrovirus).
The env degradation is not caused primarily by locus age because (i) other genes are not so extensively degraded (Figs. S1 and S2), and (ii) unlike with other genes, env degradation is not positively associated with sequence divergence between the paired LTRs, which is an independent measure of the postintegration age of the locus. As shown in Fig. 2, env is more intact at basal branches, which are obviously older integrations. Also, with the exception of Spermophilus, all the large expansions have predominantly more similar paired LTRs, indicating that they are relatively young (i.e., integrating roughly within the last 12 million years) (Fig. S3). The short terminal branch lengths seen in Fig. 2 also are consistent with this relative youth. There is a striking difference between the larger Spermophilus expansion and that in Cavia: The two expansions have similar degradation of env, but the Cavia expansion is markedly younger.
To assess statistically the relationship between env integrity and both expansion and cross-species transmission in IAPs, we used evolutionary distinctiveness (ED) to measure if a locus is a result of low or high expansion history and performed a multivariate analysis based on generalized least squares (GLS) and accounting for phylogenetic correlation and changes in rate between internal and terminal branches. Our analysis showed that expansion is negatively correlated with env integrity (P < 0.01) but is not significantly correlated with the integrity of other ERV genes (gag, prot, and pol) (Tables S2 and S3). The results were similar when we adjusted ED for cross-species transmissions, confirming that env degradation occurs after the transmission (SI Results and Fig. S4). The model predicts that an IAP family with more than 80 loci is predominantly retrotransposing (at least 50% of its loci have lost at least 90% of their env ORF).
Distribution of Other ERVs in Hosts.
We found a total of 83,614 ERV loci in the 38 mammal genomes screened. Although the IAPs are a relatively young group, in that all loci integrated after the divergence of their host genomes, some other ERV families are much older, and therefore some loci in different genomes are homologs. To avoid pseudoreplication we excluded loci that (i) did not have 90% nucleotide sequence identity with at least one other locus (retaining over half of the loci) or (ii) were in genomes that diverged within the last ∼25 million years, the date that corresponds approximately to 90% sequence identity assuming that integrated ERVs diverge at a similar rate to their hosts (17) (namely Rattus, Papio, and the nonhuman hominoids). The high sequence divergence across all ERVs necessitated the use of clustering using pairwise nucleotide similarity, and the resulting ERV dendrograms showed that, as with the IAPs, family size is very uneven. In most genomes the largest family accounts for more than half of the loci; extreme examples are Erinaceus and Monodelphis, in which the largest family accounts for >80% of the loci (Fig. 1 and Table S1).
Pooling the ERVs from all genomes, we find that the largest 22% of families account for 80% of the loci, and a similarly unbalanced distribution was observed in IAPs, where 18% (3/17) of the genomes contain 80% of the loci. This lack of homogeneity closely resembles the 20/80 rule observed in a range of infectious disease epidemics (e.g., HIV, parasites), where the most infectious ∼20% of individuals account for 80% of the onward transmissions (18–21). In infectious disease epidemics, homogeneity of onward transmission is severely violated by superspreaders, who create many more secondary infections than the rest of the population. By analogy with superspreaders, who can be defined statistically as the most infectious 1% of the infected individuals (21), we introduce the term “megafamily” to describe ERV families that have expanded abnormally. We define a megafamily as the largest family in a genome that also has significantly more loci than would be expected if loci were distributed randomly among families (P < 0.01). Six of the genomes had more than one abnormally large family, so we applied this test to the second largest family also.
Loss of env Is Associated with Proliferation in Other ERVs.
All megafamilies except perhaps one in the lemur Microcebus appear to be retrotransposing rather than reinfecting, because they have lost or possess only a degraded env (e.g., Fig. S5). We compared the env integrity of each megafamily with that in a representative small family in the same genome, which was selected from the dendrogram to be of similar age and to represent between 1% and 10% of the loci (Table S1). We determined env integrity only for the selected families and only after their selection, which was done without prior knowledge of their biology. Therefore, we consider the comparison of family size with gene integrity to be a blinded experiment. We found that 23 of 24 megafamilies have a more degraded env gene [x2 = 20.2; P < 0.001]. As in our analysis of IAPs, we can exclude a possible confounding effect of time inside the genomes because the gag gene, necessary for both replication mechanisms, was not similarly degraded: In 12 of the 24 comparisons the gag integrity was lower in the megafamily; this 50% finding would be expected by chance. In Fig. 4 we show this relationship between env integrity (as a ratio with gag) and family size. The megafamilies are, on average, ∼30-fold larger than other families. An additional comparison between env degradation in megafamilies compared with all other loci in the same genome shows the same result: In the same 23 of 24 comparisons, there is more degradation of env in the megafamily (Table S4).
Fig. 4.

Histograms showing (A) how common are ERV families of different size (Inset shows right-hand tail expanded for clarity) and (B) how many loci in total are in these families. Lines are generated assuming a lognormal (solid black) or generalized Pareto (dashed red) distribution. (C) env integrity (relative to gag) for megafamilies and randomly selected smaller families. The horizontal axes have been scaled using the logarithm to base 2.
ERVs are divided into three classes (22), and we find retrotransposing megafamilies in all of them (Fig. 1). Class I (most closely related among the XRVs to gammaretroviruses) has eight retrotransposing megafamilies, which together make up 33% of the total class I loci; class II (closest to betaretroviruses) has nine, including four IAPs, which make up 41% of the class II loci; class III (closest to spumaviruses) has six, all ERV-Ls, which make up 71% of the class III loci.
Frequency Distribution of ERV Family Sizes Is Skewed.
The 20/80 rule mentioned above (also referred to as the “80/20 rule” or “Pareto principle”) is simply a description of power-law distributions, such as the Pareto distribution, which have a fat right-hand tail: i.e., a majority of the instances belong to a minority of the groups. Although the mechanisms that generate them are varied, such power-law distributions also describe abundance in a variety of areas, including other genomic systems (23, 24). As shown in Fig. 4 and Fig. S6, the Pareto distribution matches the observed right-hand side of our observed frequency distribution of family sizes better than the log-normal distribution, which commonly matches, albeit crudely (25), the observed distribution of individual organisms among species (26).
Discussion
The center of IAP diversity appears to be the rodents with some spill-over infections into other species, chiefly small mammals in similar habitats but also including the dolphin Tursiops. There also is some evidence of host phylogeny affecting cross-species transmission: IAPs appear to have invaded only the basal lineages among the well-sequenced primates. Moreover, mouse and rat IAP expansions frequently are sister clades, a result that is compatible with mouse and rat being sister species among the sequenced rodents. Interestingly, the abundant env-less IAP loci in mouse are not, as originally thought, the degraded descendants of the IAP loci shown to have a functional env (i.e., IAPEs) (9) but rather, as shown in Fig. 2, are from an independent invasion of the mouse genome. It is not known whether the inbred status of the laboratory mouse has facilitated the proliferation of IAPs (27), but we find a similarly large proliferation in the nondomesticated ground squirrel Spermophilus.
Our study shows that mammalian ERVs have evolved independently into retrotransposons multiple times, and this process underlies their relative abundance in mammal genomes. Integrating this information into the known biology of ERVs (1, 6, 9, 28) suggests that genome invasion by XRVs generates ERV lineages that typically expand through reinfection in the initial stages but often adapt to become intracellular retrotransposons. This adaptation leads to the degradation of the now-redundant env gene and confers increased intracellular but diminished interhost mobility. ERV lineages do not persist indefinitely in their host but rather cease replicating after a predictable time (28): Proliferation and cross species transmission might be regarded as alternate responses to lineage extinction. Among IAPs, we find no cases of cross-species transmission after loss of env, and, indeed, no cases of env capture by env-less vertebrate ERVs are known (29). However, we cannot preclude the possibility that such capture might occur. Rare events such as complementation and recombination might restore the capability of the extracellular life cycle; for example, in invertebrates there have been multiple evolutionary transitions from LTR-retrotransposons to retrovirus-like elements by the gaining of a third ORF analogous to env and an assumed shift from retrotransposition to reinfection (30). There also are examples of cross-species transmission by various TEs that lack an obvious mechanism for reinfection (31).
Why should a shift to retrotransposition lead to greater proliferation? First, reinfection might reduce host fitness more. Reinfection probably involves more replication in somatic cells, with the consequent risks of insertional mutagenesis. Production of endogenous Env protein may interfere with the normal function of the receptor and can cause cell fusion (32), a dangerous effect even though several env genes have been co-opted for this purpose in the host placenta (33). The transmembrane domain of the Env protein also has immunosuppressive properties (34, 35) that might have a negative effect on host fitness. Second, production of endogenous Env protein might be disadvantageous to the ERV, e.g., possibly leading to receptor interference in which intracellular binding of the cellular receptor to endogenously expressed Env protein results in down-regulation of the receptor required for viral reentry (36). A functional env gene thus might inhibit proliferation through reinfection. In addition, retrotransposition simply might be a more efficient way to generate new integrations into germline cells (27), circumventing the requirement for survival in a hostile extracellular environment and evading some innate antiviral defenses [e.g., tetherin, a membrane-bound protein that inhibits the replication of enveloped viruses by tethering budding virus to the cell-surface (37–39)]. That retrotransposing ERVs are more common than reinfecting ones is consistent with ERVs as a group being rarer than the entirely retrotransposing Long Interspersed Nuclear Elements (LINEs) in the mouse and human genomes (2, 3).
Is loss of env a cause or a consequence of the shift to retrotransposition? In mouse IAPs, loss of env appears to be a consequence: It has been shown experimentally that polymorphisms in the MA domain of the Gag protein direct the packaging of the IAP particles either toward the cell membrane or within the cisternae of the endoplasmic reticulum (14, 40). The MA domain in Gag has been shown to play the same role in an unrelated family of mouse ERVs called “musD” (41). Also, changes in the myristoylation signal of Gag in HIV restrict budding on the plasma membrane (42, 43). Thus the Gag protein appears to play a key role in determining the extracellular or intracellular fate of a retroviral life cycle. We assume that the Env protein, with its role in attachment and entry into the cell, becomes redundant when packaging occurs at the endoplasmic reticulum, and we see rapid loss on the phylogenetic trees (Fig. 2). However, as discussed above, the loss of env might determine the success of the shift to retrotransposition.
As mentioned in the Introduction, we did not analyze nonautonomous LTR-retrotransposons such as Mammalian apparent LTR-retrotransposons (MaLRs), which are ERV-like elements that lack pol and gag genes as well as env and replicate using proteins produced by other ERVs. For example, in the mouse genome there are four distinct groups of nonautonomous LTR-retrotransposons, each with a phylogenetically related ERV family that is assumed to replicate them (44). Our mining relies on the presence of pol, so these retrotransposons would be unlikely to be recovered. Loci can be copied by segmental genomic duplication, but this copying is negligible compared with other replication mechanisms in the ERV lineages (1, 6, 10).
Can we say anything about the generating process that creates our observed ERV family size distribution? If so, such a discussion might provide a method of producing null distributions and thus help detect biologically significant deviations. The widely used and well-described Gibrat’s law (the law of proportionate effect) states that if the size of an entity and its growth rate are independent, and the entities are of the same age, then the resulting distribution will be lognormal (45). However, if the entities are of different age (time is a random variable), then the resulting distribution will be lognormal with a power-law tail (46); such a distribution is called a “double Pareto-lognormal” distribution (24). ERV family size might be operating through Gibrat’s law; i.e., the size of the family and its growth rate might be independent, and because the family ages are different, the resulting distribution would then be a double Pareto-lognormal distribution. (Note, we are not suggesting that our megafamilies, which lie within this power-law tail, are larger because they are older than the other families; simply by mixing lognormal distributions from different time points we can generate a double Pareto-lognormal distribution in which megafamilies from different time points would lie within the power-law tail and have the same age as the smaller families within the lognormal body.)
Perhaps most importantly, our findings suggest that retroviral abundance, measured both horizontally and vertically, is on a continuum specified by the env gene: Gain of env allows the acquisition of new hosts by horizontal transfer (cross-species abundance), and loss of env is associated with substantially greater expansion within the genome (genomic abundance). The env gene thus has a key role in defining both the occurrence of ERVs in host species and their abundance within each genome.
Materials and Methods
Genome Mining.
We used an in silico approach detailed in SI Materials and Methods. We are confident that our rescreening with new divergent sequences allowed us to find the great majority of the pol-containing ERVs in the available genome sequence data.
Selection of Loci.
All IAPs invaded their hosts after speciation, but other ERV loci probably integrated around the origin of vertebrates and, although detectable, will have diverged to the extent that little sense can be made of their phylogenetic relationships. We therefore excluded all loci that did not have a 300-nt-long match of at least 90% sequence identity with at least one other locus. This criterion excluded less than half of the loci (46%) and, assuming that the ERV sequence divergence is not markedly dissimilar to that of their hosts, represents the exclusion of loci that had ceased replicating ∼25 million years ago (17), which is less than half the life of most mammalian orders. As shown in Fig. 1, a large majority of the mammals sequenced had diverged before this time, so loci in one genome should not have homologs in others. However, some primate and possibly the Mus/Rattus genomes diverged after this date. To avoid counting the same locus twice (i.e., commit pseudoreplication), we only used Mus, Homo, and Macaca to represent these clades In our analyses of family sizes. In theory, this process could exclude single-locus families; however, previous analyses of ERVs in the well-studied human genome have not revealed any single-locus families (47). Therefore, we do not expect this limitation to bias our analysis of family sizes.
Allocating Loci to Families.
The number of ERV families in each genome was measured using silhouette width, s, a composite index that reflects the compactness and separation of clusters. The procedure, automated in Perl software, was as follows. (i) For each genome, a matrix was made of all pairwise dissimilarities between recovered ERV nucleotide sequences using the EMBOSS water program (48), an implementation of the Smith–Waterman alignment algorithm (with gap opening and extension penalties of 10 and 4, respectively). (ii) Using silhouette from the partitioning around medoids method included in the Cluster package in R (49), the n sequences were partitioned into k clusters (where 2 < k < n − 1), and the mean value of s was calculated for each value of k. (iii) The k clusters associated with the highest mean value of s were designated as families, each of which was named provisionally according to the most common reference sequence allocated to that cluster. We then manually corrected the assignment to families, fusing or breaking clusters, by visually inspecting the dendrograms and taking into account large tree asymmetries, which the clustering algorithm fails to identify. We finally determined as megafamilies the two largest families within each genome that are larger than the top 1% of the expected family size assuming a random equal distribution of the loci among the families.
Quantifying ERV Expansion.
We measured whether a locus is a result of a low or high expansion history using ED, a measure originally conceived to provide a rational metric for prioritizing species conservation policies (50) and corrected by May (51) for nonbifurcating trees (polytomies). The ED metric is based on the idea that some lineages contain few species, and therefore their conservation should be prioritized (50, 51). It is implemented in the Tuatara package of Mesquite (52). ED is defined as the sum of the branches arising at each and for all subtending nodes (node score, s) standardized by dividing into the sum of it across the tree. For each taxon i in the N taxon tree the ED is thus defined as:
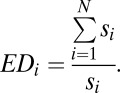 |
We use this formula instead of the inverse because it has better statistical properties: It is defined as a subset of the positive real numbers (1, +∞), whereas the inverse is a proportion and thus defined in the space (0,1).
The basal loci of an ERV lineage, which are thought to be closer to the initial events of the genome invasion and thus are the result of fewer replication cycles, would score a high ED value. On the other hand, more derived loci of an ERV lineage, which are thought to be the later events in an expansion and thus are the result of more replication cycles, would score a low ED value. Therefore, ED and the expansion of ERVs have a monotonically inverse correlation. Examples of calculating ED and the distribution of ED scores on the IAP tree are shown in Figs S7 and S8, and the robustness to phylogenetic uncertainty in Fig S9.
Correlating Gene Integrity with ED.
We used the GLS approach as implemented by the Analysis of Phylogenetics and Evolution (APE) package (53) in R (49), taking into account both nonindependence of the data caused by phylogenetic relatedness (54) and nonuniform trait evolution on the tree [for one human ERV family it has been shown that gene degradation is concentrated on the terminal branches on the tree (55)]. The effect of phylogenetic relatedness can be incorporated in APE by modifying the value of Pagel’s λ, and we created a multiplicative parameter (t) to transform the terminal branch lengths and allow a faster rate of gene degradation on the terminal branches of the tree. We used a range of different values for λ and t, and selected the best-fit model using the Akaike Information Criterion (56).
Further details on methodologies and details about alignment, phylogenetic analyses, simulating frequency distributions, gene integrity, indentifying and quantifying cross-species transmissions and invasions, and recombination analysis of env in IAPs are given in SI Materials and Methods.
Supplementary Material
Acknowledgments
G.M. and R.B are funded by the Wellcome Trust. A.K. is funded by the Royal Society.
Footnotes
The authors declare no conflict of interest.
This article is a PNAS Direct Submission.
This article contains supporting information online at www.pnas.org/lookup/suppl/doi:10.1073/pnas.1200913109/-/DCSupplemental.
References
- 1.Jern P, Coffin JM. Effects of retroviruses on host genome function. Annu Rev Genet. 2008;42:709–732. doi: 10.1146/annurev.genet.42.110807.091501. [DOI] [PubMed] [Google Scholar]
- 2.Waterston RH, et al. Mouse Genome Sequencing Consortium Initial sequencing and comparative analysis of the mouse genome. Nature. 2002;420:520–562. doi: 10.1038/nature01262. [DOI] [PubMed] [Google Scholar]
- 3.Lander ES, et al. International Human Genome Sequencing Consortium Initial sequencing and analysis of the human genome. Nature. 2001;409:860–921. doi: 10.1038/35057062. [DOI] [PubMed] [Google Scholar]
- 4.Tristem M. Identification and characterization of novel human endogenous retrovirus families by phylogenetic screening of the human genome mapping project database. J Virol. 2000;74:3715–3730. doi: 10.1128/jvi.74.8.3715-3730.2000. [DOI] [PMC free article] [PubMed] [Google Scholar]
- 5.Katzourakis A, Gifford RJ, Tristem M, Gilbert MT, Pybus OG. Macroevolution of complex retroviruses. Science. 2009;325:1512. doi: 10.1126/science.1174149. [DOI] [PubMed] [Google Scholar]
- 6.Bannert N, Kurth R. The evolutionary dynamics of human endogenous retroviral families. Annu Rev Genomics Hum Genet. 2006;7:149–173. doi: 10.1146/annurev.genom.7.080505.115700. [DOI] [PubMed] [Google Scholar]
- 7.Hanafusa H, Hanafusa T, Rubin H. The defectiveness of Rous sarcoma virus. Proc Natl Acad Sci USA. 1963;49:572–580. doi: 10.1073/pnas.49.4.572. [DOI] [PMC free article] [PubMed] [Google Scholar]
- 8.Goodchild NL, Freeman JD, Mager DL. Spliced HERV-H endogenous retroviral sequences in human genomic DNA: Evidence for amplification via retrotransposition. Virology. 1995;206:164–173. doi: 10.1016/s0042-6822(95)80031-x. [DOI] [PubMed] [Google Scholar]
- 9.Ribet D, et al. An infectious progenitor for the murine IAP retrotransposon: Emergence of an intracellular genetic parasite from an ancient retrovirus. Genome Res. 2008;18:597–609. doi: 10.1101/gr.073486.107. [DOI] [PMC free article] [PubMed] [Google Scholar]
- 10.Belshaw R, Katzourakis A, Paces J, Burt A, Tristem M. High copy number in human endogenous retrovirus families is associated with copying mechanisms in addition to reinfection. Mol Biol Evol. 2005;22:814–817. doi: 10.1093/molbev/msi088. [DOI] [PubMed] [Google Scholar]
- 11.Brookfield JFY. The ecology of the genome - mobile DNA elements and their hosts. Nat Rev Genet. 2005;6:128–136. doi: 10.1038/nrg1524. [DOI] [PubMed] [Google Scholar]
- 12.Venner S, Feschotte C, Biémont C. Dynamics of transposable elements: Towards a community ecology of the genome. Trends Genet. 2009;25:317–323. doi: 10.1016/j.tig.2009.05.003. [DOI] [PMC free article] [PubMed] [Google Scholar]
- 13.Dalton AJ, Potter M, Merwin RM. Some ultrastructural characteristics of a series of primary and transplanted plasma-cell tumors of the mouse. J Natl Cancer Inst. 1961;26:1221–1267. [PubMed] [Google Scholar]
- 14.Dewannieux M, Dupressoir A, Harper F, Pierron G, Heidmann T. Identification of autonomous IAP LTR retrotransposons mobile in mammalian cells. Nat Genet. 2004;36:534–539. doi: 10.1038/ng1353. [DOI] [PubMed] [Google Scholar]
- 15.Mietz JA, Grossman Z, Lueders KK, Kuff EL. Nucleotide sequence of a complete mouse intracisternal A-particle genome: Relationship to known aspects of particle assembly and function. J Virol. 1987;61:3020–3029. doi: 10.1128/jvi.61.10.3020-3029.1987. [DOI] [PMC free article] [PubMed] [Google Scholar]
- 16.Reuss FU, Schaller HC. cDNA sequence and genomic characterization of intracisternal A-particle-related retroviral elements containing an envelope gene. J Virol. 1991;65:5702–5709. doi: 10.1128/jvi.65.11.5702-5709.1991. [DOI] [PMC free article] [PubMed] [Google Scholar]
- 17.Kumar S, Subramanian S. Mutation rates in mammalian genomes. Proc Natl Acad Sci USA. 2002;99:803–808. doi: 10.1073/pnas.022629899. [DOI] [PMC free article] [PubMed] [Google Scholar]
- 18.Anderson RM, May RM. Infectious Diseases of Humans: Dynamics and Control. Oxford, UK: Oxford Univ Press; 1992. [Google Scholar]
- 19.Woolhouse ME, et al. Heterogeneities in the transmission of infectious agents: Implications for the design of control programs. Proc Natl Acad Sci USA. 1997;94:338–342. doi: 10.1073/pnas.94.1.338. [DOI] [PMC free article] [PubMed] [Google Scholar]
- 20.Galvani AP, May RM. Epidemiology: Dimensions of superspreading. Nature. 2005;438:293–295. doi: 10.1038/438293a. [DOI] [PMC free article] [PubMed] [Google Scholar]
- 21.Lloyd-Smith JO, Schreiber SJ, Kopp PE, Getz WM. Superspreading and the effect of individual variation on disease emergence. Nature. 2005;438:355–359. doi: 10.1038/nature04153. [DOI] [PMC free article] [PubMed] [Google Scholar]
- 22.Blomberg J, Benachenhou F, Blikstad V, Sperber G, Mayer J. Classification and nomenclature of endogenous retroviral sequences (ERVs): Problems and recommendations. Gene. 2009;448:115–123. doi: 10.1016/j.gene.2009.06.007. [DOI] [PubMed] [Google Scholar]
- 23.Luscombe NM, Qian J, Zhang Z, Johnson T, Gerstein M. The dominance of the population by a selected few: power-law behaviour applies to a wide variety of genomic properties. Genome Biol. 2002 doi: 10.1186/gb-2002-3-8-research0040. 3:research0040.1-0040.7. [DOI] [PMC free article] [PubMed] [Google Scholar]
- 24.Reed WJ, Jorgensen M. The double pareto-lognormal distribution - A new parametric model for size distributions. Commun Stat-Theor M. 2004;33:1733–1753. [Google Scholar]
- 25.Williamson M, Gaston KJ. The lognormal distribution is not an appropriate null hypothesis for the species-abundance distribution. J Anim Ecol. 2005;74:409–422. [Google Scholar]
- 26.Bell G. The distribution of abundance in neutral communities. Am Nat. 2000;155:606–617. doi: 10.1086/303345. [DOI] [PubMed] [Google Scholar]
- 27.Maksakova IA, et al. Retroviral elements and their hosts: Insertional mutagenesis in the mouse germ line. PLoS Genet. 2006;2:e2. doi: 10.1371/journal.pgen.0020002. [DOI] [PMC free article] [PubMed] [Google Scholar]
- 28.Katzourakis A, Rambaut A, Pybus OG. The evolutionary dynamics of endogenous retroviruses. Trends Microbiol. 2005;13:463–468. doi: 10.1016/j.tim.2005.08.004. [DOI] [PubMed] [Google Scholar]
- 29.Kim FJ, Battini JL, Manel N, Sitbon M. Emergence of vertebrate retroviruses and envelope capture. Virology. 2004;318:183–191. doi: 10.1016/j.virol.2003.09.026. [DOI] [PubMed] [Google Scholar]
- 30.Malik HS, Henikoff S, Eickbush TH. Poised for contagion: Evolutionary origins of the infectious abilities of invertebrate retroviruses. Genome Res. 2000;10:1307–1318. doi: 10.1101/gr.145000. [DOI] [PubMed] [Google Scholar]
- 31.Schaack S, Gilbert C, Feschotte C. Promiscuous DNA: Horizontal transfer of transposable elements and why it matters for eukaryotic evolution. Trends Ecol Evol. 2010;25:537–546. doi: 10.1016/j.tree.2010.06.001. [DOI] [PMC free article] [PubMed] [Google Scholar]
- 32.Sommerfelt MA. Retrovirus receptors. J Gen Virol. 1999;80:3049–3064. doi: 10.1099/0022-1317-80-12-3049. [DOI] [PubMed] [Google Scholar]
- 33.Stoye JP. Proviral protein provides placental function. Proc Natl Acad Sci USA. 2009;106:11827–11828. doi: 10.1073/pnas.0906295106. [DOI] [PMC free article] [PubMed] [Google Scholar]
- 34.Mangeney M, Heidmann T. Tumor cells expressing a retroviral envelope escape immune rejection in vivo. Proc Natl Acad Sci USA. 1998;95:14920–14925. doi: 10.1073/pnas.95.25.14920. [DOI] [PMC free article] [PubMed] [Google Scholar]
- 35.Mathes LE, et al. Immunosuppressive properties of a virion polypeptide, a 15,000-dalton protein, from feline leukemia virus. Cancer Res. 1979;39:950–955. [PubMed] [Google Scholar]
- 36.Boeke JD, Stoye JP. Retrotransposons, endogenous retroviruses, and the evolution of retroelements. In: Coffin JM, Hughes SH, Varmus HE, editors. Retroviruses. New York, NY: Cold Spring Harbor Laboratories; 1997. pp. 343–435. [PubMed] [Google Scholar]
- 37.Neil SJ, Zang T, Bieniasz PD. Tetherin inhibits retrovirus release and is antagonized by HIV-1 Vpu. Nature. 2008;451:425–430. doi: 10.1038/nature06553. [DOI] [PubMed] [Google Scholar]
- 38.Perez-Caballero D, et al. Tetherin inhibits HIV-1 release by directly tethering virions to cells. Cell. 2009;139:499–511. doi: 10.1016/j.cell.2009.08.039. [DOI] [PMC free article] [PubMed] [Google Scholar]
- 39.Jouvenet N, et al. Broad-spectrum inhibition of retroviral and filoviral particle release by tetherin. J Virol. 2009;83:1837–1844. doi: 10.1128/JVI.02211-08. [DOI] [PMC free article] [PubMed] [Google Scholar]
- 40.Fehrmann F, Jung M, Zimmermann R, Kräusslich HG. Transport of the intracisternal A-type particle Gag polyprotein to the endoplasmic reticulum is mediated by the signal recognition particle. J Virol. 2003;77:6293–6304. doi: 10.1128/JVI.77.11.6293-6304.2003. [DOI] [PMC free article] [PubMed] [Google Scholar]
- 41.Ribet D, Harper F, Dewannieux M, Pierron G, Heidmann T. Murine MusD retrotransposon: Structure and molecular evolution of an “intracellularized” retrovirus. J Virol. 2007;81:1888–1898. doi: 10.1128/JVI.02051-06. [DOI] [PMC free article] [PubMed] [Google Scholar]
- 42.Bryant M, Ratner L. Myristoylation-dependent replication and assembly of human immunodeficiency virus 1. Proc Natl Acad Sci USA. 1990;87:523–527. doi: 10.1073/pnas.87.2.523. [DOI] [PMC free article] [PubMed] [Google Scholar]
- 43.Göttlinger HG, Sodroski JG, Haseltine WA. Role of capsid precursor processing and myristoylation in morphogenesis and infectivity of human immunodeficiency virus type 1. Proc Natl Acad Sci USA. 1989;86:5781–5785. doi: 10.1073/pnas.86.15.5781. [DOI] [PMC free article] [PubMed] [Google Scholar]
- 44.McCarthy EM, McDonald JF. Long terminal repeat retrotransposons of Mus musculus. Genome Biol. 2004;5:R14. doi: 10.1186/gb-2004-5-3-r14. [DOI] [PMC free article] [PubMed] [Google Scholar]
- 45.Gibrat R. Les Inequalites Economiques. Paris: Librairie du Recueil Sirey; 1931. [Google Scholar]
- 46.Montroll EW, Shlesinger MF. On 1/f noise and other distributions with long tails. Proc Natl Acad Sci USA. 1982;79:3380–3383. doi: 10.1073/pnas.79.10.3380. [DOI] [PMC free article] [PubMed] [Google Scholar]
- 47.Gifford R, Tristem M. The evolution, distribution and diversity of endogenous retroviruses. Virus Genes. 2003;26:291–315. doi: 10.1023/a:1024455415443. [DOI] [PubMed] [Google Scholar]
- 48.Rice P, Longden I, Bleasby A. EMBOSS: The European Molecular Biology Open Software Suite. Trends Genet. 2000;16:276–277. doi: 10.1016/s0168-9525(00)02024-2. [DOI] [PubMed] [Google Scholar]
- 49.R Development Core Team 2008. R: A language and environment for statistical computing. Available at http://www.R-project.org.
- 50.Vanewright RI, Humphries CJ, Williams PH. What to protect - systematics and the agony of choice. Biol Conserv. 1991;55:235–254. [Google Scholar]
- 51.May RM. Taxonomy as Destiny. Nature. 1990;347:129–130. [Google Scholar]
- 52.Maddison WP, Maddison DR. 2010. Mesquite: A modular system for evolutionary analysis.), version 2.73.
- 53.Paradis E, Claude J, Strimmer K. APE: Analyses of Phylogenetics and Evolution in R language. Bioinformatics. 2004;20:289–290. doi: 10.1093/bioinformatics/btg412. [DOI] [PubMed] [Google Scholar]
- 54.Harvey PH, Pagel MD. The Comparative Method in Evolutionary Biology. Oxford, UK: Oxford Univ Press; 1991. [Google Scholar]
- 55.Belshaw R, et al. Long-term reinfection of the human genome by endogenous retroviruses. Proc Natl Acad Sci USA. 2004;101:4894–4899. doi: 10.1073/pnas.0307800101. [DOI] [PMC free article] [PubMed] [Google Scholar]
- 56.Akaike H. A new look at the statistical model identification. IEEE Trans Automat Contr. 1974;19:716–723. [Google Scholar]
- 57.Bininda-Emonds OR, et al. The delayed rise of present-day mammals. Nature. 2007;446:507–512. doi: 10.1038/nature05634. [DOI] [PubMed] [Google Scholar]
Associated Data
This section collects any data citations, data availability statements, or supplementary materials included in this article.