Abstract
Microorganisms are widely used to generate valuable products, and their efficiency is a major industrial focus. Bioreactors are typically composed of billions of cells, and available measurements only reflect the overall performance of the population. However, cells do not equally contribute, and process optimization would therefore benefit from monitoring this intrapopulation diversity. Such monitoring has so far remained difficult because of the inability to probe concentration changes at the single-cell level. Here, we unlock this limitation by taking advantage of the osmotically driven water flux between a droplet containing a living cell toward surrounding empty droplets, within a concentrated inverse emulsion. With proper formulation, excreted products are far more soluble within the continuous hydrophobic phase compared to initial nutrients (carbohydrates and salts). Fast diffusion of products induces an osmotic mismatch, which further relaxes due to slower diffusion of water through hydrophobic interfaces. By measuring droplet volume variations, we can deduce the metabolic activity down to isolated single cells. As a proof of concept, we present the first direct measurement of the maintenance energy of individual yeast cells. This method does not require any added probes and can in principle apply to any osmotically sensitive bioactivity, opening new routes for screening, and sorting large libraries of microorganisms and biomolecules.
Keywords: biosensors, metabolism
Microorganisms, including bacteria, yeast, fungi, and algae, have the potential to safely produce valuable molecules for various fields of applications, including sustainable energy, packaging, detergency, food, cosmetics, and therapeutics (1–3). In all cases, optimizing the yield of production by choosing the best microorganism phenotypes remains a key advantage, raising the importance of monitoring parameters of individual cells. This monitoring implies measuring the rate of nutrient consumption, or the rate of metabolite production, for each single cell, which has so far remained impossible because of the difficulty in detecting small concentration changes around each isolated cell in a large population. Inverse emulsion droplets (water droplets dispersed in an oil phase) have been increasingly used over the past decade to compartmentalize biomolecules or cells for individual assays or amplification (4–8). Interestingly, when droplet compositions change, droplets can exhibit composition ripening (9). Indeed, if two droplets have different concentrations of some solute, either water or the solute molecule will diffuse to equilibrate chemical potentials; the relaxation is dominated by the fastest diffusing species, which in the case of inverse emulsion is water. We therefore reasoned that if bioactivity within a drop lowers its overall solute concentration, this would decrease the water chemical potential and induce a water flux outward. As a result, droplets with high bioactivity would progressively decrease in size, as already observed (10, 11). We detail the key criteria that emulsions must satisfy to exhibit this active coarsening. We then demonstrate that the sensitivity of this coarsening allows nutrient consumption to be detected in very small exponentially growing microcolonies as well as for single nondividing cells. We then determine the statistical distribution of the maintenance energy of individual yeast cells at various ploidies, revealing at the microscopic level the relationship between size and glucose consumption. We finally illustrate the universality of this osmotic phenomenon in the cases of bacterial growth and a lytic enzymatic reaction.
Results
In the presence of glucose, yeast metabolism is dominated by fermentation, where 1 mol of glucose provides 2 mol of ATP (12) from the following chemical equation: C6H12O6 + 2ADP + 2Pi → 2C2H5OH + 2CO2 + 2ATP. For ripening to occur and reflect glucose consumption, a number of criteria must be satisfied by the emulsion formulation. First, waste products of fermentation (carbon dioxide and ethanol) must diffuse out of the droplet faster than water. This diffusion is essential to decrease the total solute concentration within the yeast-containing droplets (called nursing droplets hereafter) and thereby to create a chemical potential mismatch as a result of nutrient consumption. Secondly, solely water but not nutrients must diffuse out of the nursing droplet so that the relaxation of this osmotic mismatch induces a change in droplet size. Finally, because products remaining entrapped in cells (ATP) do not contribute to osmotic change, the measurable droplet shrink rate quantitatively reflects nutrients uptake.
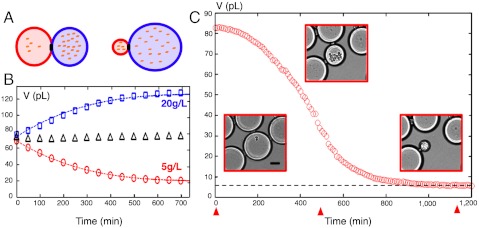
To fulfill these requirements, we chose an organic continuous phase consisting of a mixture of mineral oil and a partially fluorinated alkane chain containing 0.75% of a surfactant blend. This particular blend and the continuous phase composition produced a controlled adhesion (wetting) between droplet interfaces (13). Using this formulation, contacts between adjacent drops formed a bilayer structure associated with a contact angle (Fig. S1). Adhesion imposes the distance between all the adhesive droplets and thus provides a homogeneous exchange rate overall the emulsion that is a least two times faster than for a nonadhesive formulation (see SI Text, Formulation and Diffusion Model and Parameters, Without Cells). To check if the above criteria were obeyed by this formulation, we first brought into adhesive contacts droplets that contained different concentrations of glucose in water. As expected, the volume of droplets having a high glucose concentration increases to the detriment of the less concentrated ones (Fig. 1A and Movie S1). This observation is consistent with water diffusing across the hydrophobic membrane from the less concentrated drop toward the most concentrated one in the absence of any glucose permeation. For dilute solutions (μ ∼ c), water transport parameters can be estimated from water diffusion relaxation curves obeying Fick’s law:
 |
[1] |
where V is the volume of the drop, vw is the molar volume of water, Δc is the time-dependent glucose concentration mismatch between the two adhesive droplets and F is a transport factor reflecting membrane properties, which can be written as F = DAK/d, where D is the diffusion coefficient into the oil membrane, A and d are the area and thickness of the adhesive bilayer, respectively, and K is the solubility of the diffusing species into the oil membrane (14). We then performed the same experiment to measure the equilibration time from a concentration mismatch in ethanol. We brought into adhesive contact two droplets having equal concentration of glucose and salt, adding 1 M of ethanol in only one of them. This experiment did not result in any observable change in droplet sizes over time, consistent with ethanol diffusing out much faster than water (Fig. S2 and Movie S2). Such phenomenon is in perfect agreement with the values of K in olive oil (15), which change by more than three orders of magnitude between glucose (3 × 10⁻⁵), water (10-3), and ethanol (3 × 10⁻²). Finally, because it is highly soluble in the oil (16), carbon dioxide diffuses faster than water or is totally dissolved into the oil. Hence, it does not contribute to the osmotic mismatch either. Altogether, these properties set the basis of our strategy to measure the rate of glucose consumption by living cells.
Fig. 1.
Osmotic ripening. (A) Illustration of the osmotic-driven coarsening of two droplets in contact. Water flows from the most concentrated to the less concentrated drop to equilibrate solute concentrations (dots). (B) Corresponding experiment. A droplet containing 5 g/L of glucose (red circles) was brought in contact with a droplet containing 20 g/L glucose (blue squares). Dashed lines, fit of experimental data after solving numerically Eq. 1. Black triangles, total volume divided by 2, which is conserved. (C) Volume evolution of a droplet containing S. cerevisiae cells (nursing droplet). (Insets) Transmission images of droplets at three different times indicated by red arrowheads. Dashed line, volume at final equilibrium, Vss. (Scale bar: 50 μm.)
Single yeasts cells were encapsulated in droplets made of synthetic culture medium using a flow-focusing microfluidic device (see Materials and Methods and Fig. S3). Because encapsulation is a stochastic process following a Poisson law (17), the dilution was adapted so that, on average, one droplet over 25 contained a single yeast cell. Droplets with a diameter of 50 μm were then squeezed and packed within a container having a height of 25 μm and a surface of a few square centimeters. This way, a two-dimensional dense network of adhesive droplets was created. This connected network provided mechanical stability of the system, which helped in tracking droplet positions and contours over long periods of time. The surface fraction of droplets ranged from 40% to 60% (Fig. S3C). We observed that the growth of yeast colonies was accompanied by a progressive decrease of the nursing droplets size, down to a volume (Vss) less than 10% of their initial volume (V0) (Fig. 1C and Movie S3). As expected, the shrinkage of nursing droplets was always accompanied by a slight volume augmentation of the surrounding empty ones, which is consistent with mass conservation of water. Let us define s0, the sum of glucose  and nonglucose
  molecules at t = 0, and sss, the amount of solute molecules left within the nursing droplets at final state. If we neglect the slight volume change of empty drops, and assume an ideal osmotic pressure (18), then
| [2] |
providing a direct link between the coarsening amplitude Vss/V0 and the total uptake of the colony (s0 - sss). Thus, changing the initial amount of glucose  should affect the amplitude of shrinkage accordingly. To verify this prediction, we performed a series of measurements at increasing values of initial glucose concentrations (Table S1). As expected, shrinkage amplitude was directly affected, ranging from 55% of the initial volume at 10 g/L initial glucose to 5% at 200 g/L initial glucose. The amount of nutrient uptake deduced from Eq. 2 directly followed the initial amount of glucose (Fig. S4), which indicated that glucose was entirely exhausted at the end of the experiment. Having established that droplet coarsening is a reliable readout of glucose consumption by microcolonies, we decided to monitor the time course of this process for (i) a growing colony exhausting sugar, (ii) a colony starved from a nonglucose limiting nutrient, and (iii) arrested single cells maintaining their metabolism.
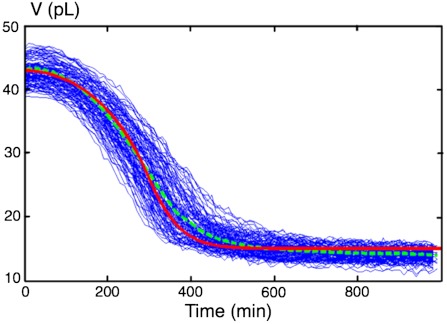
Fig. 2 shows a typical experiment where founder cells were encapsulated in 20 g/L glucose medium and were allowed to grow exponentially. Hundreds of nursing droplets were monitored simultaneously. In order to interpret these curves into quantitative estimates of biological activity, we considered the following dynamical model. First, because the vast majority of droplets in the interconnected network did not contain any cell, we assumed that empty droplets surrounding nursing ones could be considered as an infinite reservoir of constant water chemical potential. Within this approximation, the evolution of nursing droplets volume is described by the following equation:
| [3] |
The amount of substrate in the nursing droplet, s(t), can be written as s(t) = s0 - β(t)/Y where β(t) is the biomass which grows exponentially with a doubling time τ: β(t) = β02t/τ, β0 being the initial amount of biomass, and Y is the growth yield (19). Once τ is estimated by independent measurements from bulk cultures, and Y chosen from the literature (12), Eq. 3 can be numerically solved to obtain a master curve of shrinkage kinetic (Fig. 2, red curve). We observed a remarkably good agreement between model and measurements, indicating that metabolic activity could indeed be inferred from the droplet shrinkage.
Fig. 2.
Shrinkage of nursing drops: coupling between growth and metabolism. Cells were encapsulated in culture medium containing 20 g/L glucose, where glucose becomes limiting. Blue, experimental curves for 195 droplets. Green dashed line, mean curve. Red, master curve obtained from the model using Y = 0.15 g(biomasse)/g(glucose) and τ = 120 min.
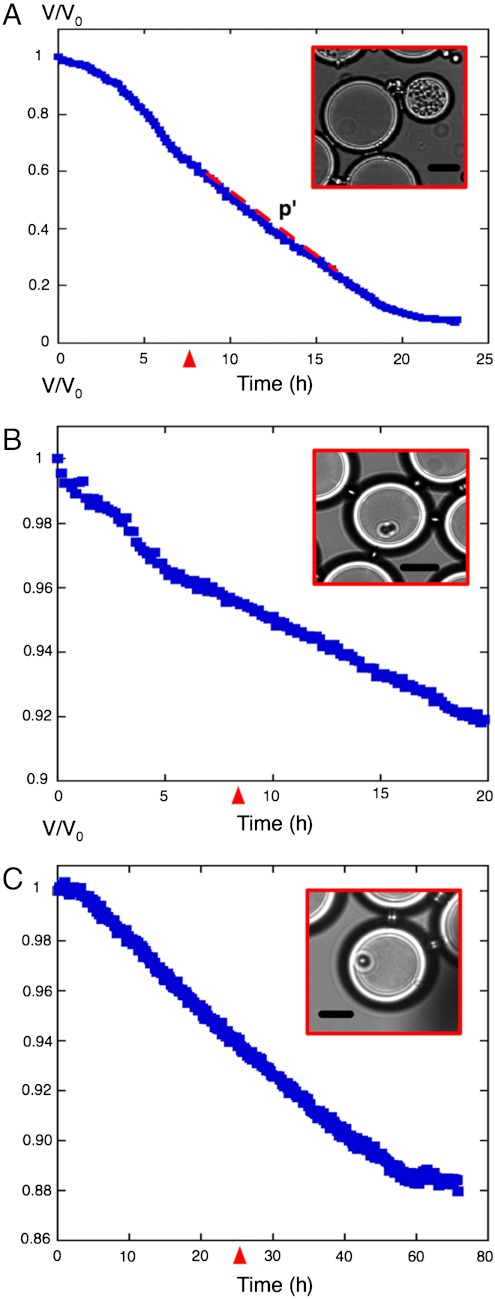
As for classical fermentors, bioactivity of a growing population both reflects division (biomass increase) and metabolism. To measure metabolic activity more specifically, we sought to decouple it from cell growth by studying populations of nondividing cells. This decoupling can be achieved easily by culturing cells in a medium where a nutrient other than glucose becomes limiting. The colony is then expected to enter a stationary phase of growth while still fermenting glucose (20), which is precisely what we observed when using a high initial concentration of glucose: 150 g/L (Fig. 3A). After 7 h, shrinkage became linear with time. Because water diffusion is fast enough as compared to substrate consumption in this linear regime (SI Text, Diffusion Model and Parameters, Without Cells), Eq. 2 can be approximated by V(t)/V0 = s(t)/s0 and glucose consumption can then be directly deduced from the slope p′ by p′ = βcqm/s0, where qm is the so-called maintenance energy (21) of the cells, and βc is the amount of biomass reached at stationary state, which is also proportional to the amount of limiting nutrient. Therefore, the slope should double if the amount of limiting nutrient is doubled, and it should reduce by 50% if the initial amount of glucose is doubled. Dedicated experiments verified both predictions (Fig. S5). After measuring βc from bulk experiments, we deduced qm = 0.1–0.2 pg (glucose)·cell-1· min-1. This value is consistent with previous extrapolations from experiments performed in chemostats (22, 23) or measuring the uptake of radiolabeled glucose (24).
Fig. 3.
Decoupling metabolism from growth. Droplet volume was tracked over time. (A) Growth of a microcolony at 150 g/L initial glucose. The volume decay becomes linear after about 7 h (red arrowhead). (B) A cdc28 mutant cell blocked in G1 was encapsulated at 38 °C in 20 g/L glucose containing droplets. (C) A leu2 auxotroph cell encapsulated in SD medium lacking leucine with 20 g/L of glucose. (Insets) Transmission images of droplets at times indicated by red arrowheads. (Scale bars: 25 μm.)
Given the fine-scale sensitivity of this coarsening, we sought to detect the glucose consumption rate of individual yeast cells. To do this, we encapsulated cdc28 thermosensitive mutants and tracked them at restrictive temperature (25). As expected, droplets containing a single-cell blocked in G1 displayed a linear regime of shrinkage (Fig. 3B). The consumption rate of these cells can be deduced from the slope as above, and was found again to be 0.2 pg (glucose)·cell-1· min-1. As a complementary way to monitor single cells, we encapsulated leu2 mutants into droplets lacking leucine. This experiment led also to a linear shrinkage (Fig. 3C), and the maintenance energy of these cells was estimated to be on the order of qm = 0.1 pg (glucose)·cell-1· min-1. Note that, after a prolonged time, consumption eventually stopped, probably because of cell death.
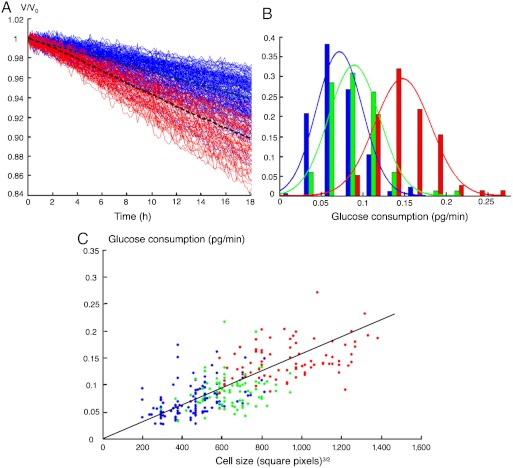
Many yeast strains used for industrial fermentations are polyploids (26), and increasing the ploidy has long been known to be associated with faster metabolic rates (27). However, this link was never observed at a single-cell resolution. Given our ability to monitor high numbers of individual cells in parallel, we sought to visualize the statistical distributions of consumption rates within populations of different ploidies. Fig. 4 shows the simultaneous acquisition of glucose uptake from over 100 individual cells for each of 2n, 3n, and 4n ploidies. Distributions of consumption rates were significantly different between the three populations, confirming a higher per-cell metabolic efficiency at high ploidy. The size of living cells is also known to increase with ploidy (28). To examine how cell size correlated with fermentation efficiency in these populations, we extracted cell-size estimates (Fig. S6), confirming the large size of polyploid cells and revealing a strong overall correlation between size and metabolic rate (Fig. 4C). Importantly, this correlation remained significant within each of the three populations, showing that size and glucose uptake are coupled.
Fig. 4.
Glucose consumption by single yeast cells of different ploidies. The leu2 mutant cells were encapsulated in 20 g/L of glucose SD medium lacking leucine. (A) Time evolution of the droplet volume normalized by initial volume for diploid (blue) and tetraploid (red) cells. Dashed lines, mean curves. For clarity, triploid cells are not represented. From each slope, glucose consumption was calculated (see Fig. S6). (B) Probability density function of glucose consumption for diploid (177 cells, blue), triploid (84 cells, green), and tetraploid cells (78 cells, red). (C) Glucose consumption scales with cell size. Each dot represents one diploid (blue), triploid (green), or tetraploid (red) cell. Cell size was estimated from images as described in Fig. S1E.
Discussion
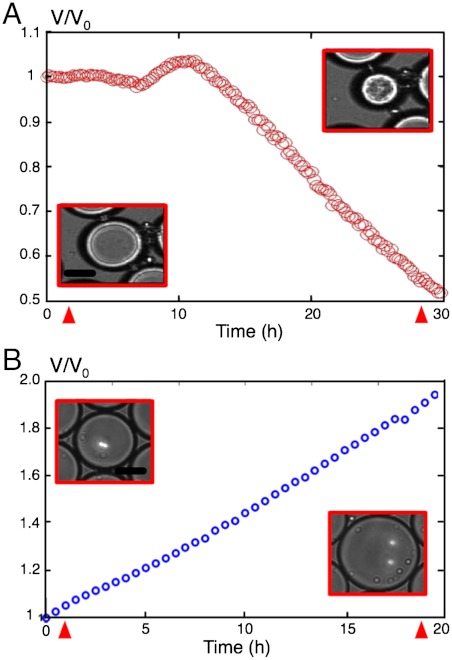
In this work, we have demonstrated the exquisite sensitivity of the coarsening response induced by the glucose consumption of yeast cells. Even a single cell is shown to induce a measurable shrinking rate of its own droplet reservoir, providing a direct measurement of its individual maintenance energy. By positioning nursing droplets within a large immobilized and connected 2D network, we were able to monitor the consumption of more than 100 individual cells in parallel for many hours, providing reliable statistics. The case of yeast fermenting is particularly well suited to quantitatively determine cellular bioenergetics. Due to the very large solubility mismatch between excreted products and initial nutrients, yeast metabolism in droplets instantaneously translates into an osmotic pressure mismatch. Indeed, CO2 is mostly dissolved in the continuous phase and ethanol is transferred to the empty droplets. The shrinking rate is, in that case, directly and quantitatively reflecting the glucose consumption. However, nutrient uptake may, in other cases, produce a lower osmotic change because of a larger solubility of some products in the continuous phase. Therefore the overall osmotic response might become smaller. Though absolute bioenergetics parameters may not be directly accessible, at least relative distributions can still be determined. Also, exploring phenotypic diversity within a variety of microorganisms and conditions must remain possible. Indeed, the method seems valid for a wide range of microorganism metabolisms. We also observed similar shrinkage when growing Escherichia coli cells in M9 medium (Fig. 5A and Movie S4). The shape is quite different from yeast experiments. We suggest the following mechanism: At the beginning of glucose fermentation, organic acidic products accumulate in the drop because they are dissociated. It leads to a volume increase and a pH decrease. When pH is low enough, acids are protonated so that they can diffuse out of the nursing droplets toward the empty ones, which may explain the observed shrink. The same strategy can in principle be applied to monitor various enzymatic activities as long as osmotic pressure is modified. For example, we could track the progressive enzymatic digestion of albumin by a protease simply by measuring the progressive swelling of droplets that resulted from the release of peptides in the solution (Fig. 5B and Movie S5).
Fig. 5.
Other examples of biologically induced ripening. (A) Volume evolution of a droplet containing E. coli in M9 medium supplemented with 0.1 mM CaCl2, 1 mM MgSO4, 1 g/L casamino acid, and 45 g/L of glucose (pH = 7.4). After a small increase in size, the droplet shrinks to half its initial volume within 30 h. (Insets) Transmission images of droplets at times indicated by red arrowheads. (Scale bars: 25 μm.) (B) Volume evolution of a droplet containing 0.2 mM of BSA, in Tris/HCl buffer (pH = 7.5) in the presence of 40 μg/mL of protease K. As the BSA is digested by the protease, the droplet inflates to reach twice the initial volume. (Insets) Transmission images of droplets at times indicated by red arrowheads. (Scale bars: 40 μm.)
This approach may also in principle be applied to genomics as for detecting particular mutations on genomic DNA: When both primers and genes randomly coexist within the same drop, by applying many polymerase chain reaction cycles, nucleic acid polymerization should also induce droplet shrinking due to osmotic change. Finally, droplet volume by itself offers simple routes for sorting of positive drops, either using a microfluidic or a macroscopic approach. A variety of microfluidic approaches have been described to separate droplets of different sizes (30, 31). One such technique has previously been used to separate droplets which have shrunk because they contain yeast cells (11). At a larger scale, a three-dimensional self-separation may also be possible. Indeed, if the droplets contain dense molecules/particles that do not contribute to the osmotic effect, a volume change should be associated with a density change. Then, self-separation by sedimentation or creaming could be possible by adjusting a posteriori the continuous phase density.
Overall, this work raises the evidence that encapsulating bioactive systems within droplets of the right size and properties leads to a very sensitive readout without using any added probes, opening new routes for screening and sorting among large libraries of microorganisms and biomolecules.
Materials and Methods
Strains and Cultivation Conditions.
Saccharomyces cerevisiae strains used are described in Table S2. The cells were grown in synthetic defined (SD) medium as described by Sherman (29), supplemented with 20–200 g/L of glucose.
For single-cell experiments based on leucine auxotrophy, cells were grown in nonrestrictive medium (SD-all) until they reached exponential phase. They were then washed in restrictive medium (SD-L) three times and incubated 2 h at 30 °C in SD-L. They were then encapsulated inside droplets and stored at 30 °C.
For single-cell experiments based on the thermosensitive mutant cdc28, cells were grown in SD-all at permissive temperature (30 °C) until they reached exponential phase. They were then capsulated and maintained at restrictive temperature (38 °C).
Formulation.
The continuous phase is a mixture of 52% (wt/wt) of mineral oil (Sigma) and 48% (wt/wt) of highly purified perfluorohexyloctane (F6H8; Fluoron GmbH). To stabilize the emulsion, we added 0.5% (wt/wt) Span80 (Sigma-Aldrich) and 0.25% (wt/wt) of ArlacelP125 (Croda). For BSA experiments only, we used the same formulation as prepared in Brouzes et al. (8). BSA and Tris/HCl were bought from Sigma-Aldrich and protease K from Fermentas.
Device Manufacturing and Operation.
To generate the emulsion, we used a microfluidic polydimethylsiloxane device with a flow-focusing geometry and an extraction region as prepared in Brouzes et al. (8) and illustrated in Fig. S3. Typical flow rates for the aqueous phase were 80–100 μL/h and for the continuous phase 400 μL/h. The average drop size was between 40 and 60 μm in diameter. The droplets were stored in a custom-made glass chamber of 25-μm depth. Fluorescent 3-μm beads were used to label droplets containing 20 g/L glucose for calibration of transport coefficient experiments. All devices were kept in thermoregulated chambers (Life Imaging Services).
Time-Lapse Microscopy.
We observed the droplet network at 30 °C using a Nikon T300 inverted microscope with a Thorlabs MAX202 XY stage. Images were acquired every 10 min with a Hamamatsu Orca-ER camera. We used custom-made Labview software to automate image acquisition and microscope control.
Image and Data Analysis.
Analysis (Fig. S7) and modeling (Fig. S8) were performed with custom-made Matlab software.
Supplementary Material
ACKNOWLEDGMENTS.
We thank M. Aigle, B. Dujon, and E. Braun for their discussions; M. Charbonneau and N. Grandin (Ecole Normale Supérieure de Lyon, Laboratoire de Biologie Moléculaire de la Cellule, Université Lyon 1) for the cdc28 strain; M. Aigle (Université Claude Bernard de Lyon) for strains of increasing ploidies; and Q. Fahy for his help in the preliminary experiments. This work was supported by Grant ANR-07-BLAN-0070 from Agence Nationale de la Recherche, France.
Footnotes
The authors declare no conflict of interest.
This article is a PNAS Direct Submission.
This article contains supporting information online at www.pnas.org/lookup/suppl/doi:10.1073/pnas.1200894109/-/DCSupplemental.
References
- 1.Shaw AJ, et al. Metabolic engineering of a thermophilic bacterium to produce ethanol at high yield. Proc Natl Acad Sci USA. 2008;105:13769–13774. doi: 10.1073/pnas.0801266105. [DOI] [PMC free article] [PubMed] [Google Scholar]
- 2.Van den Berg JA, et al. Kluyveromyces as a host for heterologous gene expression: Expression and secretion of prochymosin. Nat Biotechnol. 1990;8:135–139. doi: 10.1038/nbt0290-135. [DOI] [PubMed] [Google Scholar]
- 3.Scott SA, et al. Biodiesel algae: Challenges and prospects. Curr Op Biotechnol. 2010;21:277–286. doi: 10.1016/j.copbio.2010.03.005. [DOI] [PubMed] [Google Scholar]
- 4.Tawfik DS, Griffiths AD. Man-made cell-like compartments for molecular evolution. Nat Biotechnol. 1998;16:652–656. doi: 10.1038/nbt0798-652. [DOI] [PubMed] [Google Scholar]
- 5.Margulies M, et al. Genome sequencing in open microfabricated high density picolitre reactors. Nature. 2005;437:376–380. doi: 10.1038/nature03959. [DOI] [PMC free article] [PubMed] [Google Scholar]
- 6.Leamon JH, Link DR, Egholm M, Rothberg JM. Overview: Methods and applications for droplet compartmentalization of biology. Nat Methods. 2006;3:541–543. doi: 10.1038/nmeth0706-541. [DOI] [PubMed] [Google Scholar]
- 7.Kumaresan P, Chaoyong JY, Cronier SA, Blazej RJ, Mathies RA. High-throughput single copy DNA amplification and cell analysis in engineered nanoliter droplets. Anal Chem. 2008;80:3522–3529. doi: 10.1021/ac800327d. [DOI] [PubMed] [Google Scholar]
- 8.Brouzes E, et al. Droplet microfluidic technology for single-cell high-throughput screening. Proc Natl Acad Sci USA. 2009;106:14195–14200. doi: 10.1073/pnas.0903542106. [DOI] [PMC free article] [PubMed] [Google Scholar]
- 9.Kabalnov AS, Pertzov AV, Shchukin ED. Ostwald ripening in two-component disperse phase systems: Application to emulsion stability. Colloid Surface. 1987;24:19–32. [Google Scholar]
- 10.Schmitz CHJ, Rowat AC, Köster S, Weitz DA. Dropspots: A picoliter array in a microfluidic device. Lab Chip. 2009;9:44–49. doi: 10.1039/b809670h. [DOI] [PubMed] [Google Scholar]
- 11.Joensson HN, Uhlén M, Svahn HA. Droplet size based separation by deterministic lateral displacement—separating droplets by cell-induced shrinking. Lab Chip. 2011;11:1305–1310. doi: 10.1039/c0lc00688b. [DOI] [PubMed] [Google Scholar]
- 12.Bauchop T, Elsden SR. The growth of micro-organisms in relation to their energy supply. J Gen Microbiol. 1960;23:457–469. doi: 10.1099/00221287-23-3-457. [DOI] [PubMed] [Google Scholar]
- 13.Poulin P, Bibette J. Adhesion of water droplets in organic solvent. Langmuir. 1998;14:6341–6343. [Google Scholar]
- 14.Zwolinski BJ, Eyring H, Reese CE. Diffusion membrane permeabilities. J Phys Chem. 1949;53:1426–1454. [Google Scholar]
- 15.Collander R. The permeability of nitella cells to rapidly penetrating non-electrolytes. Physiol Plant. 1950;3:45–57. [Google Scholar]
- 16.Kubie L. The solubility of O2, CO2, and N2 in mineral oil and the transfer of carbondioxide from oil to air. J Biol Chem. 1927;72:545–548. [Google Scholar]
- 17.Köster S, et al. Drop-based microfluidic devices for encapsulation of single cells. Lab Chip. 2008;8:1110–1115. doi: 10.1039/b802941e. [DOI] [PubMed] [Google Scholar]
- 18.Cabane B, Henon S. Liquids: Solutions, Dispersions, Emulsions, Gels. Paris: Belin; 2003. [Google Scholar]
- 19.Monod J. The growth of bacterial cultures. Annu Rev Microbiol. 1949;3:371–394. [Google Scholar]
- 20.Russell JB, Cook GM. Energetics of bacterial-growth: Balance of anabolic and catabolic reactions. Microbiol Mol Biol Rev. 1995;59:48–62. doi: 10.1128/mr.59.1.48-62.1995. [DOI] [PMC free article] [PubMed] [Google Scholar]
- 21.Pirt SJ. Maintenance energy of bacteria in growing cultures. Proc R Soc B. 1965;163:224–231. doi: 10.1098/rspb.1965.0069. [DOI] [PubMed] [Google Scholar]
- 22.Watson TG. Effects of sodium chloride on steady-state growth and metabolism of Saccharomyces cerevisiae. J Gen Microbiol. 1970;64:91–99. doi: 10.1099/00221287-64-1-91. [DOI] [PubMed] [Google Scholar]
- 23.Verduyn C, Postma E, Scheffers WA, van Dijken JP. Energetics of Saccharomyces cerevisiae in anaerobic glucose-limited chemostat cultures. J Gen Microbiol. 1990;136:405–412. doi: 10.1099/00221287-136-3-405. [DOI] [PubMed] [Google Scholar]
- 24.Does AL, Bisson LF. Comparison of glucose uptake kinetics in different yeasts. J Bacteriol. 1989;171:1303–1308. doi: 10.1128/jb.171.3.1303-1308.1989. [DOI] [PMC free article] [PubMed] [Google Scholar]
- 25.Hartwell LH, Culotti J, Pringle JR, Reid BJ. Genetic control of the cell division cycle in yeast. Science. 1974;183:46–51. doi: 10.1126/science.183.4120.46. [DOI] [PubMed] [Google Scholar]
- 26.Querol A, Bond U. The complex and dynamic genomes of industrial yeasts. FEMS Microbiol Lett. 2009;293:1–10. doi: 10.1111/j.1574-6968.2008.01480.x. [DOI] [PubMed] [Google Scholar]
- 27.Dilorio AA, Weathers PJ, Campbele DA. Comparative enzyme and ethanol production in an isogenic yeast ploidy series. Curr Genet. 1987;12:9–14. [Google Scholar]
- 28.Cook M, Tyers M. Size control goes global. Curr Op Biotechnol. 2007;18:341–350. doi: 10.1016/j.copbio.2007.07.006. [DOI] [PubMed] [Google Scholar]
- 29.Sherman F. Getting started with yeast. Meth Enzymol. 2002;350:3–41. doi: 10.1016/s0076-6879(02)50954-x. [DOI] [PubMed] [Google Scholar]
- 30.Tan YC, Fisher JS, Lee AI, Cristini V, Lee AP. Design of microfluidic channel geometries for the control of droplet volume, chemical concentration, and sorting. Lab Chip. 2005;5:1178–11832. doi: 10.1039/b403280m. [DOI] [PubMed] [Google Scholar]
- 31.Chabert M, Viovy JL. Microfluidic high-throughput encapsulation and hydrodynamic self-sorting of single cells. Proc Natl Acad Sci USA. 2008;105:3191–3196. doi: 10.1073/pnas.0708321105. [DOI] [PMC free article] [PubMed] [Google Scholar]
Associated Data
This section collects any data citations, data availability statements, or supplementary materials included in this article.


