Abstract
A method of eliminating pixelization effect from en face optical coherence tomography (OCT) image when a fiber bundle is used as an OCT imaging probe is presented. We have demonstrated that applying a histogram equalization process before performing a weighted-averaged Gaussian smoothing filter to the original lower gray level intensity based image not only removes the structural artifact of the bundle but also enhances the image quality with minimum blurring of object’s image features. The measured contrast-to-noise ratio (CNR) for an image of the US Air Force test target was 14.7dB (4.9dB), after (before) image processing. In addition, by performing the spatial frequency analysis based on two-dimensional discrete Fourier transform (2-D DFT), we were able to observe that the periodic intensity peaks induced by the regularly arrayed structure of the fiber bundle can be efficiently suppressed by 41.0dB for the first nearby side lobe as well as to obtain the precise physical spacing information of the fiber grid. The proposed combined method can also be used as a straight forward image processing tool for any imaging system utilizing fiber bundle as a high-resolution imager.
OCIS codes: (060.2350) Fiber optics imaging, (100.2980) Image enhancement, (170.4500) Optical coherence tomography
1. Introduction
Fiber bundles or fiber arrays have been extensively used as effective imaging probes in high-resolution optical imagings such as endoscope, confocal microscopy, two-photon microscopy, fluorescence imaging, and low coherence optical imaging due to their inherent features that make it possible to achieve an effective high resolution endoscopic imaging determined by the overall structural dimension of the fiber bundle and the total number of the fiber cores/pixels at the object/sample [1–9]. The use of a fiber bundle for OCT eliminates the need of a scanning mechanism in front of the specimen. Thus, it is possible not only to miniaturize the probe design but also to accommodate imaging of the moving or live biological samples less invasively [10–16]. The lateral scanning, in sensitive environments such as inside brain or eye, can be performed at the proximal end of the fiber, outside of the organ. This requires a delicate optical coupling to each fiber pixel which can be smaller in diameter than the typical single mode fiber core. In-depth analyses over fiber bundles have been performed based on the fiber dimensions (core size, core spacing, fiber length) and the optical parameters (refractive indices, NA) by using both experimental and numerical/theoretical methods to thoroughly characterize the properties of the fiber imagers [17–21]. Especially, in the case of OCT, fiber bundle imagers have recently been suggested due to their merits for use in a variety of applications for micro-structural or biological sample imaging. However the results have not been promising due to the coupling light into the single core and the non-uniformity of the fiber array [22–26]. Thus, in order to obtain a reasonable image at reasonable speed, the fiber bundle has to be over-scanned instead of scanning core to core. This results in, for example, 1,000,000 image pixels for a 10,000 pixel fiber bundle and only 10,000 pixels out of 1,000,000 pixels represent the ideal sampling. This reduces the overall quality of the fiber bundle based OCT imager significantly.
There have been several previous works that have dealt with the image processing methods to remove the fiber bundle’s pixelation artifact (like a honeycomb) or to enhance the image quality suffered due to the inherent arrangement of grid fibers. Oh et al. [24] applied a disk filter which is a circular averaging filter for an OCT image. However the method was limited because all the image pixel data are treated with the same importance without any mask coefficient difference with the disk filter. Helmchen et al. [9] introduced a Gaussian blurring (smoothing) filter for the two photon microscopy, which was not highly effective since it caused the image blurring that reduced the image contrast and resulted in the loss of high spatial frequency components. Winter et al. [27] employed different types of automatic spectral domain filter masks for fiber optic endoscope image in which an indirect spectral domain filtering was applied to a relatively poor resolution object (~1mm). Suter et al. [28] used high pass filtering of the periodic grid frequency components in order to remove all the higher spatial frequency components while leaving the ones near the centered peak components which without it will cause loss in desired signal or deteriorate the image. The methods using selective frequency filtering are not practical when the obtained image contains complicated frequency distribution. Alaruria et al. [29] used a high-pass spatial filtering in a fluorescence image and Dickens et al. [30] applied band reject filtering to the gray scale level of the image spectrum. These results failed to evaluate the image in views of distribution of image histogram and the precise spatial frequency analysis after the Fourier transform to evaluate whether or not the image was improved in terms of the image CNR which is typically used as figure of merit [31–36].
In this work, we propose a method to improve the OCT images obtained from a common-path (CP) Fourier domain (FD) OCT with a fiber bundle probe by employing both histogram equalization method to pre-enhance the raw image incorporating limited lower gray intensity scales with a pixelation effect and post-process the image using a Gaussian spatial smoothing filter which acts as a low pass filter in a frequency domain as well as to effectively decouple the fiber pixels from the image. We have evaluated the image histogram, CNR, and spectrum for a quantitative comparison. The combined method provided a straight forward real-time image processing method for improving the images obtained using a fiber bundle.
2. Methods
2.1 OCT setup
The schematic view of the OCT imaging setup is shown in Fig. 1(a) which is a Fourier domain common-path optical coherence tomography with a fiber bundle as an imaging probe. The center wavelength and the 3dB-width of the broadband source (super luminescence diode, SLD) are 830nm and 40nm, respectively and the output power was approximately 2mW. We used a 76mm-long rigid coherent fiber bundle (Edmund Optics Inc.) having a numerical aperture of 0.53, individual core spacing of 50µm (total number of fibers: 3,000), and refractive indices for core and cladding, 1.49 and 1.58, respectively. The lateral (transversal) scanning for the imaging fiber was performed not at the object (sample) site but at the remote site where the galvanometer or other two-dimensional sweepings are possible. The data were equally sampled every 5µm both in x- and y- spatial directions. By using a well-defined structure of the US Air Force (USAF) resolution target, we were able to evaluate the quality of our image processing method more precisely than using irregular or non-uniform patterns. In Fig. 1(b), the Scanning Electron Microscope (SEM) image of the used fiber bundle imager is shown where the scratches or scarred pixels are easily observable on the bundle surface as well as the clean ones, which directly influenced the quality of resultant sample images. (The inset scale bar represents 100µm). Details of the experimental setup are reported in the previous results in [25].
Fig. 1.
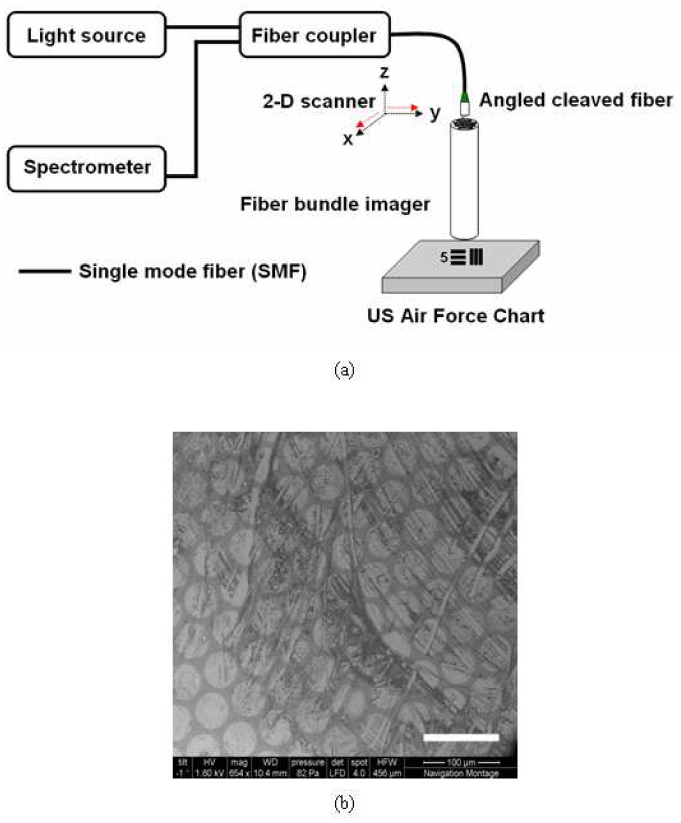
OCT setup with a fiber bundle probe: (a) Fourier domain common path optical coherence tomography; (b) surface image of fiber bundle taken by scanning electron microscope (SEM). (Scale bar: 100µm)
2.2 Image histogram (intensity distribution) equalization
Histogram equalization is a simple and effective way of adjusting image contrast using the histogram of the image, especially for low contrast gray images with limited scale levels. It is based on a point transformation of gray levels in the input image so that intensities of the resulting image can be better distributed by effectively spreading out the most frequent pixel values [37]. It uses cumulative distribution function (CDF) of the gray scale values of the input image, , as a transformation such that the CDF of the transformed image is linearized, i.e., gray value is mapped to by,
where, n is the total number of pixels, is the number of pixels that have a specific intensity j, and L is the total number of gray levels in the input image. Since maps the input gray levels to the range , the output image can have a full range of possible gray levels by the following simple transformation:
where and are the maximum and minimum possible gray levels, respectively.
2.3 Gaussian spatial smoothing
In order to remove irrelevant details and bridge the small gaps shown in an original OCT image, , one can blur the image with smoothing filters, [38]. The resulting blurred image, is computed as
where, denotes two-dimensional (2-D) convolution. There are several spatial smoothing filters that could be used for eliminating the fiber bundle effect even though they would blur the edges due to the smoothing operation. Typical spatial smoothing filters such as a simple rectangular neighborhood averaging filter and other non-symmetric filters fail to accommodate the circularity of the fiber pixel dimension. With a modification to a circular averaging mask without any pixel weight, a disk filter has been utilized to significantly reduce the pixelation artifact [24]. A Gaussian smoothing filter is a form of weighted average with different coefficients multiplied to the pixels having peak at the center and tapering down as the Euclidean distance from the center pixel increases. The Gaussian filter can accommodate the circularity of the fiber structure and its corresponding symmetrical dimension by controlling the filter parameters. By introducing a weighted average in a circular spatial filter, the fiber bundle artifact has been effectively alleviated [9]. The normalized rotationally symmetric Gaussian (low-pass) filter is defined as,
where, , and σ determines the filter width. Figure 2 shows an example of a Gaussian smoothing filter response with window size of 19 × 19 pixels and the filter width of σ = 5 pixels. Note that the filter is normalized so that the total sum of weights is equal to unity. (We have compared the effect of both parameters in the Gaussian filter later in the following chapter.)
Fig. 2.
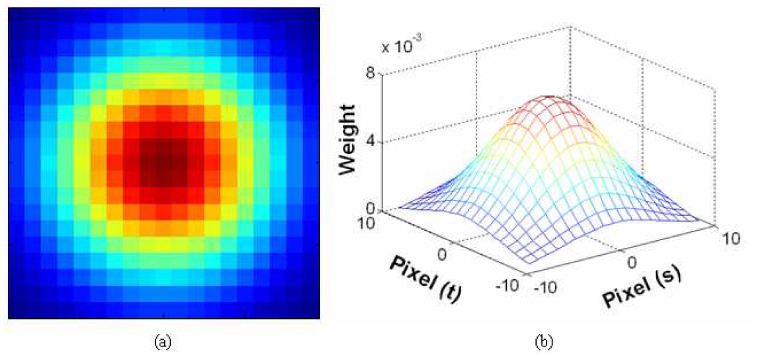
Response of a Gaussian smoothing filter: (a) 2-D response (h) with colored representation; (b) 3-D response in a mesh form with corresponding weights.
3. Results and discussions
By B-mode (x-axis direction) and C-mode (y-axis direction) pseudo-scanning the Air Force target at the remote site, we have obtained its en face image ( ) by slicing the volumetric image as shown in Fig. 3(a) . We can clearly see the structure of the arrayed fibers as well as the element bar patterns of the sample target. This pixelization limits the resolution and the contrast of the image [25]. The corresponding 2-D magnitude of the discrete Fourier transform (DFT) is shown in Fig. 3(b) and the peak frequency spacing (~20,000m−1) matches to the spatial spacing of the periodically-spaced fiber cores (~50µm), which could be understood as a reciprocal space or a lattice in a crystalline solid [39].
Fig. 3.
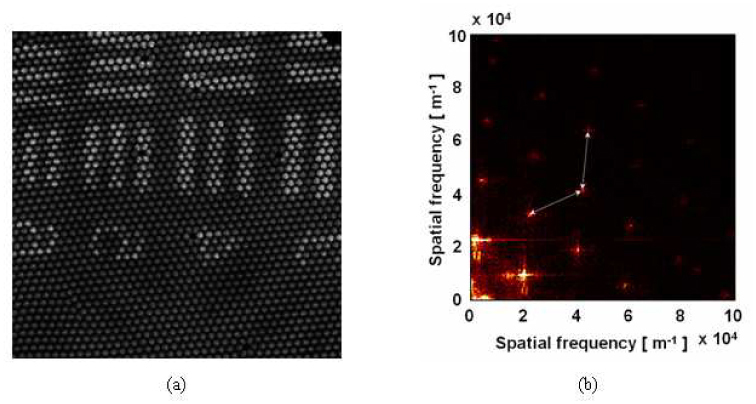
Obtained original unprocessed OCT en face image of US Air Force target: (a) original image with fiber pixelation effect; (b) Magnitude of 2-D discrete Fourier transform of the image.
After analyzing the histogram or intensity distribution of the original unprocessed image in Fig. 3(a), we have observed that the most of the pixel values are distributed in the lower region of the available gray levels (L=256 or 0-255 levels) as shown in Fig. 4(a) . The histogram equalization transfer function, , which is the CDF of the original image is shown in the inset as well. We then fully mapped all the gray scale values of the original image to the full range of gray levels, i.e., 0-255, in our experiments. This is very useful since the relatively small signal obtained by OCT can be effectively enhanced or brightened without losing any of the original information. By applying histogram equalization to the raw image, we can highlight the image from lower gray scales by increasing the scale levels as shown in Fig. 4(b). In this case, in addition to the enhanced intensities for the image patterns, the relatively low intensity backgrounds are also enhanced. After enhancing the image contrast, we eliminated the pixelation of the fiber bundle by applying Gaussian smoothing filter with 19×19 window and σ=5 pixels to obtain the intended final image as shown in Fig. 5(a) . Due to the pre-enhancement using the histogram equalization, we were able to observe element numbers and the bars clearly without presence of any fiber pixelization effect. In addition, other structural features such as larger scratches represented by darker patterns pointed out by arrows as well as damaged fiber pixels became clearly visible. Figure 5(b) illustrates the changes in the histogram of the processed image (red dotted line) compared to the original image (blue solid line), where it has moved from the narrow lower range to a moderate scale level with a broader width. For finite image histogram, we can further improve the image contrast by clipping histogram edges below 50 and/or above 200 so that additional contrast stretching can be achieved without image deformation.
Fig. 4.
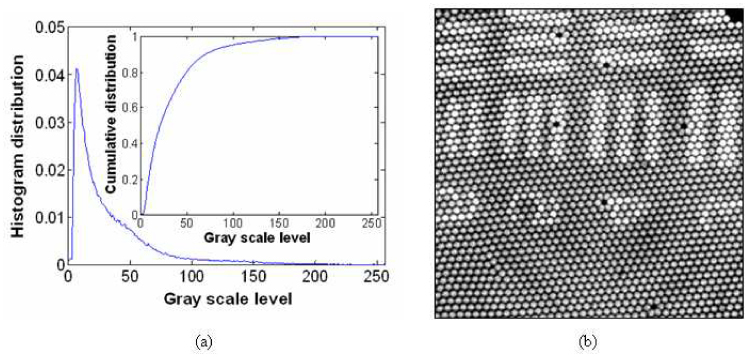
Results of histogram equalization method: (a) histogram distribution (probability) of the raw image with gray scale level (inset: corresponding transfer function of the histogram equalization); (b) USAF chart image after histogram equalization.
Fig. 5.
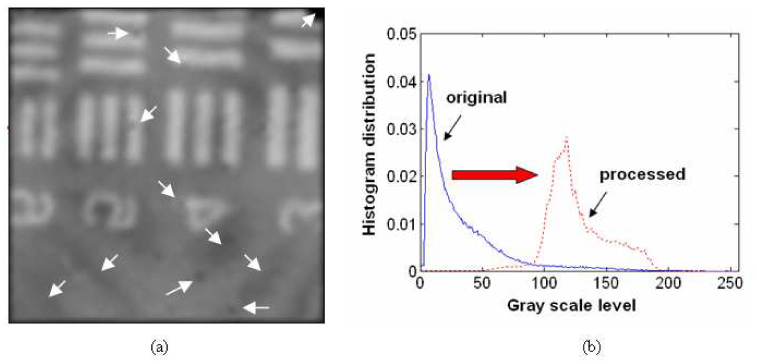
Gaussian smoothing filtered result with a pre histogram equalized image: (a) USAF chart image with combined histogram equalization and Gaussian weighted filter; (b) histogram comparison between before (blue solid line) and after (red dotted line) image processing.
Meanwhile, as in Ref [9], using Gaussian smoothing filter without applying the histogram enhancement method can also remove the fiber pixelization effect as presented in Fig. 6(a) using our original OCT image (Fig. 3(a)). In Fig. 6(b), the resultant histogram of the processed image experiences minimal change due to the weighted averaging effect. However, the image histogram is still concentrated rather in the lower gray scale range (centered at its average scale value) which is not ideal for differentiating the details when it is displayed compared to our combined method containing the histogram equalization method. Furthermore, we have lost (at least for a human viewer) some of other surface features of the fiber by applying smoothing filter which averaged or blended the image information as well as reduced the intensity level by half (the image is darker than the original one). Those features were obvious in our result in Fig. 5(a). Here, we should mention that applying additional histogram technique after this Gaussian filter deteriorates the image because this enhances the already averaged gray scale values of the backgrounds and the signal patterns which make it difficult to differentiate each other. In our work, we have successfully demonstrated that by inserting the histogram equalization as a pre-process before applying the Gaussian smoothing filter, we could obtain clear and detail features in the OCT image after Gaussian filtering. This would be preferred for real tissue imaging having less abrupt edges compared to that in the USAF chart. In this case, the edge blurring effect can be ignored if the size of fiber pixel is relatively smaller than the sample pattern. Otherwise, the image resolution is limited by fiber pixel dimension so that finer pixel size is required to appropriately image the sample/pattern. The edge blurring can also be compensated by applying other de-blurring or image segmentation algorithms if needed [40].
Fig. 6.
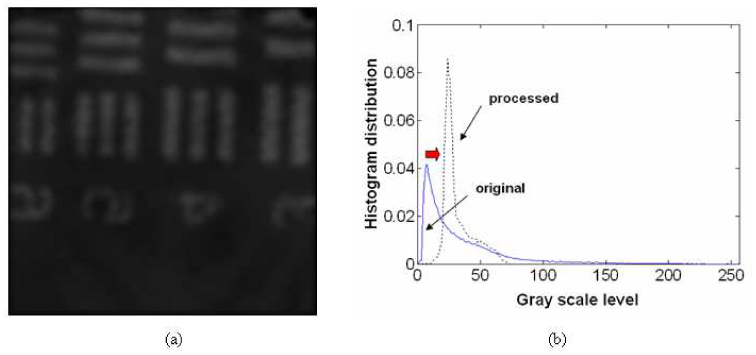
Image result after applying Gaussian smoothing filter only: (a) chart image after Gaussian filtering; (b) corresponding histogram of the processed image (original image: blue solid line; processed image: black dotted line). Inset figure: spatial frequency information (original image: blue solid line; processed image: green dotted line).
In terms of spatial frequencies, i.e., magnitude of the Fourier transform of the image [see Fig. 7(a) ], we have observed that the histogram equalization sharpens the side lobes (black dashed line) by adjusting contrast of the image. However, we have also observed that the high frequency components created by the periodic spacing of the fibers are suppressed by Gaussian smoothing filter (red dotted line) which acts as a low pass filter, resulting in the side lobe reduction by 40.99dB (marked with a red arrow: the spectral density is squared to the FFT magnitude). In comparison, there is no significant difference taking only smoothing filter without histogram equalization. In addition, the figures of merit for images such as contrast (marked with black square) and the CNR (marked with blue circle) are shown in Fig. 7(b). Image contrast is defined as,
where, is the mean pixel value of the object (patterns) region and is the mean pixel value of the background (no pattern) region. The corresponding CNR of the image is computed by,
where, is the standard deviation of the noise in the background region. After the histogram equalization, both the contrast and the CNR slightly decreased because not only the gray scale values of the background ( ) but also the background noise variation ( ) increased. However, the Gaussian low pass filter decreases the background variation which improved the CNR by more than 13dB and 9.8dB enhancement for the histogram equalized image and for the unprocessed raw original image, respectively, with minimum change to the image contrast.
Fig. 7.
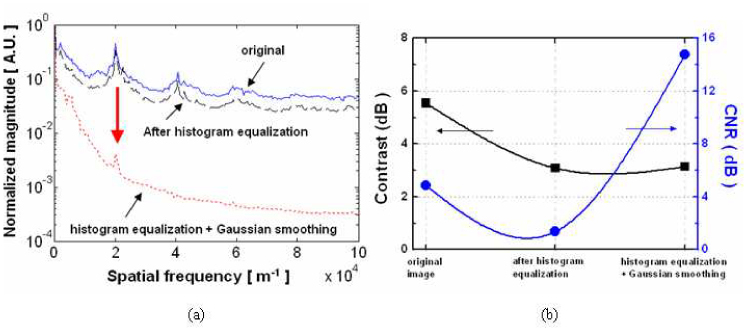
Comparison in characteristics of the image: (a) magnitude of Fourier transforms (blue solid line for original image; black dashed line for histogram equalized image; red dotted line for Gaussian smoothing filtered image with pre-histogram equalization); (b) image contrast and CNR (left y-axis for contrast with black square; right y-axis for CNR with blue circle).
The effect of the Gaussian filter width and window size on the image quality is compared in Fig. 8 where the image contrast varies less than 0.5dB (Fig. 8(a)) no matter what filter parameters are used whereas the CNR enhancement was dependent on those parameters in Fig. 8(b). If the filter width is less than 3 pixels, the processed image, even after Gaussian smoothing, still contains the fiber pixel effect. For larger filter dimensions and width, the images were blurred too much and lost the sharpness of the bar patterns and the small surface features of the bundle. This result matches well when one consider the data sampling rate of each image pixel ( : 5µm) with the fiber core spacing (~50µm). Therefore, to decouple the honey-comb effect of the fiber grid, the smoothing filter should cover the whole fiber core with significant mask coefficients at least for each core area, which is represented by filter parameters, size and width, of the Gaussian smoothing filter. Thus, the optimized conditions for the filter parameters in our case for achieving the pixel removal with minimum image deformation (distinctive features incorporated in the original image) are and . The inset in Fig. 8(a) shows the histogram of the resultant images for with where there is no significant change observable in the histogram distribution.
Fig. 8.
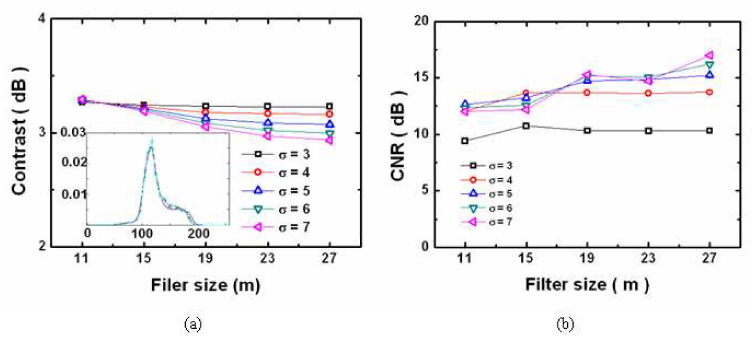
Comparison in image qualities of Gaussian filtered image with various filter parameters (filter size, m, and filter width, σ) post the histogram equalization: (a) image contrast; (b) image CNR.
The detailed mapping image results are shown in Fig. 9 for comparison where each row represents for filter width and each column for filter size m = 11,15,19,23,27, respectively. Essentially those parameters of the image filters should be considered based on several conditions for optimization: size of fiber core, separation of adjacent cores, number of image pixels dedicated to a single fiber core, and the dimension of a sample object. Thus, the full width of the Gaussian filter ( ) was set to cover the entire core spacing in the fiber bundle [9]. In our case, the filter width (σ), pixel distance, and the core spacing were 5, 5, and 50 respectively. The optimized mask size of the filter was found based on the analysis result in Fig. 8. Thus, the selected combination for filter parameters was and in our experiment as presented in Fig. 9(m). The filtered images, however, should be carefully compared because the figure of merits could be greater even though there still remains fiber bundle artifact. For further quantitative evaluation of the image quality with different filter parameters, one may use alternative image quality metrics such as mean square error (MSE), provided that there exists a reference image, , that does not have fiber bundle artifact. For each filtered output image, , the MSE can be computed as [41],
Because we do not have a clean reference image that does not have fiber bundle artifact, CNR and image contrast (C) are compared before and after image processing [42–45].
Fig. 9.
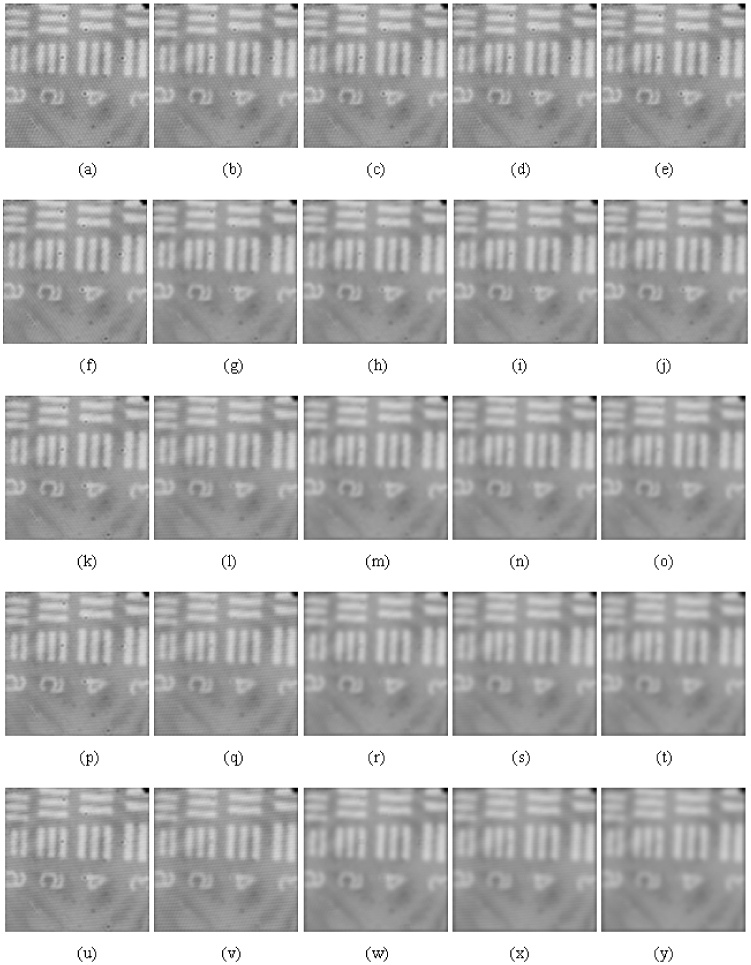
Corresponding processed image results by various filter parameters in Fig. 8: (a) ; (b) ; (c) ; (d) ; (e) ; (f) ; (g) ; (h) ; (i) ; (j) ; (k) ; (l) ; (m) ; (n) ; (o) ; (p) ; (q) ; (r) ; (s) ; (t) ; (u) ; (v) ; (w) ; (x) ; (y) .
Since there was no lens on the sample side of the bundle, and using a relatively high NA (0.53) fiber, the imaging depth was approximately ~500µm from the end of the fiber bundle. Therefore, the pixelation effect was different at different depths for thick samples which we did not address in this work. However, the purpose of this preliminary work was to study the effectiveness of the method in eliminating the pixelation effect in an en face OCT image based on a fiber bundle imager. By doing so, we were able to compare other previous results utilizing the fiber bundle imager and present the effectiveness of our proposed method. In this case, as an advantage, we can set a rather symmetrical image kernel that can be applied for both directions in the image plane. However, image processing for a depth-resolved 2-D image should be dealt in a different way because it lacks the symmetry between the lateral (B-mode) and axial (A-mode) directions in the acquired image. For a 3-D (including C-mode) volumetric image, the same 2-D plane mask that we used in this work can be applied at different depth layers so that all the possible en face image in different depths construct the whole 3-D volume image. For a 2-D cross-sectional (B-mode) image, the filter mask should be reduced to a 1-D line to process each depth layer line by line because there is no relationship between lateral and depth scanning directions. Our current work was rather a study targeted for a 2-D en face image incorporating only lateral dimensions at the target surface which can clearly visualize the fiber arrangement artifact as the SEM image in Fig. 1(b). This proposed image processing method can be extended for different imaging dimensions such as 3-D volumetric and 2-D cross-sectional images.
4. Conclusions
We have successfully removed the discrete honeycomb artifact of the fiber bundle structure by introducing the combination of histogram equalization and Gaussian spatial smoothing for an en face OCT image obtained using a fiber bundle imaging probe. The histogram equalization effectively transforms the gray scale to the higher range and Gaussian low pass filter removes the pixelization effect with an enhanced CNR from 4.9dB to 14.7dB as well as suppressing the higher frequency components due to the periodic array of the fibers by more than 40dB. This allowed clear observation of the detail features of the image and this combined method can be computed in real time.
Acknowledgement
This research is supported, in part, by NIH grant 1R21NS063131-01A1.
References and links
- 1.Lázaro J. L., Fernández P. R., Gardel A., Cano A. E., Luna C. A., “Sensor calibration based on incoherent optical fiber bundles (IOFB) used for remote image transmission,” Sensors 9(10), 8215–8229 (2009). 10.3390/s91008215 [DOI] [PMC free article] [PubMed] [Google Scholar]
- 2.Gift A. D., Ma J., Haber K. S., McClain B. L., Den-Amotz D., “Near-infrared Raman imaging microscope based on fiber-bundle image compression,” J. Raman Spectrosc. 30(9), 757–765 (1999). [DOI] [Google Scholar]
- 3.Lane P. M., Dlugan A. L. P., Richards-Kortum R., Macaulay C. E., “Fiber-optic confocal microscopy using a spatial light modulator,” Opt. Lett. 25(24), 1780–1782 (2000). 10.1364/OL.25.001780 [DOI] [PubMed] [Google Scholar]
- 4.Engelbrecht C. J., Johnston R. S., Seibel E. J., Helmchen F., “Ultra-compact fiber-optic two-photon microscope for functional fluorescence imaging in vivo,” Opt. Express 16(8), 5556–5564 (2008). 10.1364/OE.16.005556 [DOI] [PubMed] [Google Scholar]
- 5.Chiarulli D. M., Levitan S. P., Derr P., Hofmann R., Greiner B., Robinson M., “Demonstration of a multichannel optical interconnection by use of imaging fiber bundles butt coupled to optoelectronic circuits,” Appl. Opt. 39(5), 698–703 (2000). 10.1364/AO.39.000698 [DOI] [PubMed] [Google Scholar]
- 6.Flusberg B. A., Cocker E. D., Piyawattanametha W., Jung J. C., Cheung E. L. M., Schnitzer M. J., “Fiber-optic fluorescence imaging,” Nat. Methods 2(12), 941–950 (2005). 10.1038/nmeth820 [DOI] [PMC free article] [PubMed] [Google Scholar]
- 7.Pyhtila J. W., Boyer J. D., Chalut K. J., Wax A., “Fourier-domain angle-resolved low coherence interferometry through an endoscopic fiber bundle for light-scattering spectroscopy,” Opt. Lett. 31(6), 772–774 (2006). 10.1364/OL.31.000772 [DOI] [PubMed] [Google Scholar]
- 8.Gmitro A. F., Aziz D., “Confocal microscopy through a fiber-optic imaging bundle,” Opt. Lett. 18(8), 565–567 (1993). 10.1364/OL.18.000565 [DOI] [PubMed] [Google Scholar]
- 9.Göbel W., Kerr J. N., Nimmerjahn A., Helmchen F., “Miniaturized two-photon microscope based on a flexible coherent fiber bundle and a gradient-index lens objective,” Opt. Lett. 29(21), 2521–2523 (2004). 10.1364/OL.29.002521 [DOI] [PubMed] [Google Scholar]
- 10.Sung K.-B., Liang C., Descour M., Collier T., Follen M., Richards-Kortum R., “Fiber-optic confocal reflectance microscope with miniature objective for in vivo imaging of human tissues,” IEEE Trans. Biomed. Eng. 49(10), 1168–1172 (2002). 10.1109/TBME.2002.803524 [DOI] [PubMed] [Google Scholar]
- 11.Flusberg B. A., Nimmerjahn A., Cocker E. D., Mukamel E. A., Barretto R. P. J., Ko T. H., Burns L. D., Jung J. C., Schnitzer M. J., “High-speed, miniaturized fluorescence microscopy in freely moving mice,” Nat. Methods 5(11), 935–938 (2008). 10.1038/nmeth.1256 [DOI] [PMC free article] [PubMed] [Google Scholar]
- 12.Schmidt F. E. W., Fry M. E., Hillman E. M. C., Hebden J. C., Delpy D. T., “A 32-channel time-resolved instrument for medical optical tomography,” Rev. Sci. Instrum. 71(1), 256–265 (2000). 10.1063/1.1150191 [DOI] [Google Scholar]
- 13.Dubaj V., Mazzolini A., Wood A., Harris M., “Optic fibre bundle contact imaging probe employing a laser scanning confocal microscope,” J. Microsc. 207(2), 108–117 (2002). 10.1046/j.1365-2818.2002.01052.x [DOI] [PubMed] [Google Scholar]
- 14.Srivastava S., Rodríguez J. J., Rouse A. R., Brewer M. A., Gmitro A. F., “Computer-aided identification of ovarian cancer in confocal microendoscope images,” J. Biomed. Opt. 13(2), 024021 (2008). 10.1117/1.2907167 [DOI] [PubMed] [Google Scholar]
- 15.Oron D., Tal E., Silberberg Y., “Scanningless depth-resolved microscopy,” Opt. Express 13(5), 1468–1476 (2005). 10.1364/OPEX.13.001468 [DOI] [PubMed] [Google Scholar]
- 16.Spitz J.-A., Yasukuni R., Sandeau N., Takano M., Vachon J.-J., Meallet-Renault R., Pansu R. B., “Scanning-less wide-field single-photon counting device for fluorescence intensity, lifetime and time-resolved anisotropy imaging microscopy,” J. Microsc. 229(1), 104–114 (2008). 10.1111/j.1365-2818.2007.01873.x [DOI] [PubMed] [Google Scholar]
- 17.Murukeshan V. M., Sujatha N., Ong L. S., Singh A., Seah L. K., “Effect of image fiber on the speckle fringe pattern in image fiber-guided DSPI endoscopy,” Opt. Laser Technol. 39(3), 527–531 (2007). 10.1016/j.optlastec.2005.11.001 [DOI] [Google Scholar]
- 18.Chen X., Reichenbach K. L., Xu C., “Experimental and theoretical analysis of core-to-core coupling on fiber bundle imaging,” Opt. Express 16(26), 21598–21607 (2008). 10.1364/OE.16.021598 [DOI] [PubMed] [Google Scholar]
- 19.Reichenbach K. L., Xu C., “Numerical analysis of light propagation in image fibers or coherent fiber bundles,” Opt. Express 15(5), 2151–2165 (2007). 10.1364/OE.15.002151 [DOI] [PubMed] [Google Scholar]
- 20.Udovich J. A., Kirkpatrick N. D., Kano A., Tanbakuchi A., Utzinger U., Gmitro A. F., “Spectral background and transmission characteristics of fiber optic imaging bundles,” Appl. Opt. 47(25), 4560–4568 (2008). 10.1364/AO.47.004560 [DOI] [PubMed] [Google Scholar]
- 21.Sun J., Huang Q., Gilbert J. A., “Comparing cross talk in doped scintillating-fiber bundles,” Appl. Opt. 34(9), 1536–1539 (1995). 10.1364/AO.34.001536 [DOI] [PubMed] [Google Scholar]
- 22.Xie T., Mukai D., Guo S., Brenner M., Chen Z., “Fiber-optic-bundle-based optical coherence tomography,” Opt. Lett. 30(14), 1803–1805 (2005). 10.1364/OL.30.001803 [DOI] [PubMed] [Google Scholar]
- 23.Ford H. D., Tatam R. P., “Fibre imaging bundles for full-field optical coherence tomography,” Meas. Sci. Technol. 18(9), 2949–2957 (2007). 10.1088/0957-0233/18/9/027 [DOI] [Google Scholar]
- 24.Oh W. Y., Bouma B. E., Iftimia N., Yelin R., Tearney G. J., “Spectrally-modulated full-field optical coherence microscopy for ultrahigh-resolution endoscopic imaging,” Opt. Express 14(19), 8675–8684 (2006). 10.1364/OE.14.008675 [DOI] [PMC free article] [PubMed] [Google Scholar]
- 25.Han J.-H., Liu X., Song C. G., Kang J. U., “Common path optical coherence tomography with fibre bundle probe,” Electron. Lett. 45(22), 1110–1112 (2009). 10.1049/el.2009.1627 [DOI] [PMC free article] [PubMed] [Google Scholar]
- 26.Wang W., Zhang K., Ren Q., Kang J. U., “Comparison of different focusing systems for common-path optical coherence tomography with fiber-optic bundle as endoscopic probe,” Opt. Eng. 48(10), 103001 (2009). 10.1117/1.3250270 [DOI] [Google Scholar]
- 27.Winter C., Rupp S., Elter M., Münzenmayer C., Gerhäuser H., Wittenberg T., “Automatic adaptive enhancement for images obtained with fiberscopic endoscopes,” IEEE Trans. Biomed. Eng. 53(10), 2035–2046 (2006). 10.1109/TBME.2006.877110 [DOI] [PubMed] [Google Scholar]
- 28.Suter M., Reinhardt J., Montague P., Taft P., Lee J., Zabner J., McLennan G., “Bronchoscopic imaging of pulmonary mucosal vasculature responses to inflammatory mediators,” J. Biomed. Opt. 10(3), 034013 (2005). 10.1117/1.1924714 [DOI] [PubMed] [Google Scholar]
- 29.Alaruria S., Bonsetta T., Smitha D., Macria F., Brewingtona A., Wildman D., “An endoscopic imaging system for turbine engine pressure sensitive paint measurements,” Opt. Lasers Eng. 36(3), 277–287 (2001). 10.1016/S0143-8166(01)00049-5 [DOI] [Google Scholar]
- 30.Dickens M. M., Houlne M. P., Mitra S., Bornhop D. J., “Method for depixelating micro-endoscopic images,” Opt. Eng. 38(11), 1836–1842 (1999). 10.1117/1.602235 [DOI] [Google Scholar]
- 31.Dellenback P. A., Macharivilakathu J., Pierce S. R., “Contrast-enhancement techniques for particle-image velocimetry,” Appl. Opt. 39(32), 5978–5990 (2000). 10.1364/AO.39.005978 [DOI] [PubMed] [Google Scholar]
- 32.Ishitani T., Sato M., “Evaluation of both image resolution and contrast-to-noise ratio in scanning electron microscopy,” J. Electron Microsc. (Tokyo) 56(4), 145–151 (2007). 10.1093/jmicro/dfm007 [DOI] [PubMed] [Google Scholar]
- 33.Baldelli P., Phelan N., Egan G., “A novel method for contrast-to-noise ratio (CNR) evaluation of digital mammography detectors,” Eur. Radiol. 19(9), 2275–2285 (2009). 10.1007/s00330-009-1409-3 [DOI] [PubMed] [Google Scholar]
- 34.Liu Y., Liang Y., Mu G., Zhu X., “Deconvolution methods for image deblurring in optical coherence tomography,” J. Opt. Soc. Am. A 26(1), 72–77 (2009). 10.1364/JOSAA.26.000072 [DOI] [PubMed] [Google Scholar]
- 35.Liu Y., Liang Y., Tong Z., Zhu X., Mu G., “Contrast enhancement of optical coherence tomography images using least squares fitting and histogram matching,” Opt. Commun. 279(1), 23–26 (2007). 10.1016/j.optcom.2007.07.003 [DOI] [Google Scholar]
- 36.Yu K., Ji L., Wang L., Xue P., “How to optimize OCT image,” Opt. Express 9(1), 24–35 (2001). 10.1364/OE.9.000024 [DOI] [PubMed] [Google Scholar]
- 37.J. S. Lim, Two-Dimensional Signal and Image Processing, (1990, Prentice Hall, Englewood, NJ.) [Google Scholar]
- 38.R. C. Gonzalez, and R. E. Woods, Digital Image Processing, second ed.,( 2002, Prentice Hall, NJ.) [Google Scholar]
- 39.J. R. Hook, and H. E. Hall, Solid State Physics, 2nd Ed. (1991, John Wiley & Sons Ltd., New York, NY.) [Google Scholar]
- 40.Rogowska J., Brezinski M. E., “Image processing techniques for noise removal, enhancement and segmentation of cartilage OCT images,” Phys. Med. Biol. 47(4), 641–655 (2002). 10.1088/0031-9155/47/4/307 [DOI] [PubMed] [Google Scholar]
- 41.Ozcan A., Bilenca A., Desjardins A. E., Bouma B. E., Tearney G. J., “Speckle reduction in optical coherence tomography images using digital filtering,” J. Opt. Soc. Am. A 24(7), 1901–1910 (2007). 10.1364/JOSAA.24.001901 [DOI] [PMC free article] [PubMed] [Google Scholar]
- 42.Cicchi R., Sampson D., Massi D., Pavone F., “Contrast and depth enhancement in two-photon microscopy of human skin ex vivo by use of optical clearing agents,” Opt. Express 13(7), 2337–2344 (2005). 10.1364/OPEX.13.002337 [DOI] [PubMed] [Google Scholar]
- 43.Villaseñor-Mora C., Sanchez-Marin F. J., Garay-Sevilla M. E., “Contrast enhancement of mid and far infrared images of subcutaneous veins,” Infrared Phys. Technol. 51(3), 221–228 (2008). 10.1016/j.infrared.2007.07.006 [DOI] [Google Scholar]
- 44.Salinas H. M., Fernández D. C., “Comparison of PDE-based nonlinear diffusion approaches for image enhancement and denoising in optical coherence tomography,” IEEE Trans. Med. Imaging 26(6), 761–771 (2007). 10.1109/TMI.2006.887375 [DOI] [PubMed] [Google Scholar]
- 45.Paes S., Ryu S. Y., Na J., Choi E., Lee B. H., Hong I. K., “Advantages of adaptive speckle filtering prior to application of iterative deconvolution methods for optical coherent tomography imaging,” Opt. Quantum Electron. 37(13-15), 1225–1238 (2005). 10.1007/s11082-005-4194-5 [DOI] [Google Scholar]


