Abstract
Background
Vibrio cholerae is the causative organism of waterborne disease, cholera. V. cholerae has caused many epidemics and pandemics of cholera for many years. In this study, V. cholerae recovered from edible ice were investigated for their genetic diversity using Enterobacterial Repetitive Intergenic Consensus (ERIC) PCR and Repetitive Extragenic Palindromic (REP) PCR. Isolation was done using selective medium and the presumptive isolates were confirmed through biochemical and serological assays.
Results
Seventy-five isolates of V. cholerae were recovered from ice samples collected from different locations of Jakarta. Specifically, 19 of them were identified as O1 serotype, 16 were Ogawa, 3 isolates were Inaba and the remaining isolates were non-O1. The fingerprinting profiles of V.cholerae isolated from ice samples were very diverse.
Conclusion
This result showed that the ERIC sequence is more informative and discriminative than REP sequence for analysis of V. cholerae diversity.
Keywords: Vibrio cholerae, ERIC-PCR, REP-PCR, Edible ice
Background
Cholera is characterized by severe watery diarrhea caused by toxigenic Vibrio cholerae, which colonizes the small intestine and produces an enterotoxin, the cholera toxin (CT).
V. cholerae is classified on the basis of somatic antigens (O) into serovars or serogroups, and there are at least 200 known serogroup. Two serogroups, O1 and O139, have been associated with epidemic disease [1]. Serogroup O1 thought to include all the strains responsible for epidemic and endemic cholera; it has two major serotypes, Ogawa and Inaba. Each of those serotypes can be further divided into two biotypes, classical and El Tor, based on biochemical properties and susceptibility to bacteriophages. Serogroup O139 appears to be a hybrid of O1 strains and non-O1 strains. However, this organism does not produce O1 LPS and lacks at least some of the genetic material necessary for production of O1 antigen [2].
In Indonesia, a total of 17 episodes of epidemic diarrheal disease were investigated from 1993 to 1999 and were found to be caused by V. cholerae O1 [3]. According to WHO report [4], there was a sharp increase in the number of cholera cases. A total of 131943 cases, including 2272 deaths, reported from 52 countries. Overall, this represents a 30% increase compared with the number of cases reported in 2004.
In Indonesia edible are often used in street food and are consumed almost every day. Although it is so commonly consumed, it may not be prepared properly. We suspect that it may be a major important concern and we conducted a study on the genetic diversity of V.cholerae isolated from this possible source of contagion.
The initial analysis of Repetitive Extragenic Palindromic (REP) sequences in E. coli showed that this sequence was frequently present in complex clusters of several copies. These clusters are present and transcribed in about 25% of transcription units and may account for as much as 1% of the total genome. The REP element has been shown to be located between genes within an operon or at the end of an operon, and in operons distributed throughout the E. coli genome [5].
From the analysis of DNA sequence databases, Enterobacterial Repetitive Intergenic Consensus (ERIC) sequence is found to be approximately 126 bp in length. Like the REP sequence, the ERIC sequence repeat includes a conserved inverted repeat [6] and is located in non-coding transcribed regions of the chromosome, in either orientation with respect to transcription.
ERIC-PCR has been chosen for intraspecies profiling to several bacteria, for instance Bacillus anthracis and Bacillus cereus [7], Enterobacter sakazakii [8], Lactobacillus [9], Listeria monocytogenes [10], Salmonella enteritidis [11,12]. According to [7] ERIC-PCR typing can provide more discriminative DNA patterns of Bacillus anthracis and Bacillus cereus strains. Comparison of ITS profiling, REP- and ERIC-PCR of Salmonella enteritidis showed that ERIC-PCR can give high discriminatory index [12]. On the other hand, ERIC-PCR was able to show species specific band that pulsed field gel electropheresis could not show it [9]. Those comparisons has revealed that ERIC-PCR is a powerful techniques and informative for intraspecies profiling.
Thus, the objectives of this experiment were to obtain information on the genetic diversity of V. cholerae from edible ice samples used in street food using ERIC-PCR, and to compare the effectiveness of REP-PCR and ERIC for analysis genetic diversity of V. cholerae.
Results
We recovered 109 isolates of V. cholerae from 40 ice samples throughout Jakarta (Table 1). The serological assay classified 24 isolates as O1 serotype, and these are further differentiated into 20 Ogawa and 4 Inaba isolates. Of these 109 isolates, however, only 75 isolates were subjected to ERIC and REP-PCR.
Table 1.
Origin of samples and number of positive isolates
| Regional | Location of Sampling | Number of presumptive Isolate | Number of Positive Isolate |
|---|---|---|---|
| East Jakarta | A | 6 | - |
| B | 6 | - | |
| C | 6 | 1 | |
| D | 24 | 2 | |
| E | 12 | 3 | |
| F | 12 | - | |
| G | 23 | 1 | |
| H | 6 | - | |
| North Jakarta | I | 10 | 3 |
| J | 24 | - | |
| K | 10 | - | |
| L | 10 | - | |
| M | 9 | 4 | |
| N | 19 | 1 | |
| O | 24 | - | |
| P | 12 | - | |
| West Jakarta | Q | 34 | 13 |
| R | 33 | 1 | |
| S | 27 | 3 | |
| T | 27 | 1 | |
| U | 24 | 2 | |
| V | 24 | 10 | |
| W | 24 | 5 | |
| X | 24 | 8 | |
| South Jakarta | Y | 5 | - |
| Z | 6 | - | |
| AA | 10 | 5 | |
| AB | 24 | 22 | |
| AC | 24 | 2 | |
| AD | 24 | 2 | |
| AE | 24 | 3 | |
| AF | 24 | - | |
| Central Jakarta | AG | 10 | - |
| AH | 9 | - | |
| AI | 11 | 6 | |
| AJ | 12 | - | |
| AK | 24 | 8 | |
| AL | 12 | 3 | |
| AM | 12 | - | |
| AN | 4 | - | |
| Total isolates | 617 | 109 | |
It was collected once for each sample
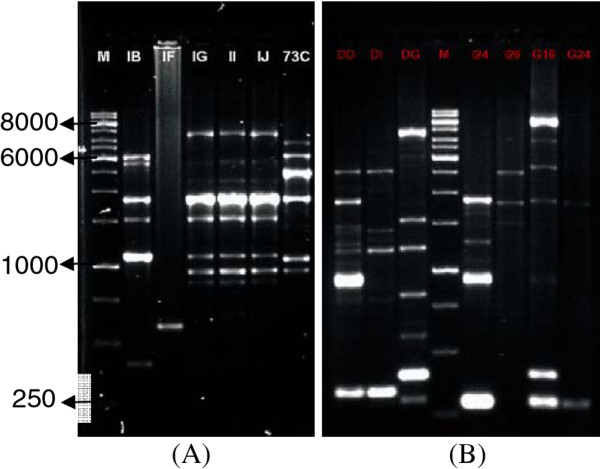
The ERIC and REP PCR result of V. cholerae strains showed that the V. cholerae isolates were genetically diverse. For example, 31 different fragments of DNA ranging from 250 to 8000 base pairs were amplified with ERIC PCR (Figure 1A) and 33 different fragments ranging from 250 to 6000 base pairs were amplified with REP PCR (Figure 1B). As in a previous study by [13] the results obtained with ERIC PCR was less complex than REP PCR.
Figure 1.
DNA fingerprints of several environmental isolates of V. cholerae generated by ERIC PCR (A) and REP PCR (B) amplification. M, marker 1 kb ladders (Fermentas).
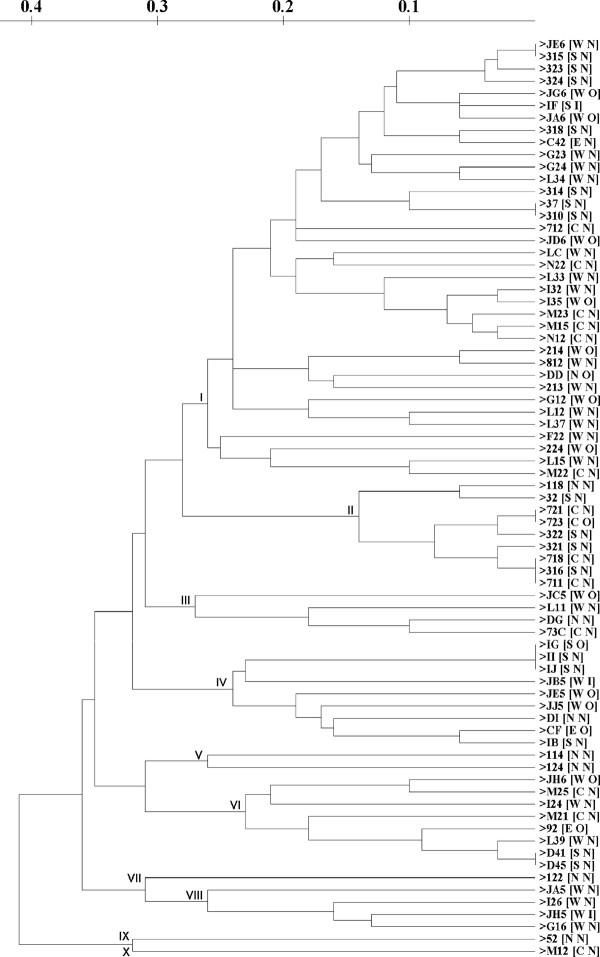
The ERIC dendrogram result (Figure 2) showed that there are 10 different clusters with 0.72 simple match similarity. This result was obtained from 67 different DNA fingerprinting profiles out of 75 isolates. It indicated that there were some identical fingerprint profiles as shown in the isolate JE6 and 315; isolate 37 and 310; isolate 721 and 723; isolate D41 and D45; isolate IG, II and IJ; and isolate 718, 711, and 316 (the origin of isolation and serotype information are shown in Table 2).
Figure 2.
Dendrogram of ERIC sequences using simple-match similarity matrix clustered by the unweighted pair-group method with arithmetic means. W: west Jakarta, S: south Jakarta; N: north Jakarta; C: centre Jakarta; E: East Jakarta for first code in the bracket; O: Ogawa O1; I: Inaba O1; N: non-O1 for second code in the bracket.
Table 2.
Origin of sample and serotype of isolate that used in this study
| Isolate | Regional | Location of Sampling | Serotype |
|---|---|---|---|
| CF | East Jakarta | C | Ogawa-O1 |
| C42 | D | Non-O1 | |
| 92 | G | Ogawa-O1 | |
| DD | North Jakarta | I | Ogawa-O1 |
| DG | Non-O1 | ||
| DI | Non-O1 | ||
| 114 | M | Non-O1 | |
| 118 | Non-O1 | ||
| 122 | Non-O1 | ||
| 124 | Non-O1 | ||
| 52 | N | Non-O1 | |
| F22 | West Jakarta | U | Non-O1 |
| G12 | W | Ogawa-O1 | |
| G16 | Non-O1 | ||
| G23 | Non-O1 | ||
| G24 | Non-O1 | ||
| I24 | X | Non-O1 | |
| I26 | Non-O1 | ||
| I32 | Non-O1 | ||
| I35 | Ogawa-O1 | ||
| L11 | V | Non-O1 | |
| L12 | Non-O1 | ||
| L15 | Non-O1 | ||
| L33 | Non-O1 | ||
| L34 | Non-O1 | ||
| L37 | Non-O1 | ||
| L39 | Non-O1 | ||
| JA5 | Q | Non-O1 | |
| JB5 | Inaba-O1 | ||
| JC5 | Ogawa-O1 | ||
| JE5 | Ogawa-O1 | ||
| JH5 | Inaba-O1 | ||
| JJ5 | Ogawa-O1 | ||
| JA6 | Ogawa-O1 | ||
| JD6 | Ogawa-O1 | ||
| JE6 | Non-O1 | ||
| JH6 | Ogawa-O1 | ||
| JG6 | Ogawa-O1 | ||
| LC | R | Non-O1 | |
| 213 | S | Non-O1 | |
| 214 | Ogawa-O1 | ||
| 224 | Ogawa-O1 | ||
| 812 | T | Non-O1 | |
| IB | South Jakarta | AA | Non-O1 |
| IF | Inaba-O1 | ||
| IG | Ogawa-O1 | ||
| II | Non-O1 | ||
| IJ | Non-O1 | ||
| D41 | AC | Non-O1 | |
| D45 | Non-O1 | ||
| 32 | AB | Non-O1 | |
| 37 | Non-O1 | ||
| 310 | Non-O1 | ||
| 314 | Non-O1 | ||
| 315 | Non-O1 | ||
| 316 | Non-O1 | ||
| 318 | Non-O1 | ||
| 321 | Non-O1 | ||
| 322 | Non-O1 | ||
| 323 | Non-O1 | ||
| 324 | Non-O1 | ||
| M12 | Central Jakarta | AK | Non-O1 |
| M15 | Non-O1 | ||
| M21 | Non-O1 | ||
| M22 | Non-O1 | ||
| M23 | Non-O1 | ||
| M25 | Non-O1 | ||
| N12 | AL | Non-O1 | |
| N22 | Non-O1 | ||
| 73C | AI | Non-O1 | |
| 711 | Non-O1 | ||
| 712 | Non-O1 | ||
| 718 | Non-O1 | ||
| 721 | Non-O1 | ||
| 723 | Ogawa-O1 | ||
There was no correlation between the origin of the isolates and the fingerprint profile. For example the fingerprint profile of isolate JE6, which was isolated from West Jakarta, is identical with that of isolate 315, which was isolated from South Jakarta (the distance between these two locations was approximate 10 km) and clustered in cluster I. However, isolate 118 and 122, which were isolated from the same place (M, North Jakarta) have very different fingerprint profiles and were in different clusters (118 in cluster II and 122 in cluster VII). Cluster I was very diverse, having isolates collected from all part of Jakarta. There was also no correlation between fingerprint profile and V. cholerae serotype. For instance, isolate 723 (Ogawa-O1 serotype) and isolate 721 (non-O1 serotype) had an identical fingerprint profiles and were in cluster II. However isolate JB5 and JH5 which have same serotype (Inaba-O1), have very different fingerprint profiles and clustered differently (JB5 in cluster IV and JH5 in cluster VIII).
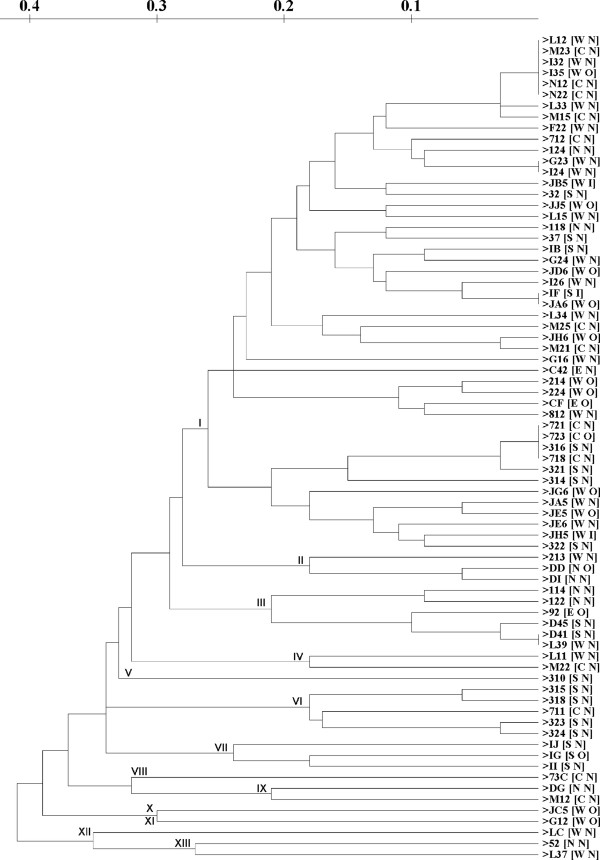
Like the ERIC dendrogram, the REP dendrogram (Figure 3) also showed no correlation between the origin of isolation, V. cholerae serotype and fingerprint profile. But there were also some differences between them. The REP dendrogram formed more clusters, 13 with one major cluster (cluster I), compared to the ERIC dendrogram. But although there was an increase in cluster number, there was also a decrease in number of fingerprint profiles. This dendrogram only contained 64 different DNA fingerprint profiles. It indicated that, for REP, there were more isolates with identical fingerprint profiles, such as isolates L12, M23, I32, I35, N12, and N22; isolates G23 and I24; isolates IF and JA6; isolates 721, 723, 316, and 718; and isolates D41 and L39. It indicated that REP PCR cannot distinguish some isolate which can be differentiated with ERIC PCR.
Figure 3.
Dendrogram of REP sequences using simple-match similarity matrix clustered by the unweighted pair-group method with arithmetic means. W: west Jakarta, S: south Jakarta; N: north Jakarta; C: centre Jakarta; E: East Jakarta for first code in the bracket; O: Ogawa O1; I: Inaba O1; N: non-O1 for second code in the bracket.
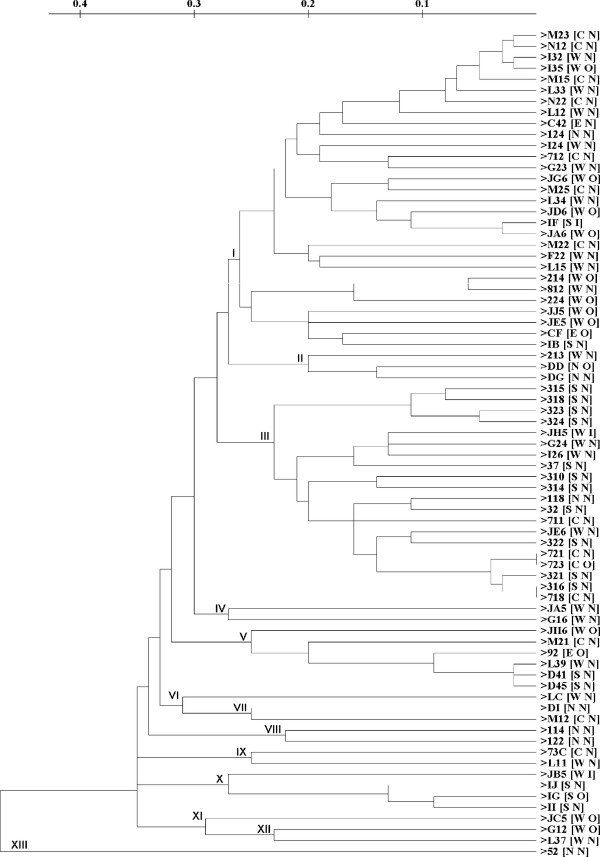
In this study, we also generated a dendrogram combining the ERIC and REP dendrograms (Figure 4). This dendrogram showed no correlation between origin of isolation, V. cholerae serotype and fingerprint profile. But there was an increase in the fingerprint profiles compared to either the ERIC or REP dendrogram (73 profiles). Only isolates 721 and 723; and isolates 316 and 718 have an identical profile. From this dendrogram we obtained 13 different clusters with two major clusters, cluster I and cluster III.
Figure 4.
Dendrogram of combined (ERIC and REP sequences) using simple-match 1 similarity matrix 2 clustered by the unweighted pair-group method with arithmetic means. W: west Jakarta, S: 3 south Jakarta; N: north Jakarta; C: centre Jakarta; E: East Jakarta for first code in the 4 bracket; O: Ogawa O1; I: Inaba O1; N: non-O1 for second code in the bracket.
Discussion
The results indicate that the hygiene level of edible ice in Jakarta is poor because it contains a large number of bacteria, including 109 isolates of V. cholerae. However, not all of ice samples were unhygienic because some samples only contained a few bacteria and no V. cholerae (Table 1). However, all samples were not unhygienic because some samples are devoid of V. cholerae.
Identical DNA profile can occur in different serotypes. One of the possible explanations for this is that the amplification site of ERIC-PCR and REP PCR are in non-coding sequences [13], while the somatic antigen upon which serotypes are based is encoded by the rfb operon [14]. Thus, it is suggested that the bacteria have similar non-coding sequences in that region or there were no ERIC or REP consensus sequences in that region, further research is needed.
Identical fingerprint profiles may also occur in samples of different origin, because the ice cubes in Jakarta may come from the same ice cube factory. Another possibility is that the water, which is used for making this ice, is collected from the same river. This result was similar to a previous study of V. cholerae [15] in that there was no correlation between genetic similarity and the geographical source of isolation.
The small chromosome of V. cholerae was quite conserved and stable outside of the superintegron region. In contrast to the general stability of the genome, the superintegron demonstrates pronounced divergence among toxigenic and nontoxigenic strains [16]. Thus we hypothesize that the clustering is based on another factors such as toxin production, antibiotic resistance or pathogenesis factor. Future research is needed to prove this hypothesis.
From this research we discovered that with REP sequences, the fingerprint patterns are more complex but the clustering result showed that the ERIC sequences are better, because the REP result shown only one big cluster and a small number of other cluster. The ERIC sequence is better than the REP sequence for analysis of V. cholerae samples, because it is less complex but more discriminative. This result is consistent with the comparison done by [12] in Salmonella enteritidis. A combination of ERIC and REP sequences can increase the level of discrimination for V.cholerae. This indicates that although there is an increase in discriminating ability, a combined dendrogram cannot provide better clustering than the ERIC dendrogram. In summary, many ice cube samples in Jakarta still contain V. cholerae. The fingerprinting profiles of V.cholerae isolated from ice cube in Jakarta were very diverse. There is also no correlation between the origin of samples the, bacterial serotype and the finger print profile. For an epidemiological study of V cholerae, the ERIC sequence is more discriminative than REP sequence.
Materials and methods
Samples collection
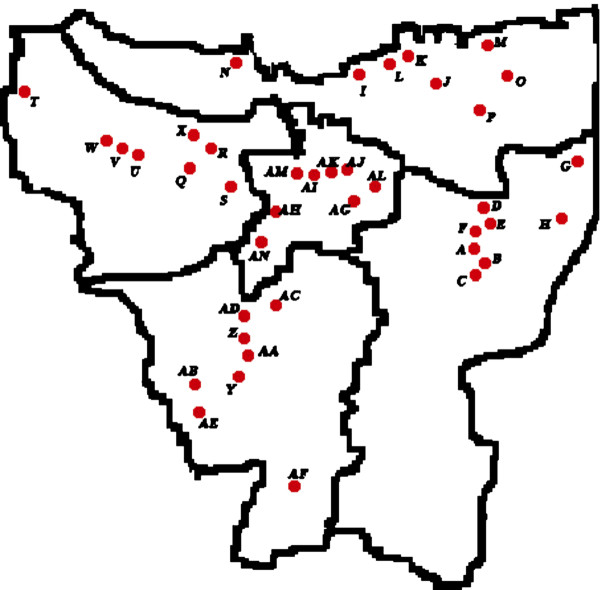
Ice samples were collected from ice suppliers around Jakarta (North, East, West, South, and Centre Jakarta) from October 2007 to May 2008. They were collected from eight ice suppliers from each part of Jakarta (Figure 5). The samples were put into cooler box and transported to the laboratory immediately.
Figure 5.
Map of Jakarta showing the region which ice samples were collected. For further information see also Appendices 1. (Scale 1:330000).
Isolation of V. Cholerae
Approximately 25 ml of melted ice was inoculated into 25 ml of Alkaline Peptone Water (APW) (Oxoid, England) and incubated at 37°C, 120 rpm, overnight. Then, 1 ml of inoculated APW was centrifuged at 1500 g for 3 minutes and the supernatant was removed; this step was repeated two times. The pellet was resuspended in 500 μl of 0.85% NaCl and subsequently diluted to 1:1000. Each of dilutions was spread onto Thiosulfate Citrate Bile-Salt Sucrose (TCBS) Agar (Oxoid, England).
Biochemical and serological assays
About 5-8 suspected colonies were picked for further biochemical tests such as oxidase, Klinger Iron Agar (KIA) (Difco, USA) assay, Indole, and Lysine decarboxylase (Difco, USA) tests. The selected colonies were incubated at 37°C for 18-24 hours. To conduct the biochemical test, suspected colonies were grown on non-selective medium Brain Heart Infusion Agar (BHIA) (Oxoid, England). Serological assays were done by using V. cholerae polyvalent O antisera and monovalent Ogawa and Inaba antisera (Biofarma, Bandung Indonesia).
Genetic diversity by using ERIC and REP-PCR based methods
The genomic DNA was extracted by standard methods [17]. PCR cocktails for 25 ml reaction mixtures contained 12.5 μl Go Taq (Promega, USA); 1 μl of 10 ρmol ERIC1R and ERIC2 [16]; or 1 μl of 10 ρmol REP 1R and REP 2I [18] (Table 3); 1 μl of DNA template; and 9.5 μl of double distilled H2O. The ERIC-PCR condition for this method followed [19] with some modification. For REP-PCR, the PCR followed the conditions [20]. The PCR result was visualized by running in a 1.8% agarose gel at 60 V for 2.5 hours.
Table 3.
List of primers used in this study
Competing interests
The authors declare that they have no competing interests.
Authors' contributions
All authors read and approved the final manuscript.
Contributor Information
Diana E Waturangi, Email: diana.waturangi@atmajaya.ac.id.
Ignasius Joanito, Email: ignasiusjoanito@hotmail.com.
Yogiara Yogi, Email: yogiara@atmajaya.ac.id.
Sabu Thomas, Email: sabu@rgcb.res.in.
References
- Kaper JB, Morris JG Jr, Levine MM. Cholera. Clin Microbiol Rev. 1995;8(1):48–86. doi: 10.1128/cmr.8.1.48. [DOI] [PMC free article] [PubMed] [Google Scholar]
- Faruque SM, Albert MJ, Mekalanos JJ. Epidemiology, Genetics, and Ecology of Toxigenic Vibrio cholerae. Microbiol Mol Biol Rev. 1998;62(4):1301–1314. doi: 10.1128/mmbr.62.4.1301-1314.1998. [DOI] [PMC free article] [PubMed] [Google Scholar]
- Simanjuntak CH, Larasati W, Arjoso S, Putri M, Lesmana M, Oyofo BA, Sukri N, Nurdin D, Kusumaningrum RP, Punjabi NH, Subekti D, Djelantik S, Sukarma S, Muzahar A, Lubis H, Siregar B, Mas'ud M, Abdi A, Sumardiati S, Wibisana Hendarwanto B, Setiawan W, Santoso E, Putra S, Sarumpaet H, Ma'ani C, Lebron S, Soeparmanto A, Campbell JR, Corwin AL. Cholera in Indonesia in 1993-1999. AmJTrop Med Hyg. 2001;65(6):788–797. doi: 10.4269/ajtmh.2001.65.788. [DOI] [PubMed] [Google Scholar]
- [WHO] World Health Organization. Cholera surveillance. Weekly Epidemiol Rec. 2006;81:297–308. [Google Scholar]
- Sharples GJ, Lloyd RG. A novel repeated DNA sequence located in the intergenic regions of bacterial chromosomes. Nucleic Acids Res. 1990;18(22):6503–6508. doi: 10.1093/nar/18.22.6503. [DOI] [PMC free article] [PubMed] [Google Scholar]
- Lupski JR, Weinstock GM. Short Interspersed Repetitive DNA Sequences in Prokaryotic Genomes. J Bacteriol. 1992;174(14):4525–4529. doi: 10.1128/jb.174.14.4525-4529.1992. [DOI] [PMC free article] [PubMed] [Google Scholar]
- Shangkuan Y-H, Yang J-F, Lin H-C, Shaio M-F. Comparison of PCR-RFLP, ribotyping and ERIC-PCR for typing Bacillus anthraci and Bacillus cereu strains. J Appl Microbiol. 2000;89:452–462. doi: 10.1046/j.1365-2672.2000.01134.x. [DOI] [PubMed] [Google Scholar]
- Ye Y, Wu Q, Yao L, Dong X, Wu K, Jumei Z. Analysis of a concencus fragment in ERIC-PCR fingerprinting of Enterobacter sakazaki. Int J Food Microbiol. 2009;132:172–175. doi: 10.1016/j.ijfoodmicro.2009.03.018. [DOI] [PubMed] [Google Scholar]
- Stephenson DP, Moore RJ, Allison GE. Comparison and utilization of repetitive-element PCR techniques for typing Lactobacillu isolates from the chicken gastrointestinal tract. Appl Environ Microbiol. 2009;75(21):6764–6776. doi: 10.1128/AEM.01150-09. [DOI] [PMC free article] [PubMed] [Google Scholar]
- Ruiz-Bolivar Z, Carrascal-Camacho AK, Neuque-Rico MC, Gutierrez-Trivino C, Rodriguez-Bocanegra MX, Poutou-Pinales RA, Mattar S. Enterobacterial repetitive intergenic consensus-polymerase chain reaction (ERIC-PCR) fingerprinting reveals intra-serotype variations among circulating Listeria monocytogene strains. Afr J Microbiol Res. 2011;5(13):1586–1598. [Google Scholar]
- Cao S-Y, Wang M-S, Cheng A-C, Qi X-F, Yang X-Y, Deng S-X, Yin N-Y, Zhang Z-H, Zhou D-C, Zhu D-K, Luo Q-H, Chen X-Y. Comparative analysis of intestinal microbial community diversity between healthy and orally infected ducklings with Salmonella enteritidi by ERIC-PCR. World J Gastroenterol. 2008;14(7):1120–1125. doi: 10.3748/wjg.14.1120. [DOI] [PMC free article] [PubMed] [Google Scholar]
- Chmielewski R, Wielickzo A, Kuczkowski M, Mazurkiewicz M, Ugorski M. Comparison of ITS profiling, REP- and ERIC-PCR of Salmonella enteriridi isolates from Poland. J Vet Med. 2002;B 49:163–168. doi: 10.1046/j.1439-0450.2002.00544.x. [DOI] [PubMed] [Google Scholar]
- Versalovic JT, Koeuth T, Lupski JR. Distribution of repetitive DNA sequences in eubacteria and application to fingerprinting of bacterial genomes. Nucleic Acids Res. 1991;19(24):6823–6831. doi: 10.1093/nar/19.24.6823. [DOI] [PMC free article] [PubMed] [Google Scholar]
- Fallarino A, Mavrangelos C, Stroeher UH, Manning PA. Identification of Additional Genes Required for O-Antigen Biosynthesis in Vibrio cholera O1. J Bacteriol. 1997;179(7):2147–2153. doi: 10.1128/jb.179.7.2147-2153.1997. [DOI] [PMC free article] [PubMed] [Google Scholar]
- Jiang SC, Louis V, Choopun N, Sharma A, Huq A, Colwell RR. Genetic Diversity of Vibrio cholera in Chesapeake Bay Determined by Amplified Fragment Length Polymorphism Fingerprinting. Appl Envirol Microbiol. 1999;66(1):140–147. doi: 10.1128/aem.66.1.140-147.2000. [DOI] [PMC free article] [PubMed] [Google Scholar]
- Pang B, Yan M, Cui Z, Xiaofen Y, Diao B, Ren Y, Gao S, Zhang L, Biao K. Genetic Diversity of Toxigenic and Non-toxigenic Vibrio cholera Serogroups O1 and O139 Revealed by Array-Based Comparative Genomic Hybridization. J Bacteriol. 2007;189(13):4837–4849. doi: 10.1128/JB.01959-06. [DOI] [PMC free article] [PubMed] [Google Scholar]
- Murray MG, Thompson WF. Rapid isolation of high-molecular weight plant DNA. Nucleic Acids Res. 1980;8(19):4321–4325. doi: 10.1093/nar/8.19.4321. [DOI] [PMC free article] [PubMed] [Google Scholar]
- Dombek PE, Johnson LAK, Zimmerley ST, Sadowsky MJ. Use of Repetitive DNA Sequences and the PCR to Differentiate Escherichia col Isolates from Human and Animal Sources. Appl Environ Microbiol. 2000;66(6):2572–2577. doi: 10.1128/AEM.66.6.2572-2577.2000. [DOI] [PMC free article] [PubMed] [Google Scholar]
- Rivera G, Chowdhury MAR, Huq A, Jacobs D, Martins MT, Colwell RR. Enterobacterial Repetitive Intergenic Consensus Sequences and the PCR To Generate Fingerprints of Genomic DNAs from Vibrio cholera O1, O139, and Non-O1 Strains. Appl Environ Microbiol. 1995;61(8):2898–2904. doi: 10.1128/aem.61.8.2898-2904.1995. [DOI] [PMC free article] [PubMed] [Google Scholar]
- Rademaker JLW, de Bruijn FJ. In: DNA markers: protocols, applications, and overviews. Caetano-Anolle's G, Gresshoff PM, editor. New York: Wiley; 1997. Characterization and classification of microbes by rep-PCR genomic fingerprinting and computer assisted pattern analysis; pp. 151–171. [Google Scholar]


