

Abstract
Although microvascular cell death is a well established hallmark of diabetic retinopathy, which is a major cause of vision loss, much remains to be learned about the functional changes that precede the onset of morphological damage to retinal blood vessels. Early alterations of function are of interest since they may contribute to the development of irreversible pathological events. Because one of the earliest retinal effects of diabetes is the dysregulation of blood flow, we asked whether diabetes alters the functional organization of the capillary/arteriolar complex, which is the operational unit that plays an important role in regulating local perfusion. In this study, the effect of diabetes on the electrotonic architecture of the retinal microvasculature was characterized. To do this, we quantified the efficacy by which voltages are transmitted between pairs perforated-patch pipettes sealed onto abluminal cells located at well defined locations in capillary/arteriolar complexes freshly isolated from the retinas of rats made diabetic by streptozotocin. Results of these dual recording experiments were compared with data from similar experiments performed on non-diabetic retinal microvessels. These experiments revealed that diabetes caused a ~5-fold increase in the rate at which a voltage decays as it axially spreads through the retinal microvasculature. In contrast, the efficacy of radial abluminal cell/endothelial cell transmission was not significantly affected by diabetes. Based on the results of this study, which is the first to characterize how diabetes affects voltage transmission in capillary/arteriolar complexes of any tissue, we concluded that by selectively inhibiting axial transmission, diabetes alters the electrotonic architecture of the retinal microvasculature. This diabetes-induced alteration in the functional organization of the capillary/arteriolar unit is likely to impair its ability to efficiently and effectively regulate blood flow and thereby, may contribute to the progression of sight-threatening complications of diabetic retinopathy.
Keywords: Retina, Capillaries, Arterioles, Diabetes, Diabetic retinopathy, Electrotonic transmission
1. Introduction
Diabetes-induced damage to the retina is a major cause of vision loss. At present, it is unclear why the vasculature of the retina is particularly vulnerable to this disorder of glucose metabolism. Recently, we have postulated (Puro, 2007) that this vulnerability is a consequence of specialized adaptations needed to meet the unique task of supplying substrates to a tissue whose translucency is essential for function. A key adaptation for minimizing vascular interference with the passage of light is the low density of capillaries in the retina (Funk, 1997). However, although the low capillary density enhances retinal function, it also limits the functional reserve of the retina’s circulatory system so that there is little room for error in matching blood flow to meet the stringent metabolic requirements of retinal neurons.
As an apparent adaptation to the paucity of capillaries and the limited functional reserve, retinal blood flow is largely autonomous of extrinsic influences and is particularly well designed for highly decentralized regulation. For example, a lack of autonomic innervation (Ye et al., 1990), which is unique to the retinal vasculature, frees blood vessels from CNS control. Furthermore, the tight blood-retinal barrier provides autonomy from circulating vasoactive molecules. In addition, the capillary/arteriolar complex of the retina is a highly integrated operational unit that is functionally organized for the decentralized control of local perfusion (Wu et al., 2006; Zhang et al., 2011). Thus, as a consequence of these physiological adaptations, blood flow within the retina is regulated almost exclusively by local metabolic conditions. However, soon after the onset of diabetes, the ability of the retina to autoregulate its blood flow becomes compromised (Ciulla et al., 2002). Due to the importance of autoregulation in meeting the challenge of matching local perfusion to meet local metabolic demand, even modest dysfunction of this regulatory mechanism may contribute to the development of cell damage in the diabetic retina (Kohner et al., 1995).
In the quest to identify potentially reversible and thereby, treatable effects of diabetes, we have focused on the pathophysiological responses that occur early in the course of diabetes, prior to the onset of vascular and neuronal cell death. With the loss of autoregulation being an early manifestation of diabetes and the capillary/arteriole complex being critically important in the regulation of local retinal perfusion, we have explored how diabetes affects the functional components of this operational unit. Our earlier studies revealed that the function of microvascular ion channels, such as voltage-dependent calcium channels, ATP-sensitive K+ channels and inwardly rectifying K+ channels, is significantly altered early in the course of diabetes (Matsushita & Puro, 2006; Ishizaki et al., 2009; Matsushita et al., 2010).
In the present study, we directed our attention to ascertaining whether the movement of voltages within the capillary/arteriolar complex of the retinal vasculature is altered early in the course of diabetic retinopathy. The spread of voltage within this operational unit is of interest because a coordinated vasomotor response requires the integration of locally generated membrane potential changes. Indicative of this, earlier studies demonstrated that the electrotonic architecture of the capillary/arteriolar complex is well suited for the widespread distribution of voltage signals (Kawamura et al., 2003; Peppiatt et al., 2006; Wu et al., 2006; Zhang et al., 2011). As a result, this operational unit is capable of a high degree of intercellular communication and signal integration. We postulated that an alteration in the electrotonic architecture of the capillary/arteriolar complex may be associated with the dysfunction of blood flow regulation that occurs early in the course of diabetes.
To characterize the electrotonic architecture of the retinal microvasculature, we quantified the efficacy by which a voltage is transmitted between a pair of recording pipettes located at well-defined sites within capillary/arteriole complexes freshly isolated from the rat retina. Comparison of data from dual recording experiments performed on diabetic and non-diabetic retinal microvessels allowed us to identify diabetes-induced changes in the electrotonic architecture. In this study, which is the first to characterize how diabetes affects voltage transmission in a capillary/arteriolar complex of any tissue, we found that the efficacy by which voltages are transmitted axially through the retinal microvasculature is diminished well before the onset of diabetes-induced vascular cell death.
2. Materials and methods
2.1 Animals and chemicals
Animal use conformed to the guidelines of the Association for Research in Vision and Ophthalmology and was approved by the University of Michigan Committee on the Use and Care of Animals. This study used male Long-Evans rats (Charles River, Cambridge, MA, USA), which were maintained on a 12 h alternating light/dark cycle and received food and water ad libitum. Unless otherwise noted, chemicals were obtained from Sigma (St. Louis, MO, USA).
2.2 Model of diabetes
Diabetes was induced by one or two intraperitoneal injections of streptozotocin (150 mg kg−1 diluted in 0.8 ml citrate buffer) into 5-week old rats that had fasted for 5 h. This study used rats that had been hyperglycemic for 9.2 ± 3.6 weeks (n = 20), which is early in the course of diabetes before the onset of a marked amount of microvascular cell death (Mitzutani et al., 1996). Immediately prior to harvesting microvessels from diabetic rats, the blood glucose level was 404 ± 134 mg dl−1. At the time of sacrifice, the age of the diabetic rats was not significantly different than that of the non-diabetic rats used to generate the data in Figure 2.
Figure 2.

Plots of ΔVresponder/ΔVstimulator ratios versus the distance between a pair of recording sites. Data are from diabetic (●) and non-diabetic (∀) microvessels. For each data set, the first-order exponential fit is shown. A, ratios for recordings from pairs of pericytes located on capillaries. 27 of the 29 data points in the non-diabetic group are from our recent study (Zhang et al., 2011). B, ratios for dual recordings from pairs of abluminal cells located on tertiary arterioles. In the non-diabetic group, 20 of the 54 data points are from the Zhang et al. study. C, ratios for dual recordings from pairs of smooth muscle cells that encircled secondary arterioles. 10 of the 15 data points in the non-diabetic group are from the study of Zhang et al.
2.3 Microvessel isolation
Using a previously described tissue print procedure(Ishizaki et al., 2009), microvascular complexes were isolated from the retinas of rats, which were killed with a rising concentration of carbon dioxide. In brief, the procedure included the rapid removal of retinas, excision of adherent vitreous and incubation for ~24 min at 30°C in Earle’s balanced salt solution supplemented with 0.5 mM EDTA, 6 U papain (Worthington Biochemicals, Freehold, NJ) and 2 mM cysteine. After placement in solution A, which consisted of 140mM NaCl, 3mM KCl, 1.8mM CaCl2, 0.8mM MgCl2, 10mM Na-Hepes, 15mM mannitol, and 5mM glucose at pH 7.4 with osmolarity adjusted to 310 mosmol·l−1, each retina was quadrasected, positioned vitreal surface up in a glass-bottom chamber, and then very gently compressed by a glass coverslip (Warner Instrument Corp., Hamden, CT) onto which microvascular complexes adhered firmly. As shown in Figure 1 and also in our published photomicrographs (Matsushita & Puro, 2006; Ishizaki et al., 2009; Zhang et al., 2011), isolated microvascular complexes included, from proximal to distal, a secondary arteriole encircled by “doughnut-shaped” myocytes, a tertiary arteriole with “dome-shaped” abluminal cell somas, and a capillary network whose abluminal cells, i.e., the pericytes, appear as “bumps on a log”(Kuwabara & Cogan, 1960).
Figure 1.
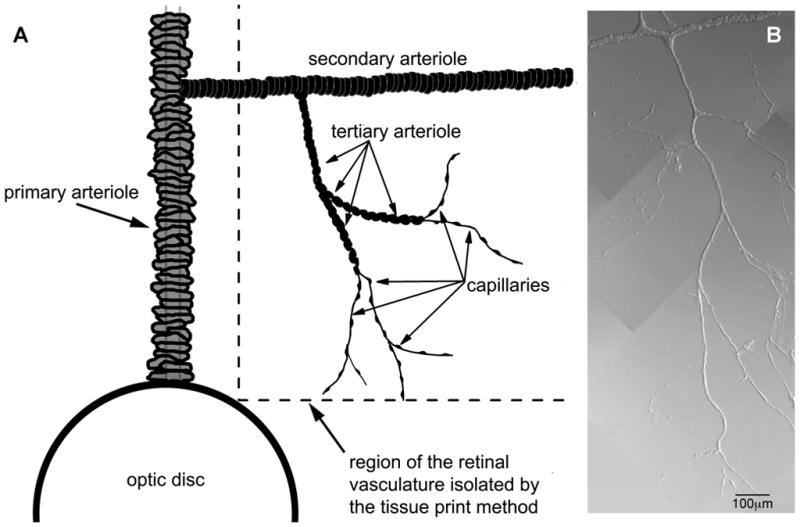
Capillaries and arterioles of the rat retina. A, Schematic showing the portion of the rat retinal vasculature isolated by the tissue print procedure used in this study. Modified from Zhang et al. (Zhang et al., 2011), with permission of the Journal of Physiology. B, Photomicrograph of microvascular complex freshly isolated from the retina of an adult rat; modified from Matsushita and Puro (Matsushita & Puro, 2006), with permission of the Journal of Physiology.
2.4 Electrophysiology
Experiments were performed at room temperature within 5 h after microvessel isolation. As detailed previously (Zhang et al., 2011), dual perforated-patch recordings were made from microvessels located on a coverslip positioned in a recording chamber whose perfusate was solution A. Each recording pipette, which had a resistance of 5 to 10 MΩ and contained a solution consisting of 50 mM KCl, 65 mM K2SO4, 6 mM MgCl2, 10 mM K-Hepes, 60 μg·ml−1 amphotericin B and 60 μg·ml−1 nystatin at pH 7.35 and osmolarity at 280mosmol·l−1, was mounted in the holder of a patch-clamp amplifier (Axopatch 200B, MDS Analytical Technologies, Union City, CA, USA or Dagan 3900, Dagan Corp., Minneapolis, MN, USA). A piezoelectric-based micromanipulator (Exfo, Thorlabs, Newton, NJ, USA) facilitated the positioning of the tip of a recording pipette onto to an abluminal cell. Seal resistances were ≥10 GΩ seal; access resistances were less than 35 MΩ. Currents and voltages were filtered with a four-pole Bessel filter, sampled digitally using a DigiData 1440A acquisition system (MDS Analytical Technologies) and stored by a computer equipped with pClamp (version 10, MDS Analytical Technologies), which along with other software (Origin, Version 7 or 8, OriginLab, Northampton, MA, USA), aided with data analysis and graphics display.
To measure the efficacy of electrotonic transmission within the retinal microvasculature, voltages were monitored via perforated-patch pipettes located at two sites on a microvessel while a 750 ms current step was injected at 3 sec intervals via one of the pipettes. The ratio of the voltage change detected at the non-stimulated site (ΔVresponder) to the voltage step induced at the site of current-injection (ΔVstimulator) was calculated. The inter-pipette distance was determined from a photomicrograph of the sampled microvascular complex. Of note, conduction through the bathing solution, rather than through the microvessel, did not contribute to the observed ΔVresponder since pipette-to-pipette transmission was not detected after one of the two recording seals was spontaneously lost or when one of the pipettes was positioned close to, but not sealed onto, the microvessel. In addition, there was no significant difference in the ΔVresponder/ΔVstimulator ratios generated by depolarization or hyperpolarization. In recent publications, we have illustrated our dual recording technique for assessing electrotonic transmission in the retinal microvasculature (Kawamura et al., 2003; Wu et al., 2006; Zhang et al., 2011).
Calculations of the efficacies of axial and radial transmission from the data generated by dual recordings were made based on the conclusions of a detailed assessment of various models of the electrotonic architecture of the retinal microvasculature (Zhang et al., 2011). From that assessment, it was ascertained that a semi-log plot of ΔVresponder/ΔVstimulator ratio versus inter-pipette distance (as in Fig. 2) yields important information. Namely, because the decay of an axially spreading voltage is a first-order process, the slope of the linear regression fit of the plotted data shows the rate at which voltage decays as it is transmitted axially. As was done in a our analysis of the electrotonic architecture of the normal retinal microvasculature (Zhang et al., 2011), the linear regression fit of the semi-log plotted ΔVresponder/ΔVstimulator ratio versus inter-pipette distance data (shown in Figure 2) was calculated by commercially available software (Origin, versions 7 and 8), which provides the slope (with standard error) of the fit, as well as the y-intercept value (with its standard error).
Additional important information is derived from the y-intercept value of the linear regression fit. As explored in substantial detail previously (Zhang et al., 2011), a y-intercept value, i.e., the extrapolated ΔVresponder/ΔVstimulator ratio at 0 μm, of less than 1.0 reflects the dissipation of voltage during abluminal cell/endothelium transmission at the current-injection site and also at the distantly recorded site. Thus, the efficacy of radial transmission was calculated by determining the square root of the y-intercept value.
2.5 Statistics
Data are given as means ± S.D. Probability was evaluated by the two-tailed Student’s t-test. P ≥ 0.05 indicated lack of a significant difference.
3. Results
To determine how diabetes affects the electrotonic architecture of the retinal microvasculature, we quantified the spread of voltage between perforated-patch pipettes sealed onto pairs of abluminal cells in capillaries, tertiary arterioles and secondary arterioles of retinal microvascular complexes freshly isolated from rats made diabetic by streptozotocin. In these experiments, the change in voltage at each recording site was measured as a voltage-changing current was injected into one of the pipettes. Calculation of the ratio of the voltage change detected at the non-stimulated site, i.e., ΔVresponder, to the voltage change in the current-injected cell, i.e., ΔVstimulator, yielded a measure of the efficacy of electrotonic transmission between a pair of recording pipettes. In order to determine the rate by which a voltage decreases as it spreads through the retinal microvasculature, ΔVresponder/ΔVstimulator ratios were determined over a range of inter-pipette distances.
The results of our dual recordings from diabetic microvessels are shown in Figure 2. To aid in determining the effect of diabetes, data from similar experiments recently performed on non-diabetic retinal microvessels (Zhang et al., 2011) are also included in this figure. In the diabetic microvessels, the first-order exponential fit for the decay of an axially spreading voltage yielded rates of 10.6 ± 7%/100 μm (n = 13) in the capillaries (Fig. 2A), 11.9 ± 15%/100 μm (n = 24) in the tertiary arterioles (Fig. 2B) and 8.5 ± 8%/100 μm (n = 17) in the secondary arterioles (Fig. 2C). These decay rates were not significantly different from each other. On the other hand, for each portion of the microvasculature, the rate of voltage decay in the diabetic microvessels was significantly (P ≤ 0.038) greater than the ~2% decay rate observed in non-diabetic microvessels (Fig. 2). Thus, our dual recording experiments revealed that diabetes decreased the efficacy of electrotonic transmission through capillaries and arterioles (Table 1).
Table 1.
Efficacies of electrotonic transmission within the microvasculature of the non-diabetic and diabetic retina. Values were derived from the data shown in Figure 2. The n-values are the number of pairs of perforated-patch recordings. See text for details concerning how these efficacies were calculated.
| Microvascular location | Efficacy of transmission in non-diabetic vessels | Efficacy of transmission in diabetic vessels | P-value |
|---|---|---|---|
| Capillary | |||
| Radial transmission | 0.76 ± 0.16 (n = 29) | 0.81 ± 0.18 (n = 13) | 0.4 |
| Axial transmission | 0.98 ± 0.16/100μm (n = 29) | 0.89 ± 0.07/100μm (n = 13) | 0.023 |
| Tertiary arteriole | |||
| Radial transmission | 0.51 ± 0.22 (n = 54) | 0.54 ± 0.24 (n = 23) | 0.6 |
| Axial transmission | 0.97 ± 0.22/100μm (n = 54) | 0.88 ± 0.14/100μm (n = 23) | 0.038 |
| Secondary arteriole | |||
| Radial transmission | 0.44 ± 0.12 (n = 15) | 0.44 ± 0.21 (n = 17) | 1.0 |
| Axial transmission | 0.98 ± 0.08/100μm (n = 15) | 0.92 ± 0.08/100μm (n = 17) | 0.008 |
In addition to showing that diabetes altered the slope of the first-order exponential fit of the ΔVresponder/ΔVstimulator ratio versus inter-pipette distance, Figure 2 also revealed that for each portion of the retinal microvasculature, the ΔVresponder/ΔVstimulator ratio at the extrapolated inter-pipette distance of 0 μm was not significantly affected by diabetes. As observed previously in non-diabetic microvessels (Zhang et al., 2011), the first-order exponential fit of the ΔVresponder/ΔVstimulator ratio versus inter-pipette distance data was found to not extrapolate to 1.0 at 0 μm; as would be expected if voltage decayed uniformly as during passage from the current-injected abluminal cell to the distant recording site. Rather a detailed assessment of why the ΔVresponder/ΔVstimulator ratios at 0 μm is less than 1.0 (Zhang et al., 2011) supported a model in which radial transmission of voltage from a current-injected abluminal cell to the underlying endothelium, as well as from the underlying endothelium to the distantly monitored abluminal cell, is relatively inefficiently. While in contrast, the spread of voltage through the endothelium is highly efficient. Based on our experimentally tested model (Zhang et al., 2011), the extrapolated value of ΔVresponder/ΔVstimulator ratio at 0 μm is the product of the efficacy of radial transmission at the current-injected site and the distant recording site; thus, the efficacy of radial transmission is the square root of the 0-μm value. As shown in Table 1, the calculated efficacies of radial transmission in the capillaries and arterioles were not significantly affected by diabetes. On the other hand, the efficacy of axial transmission in each region was significantly less in the diabetic microvessels.
The calculated impact of the diabetes-induced decrease in axial transmission on the amount of a capillary-generated voltage reaching proximal sites is illustrated in Figure 3. Due to the effect of diabetes on axial transmission, the amplitude of a voltage generated in the capillary tree is 60% smaller when transmission is through a diabetic, as compared with a non-diabetic, microvascular complex (Fig. 3B).
Figure 3.

Effect of diabetes on voltage decay within the microvasculature. A, Voltage changes predicted to occur in abluminal cells during the spread of a relative voltage of 1.45 that was generated in the endothelium of a capillary at a site 400 μm distal to the capillary/tertiary arteriole junction. Relative voltages in abluminal cells were calculated at 100 μm intervals were calculated based on the Zhang and colleagues’ model of the retinal microvasculature’s electrotonic architecture (Zhang et al., 2011). B, Plot using the results presented in panel A to show how much smaller a capillary-generated voltage is as it spreads through a diabetic, as compared with a non-diabetic, retinal microvascular complex.
4. Discussion
The results of this study of retinal microvascular complexes freshly isolated from the rat retina show that the electrotonic architecture of the retinal microvasculature is altered relatively early in the course of diabetic retinopathy. Quantification of electrotonic transmission between pairs of perforated-patch pipettes sealed onto abluminal cells in capillaries, tertiary arterioles and secondary arterioles revealed that the decay rate for a spreading voltage increased from ~2%/100 μm in the non-diabetic microvasculature to ~10%/100 μm in the diabetic microvasculature. This 5-fold increase in the rate of decay was observed in retinal microvessels of rats that were hyperglycemic for two months, which is prior to the onset of large scale diabetes-induced microvascular cell death (Mizutani et al., 1996). In contrast to this inhibition of axial transmission, our data indicate that the efficacy of radial transmission between abluminal cells and endothelial cells was not significantly affected by diabetes. Thus, our dual recording experiments indicated that diabetes alters the electrotonic architecture of the retinal microvasculature by selectively inhibiting the axial spread of voltage.
Finding that diabetes inhibits the axial transmission of voltages through retinal microvessels adds further support for the idea that the function of gap junction pathways is impaired by this disorder of glucose metabolism. In a previous study in which abluminal cells of freshly isolated microvessels freshly were loaded with Neurobiotin, we observed that the cell-to-cell spread of this relatively large gap junction-permeant tracer (MW 286 Da) was diminished soon after the onset of streptozotocin-induced diabetes (Oku et al., 2001). The present study establishes that diabetes also impairs the cell-to-cell movement of the small ions that are responsible for the conduction of voltage.
At present, the biochemical mechanism accounting for the observed decrease in the efficacy of axial transmission remains to be determined. However, it does seem likely that an elevated concentration of glucose may play a role since investigators have demonstrated that hyperglycemia downregulates the expression of connexin 43 in cultured retinal endothelial cells and pericytes (Li et al., 2003; Fernandes et al., 2004). In addition, it has been reported that there is a significant reduction in connexins 43 immunostaining in vivo in the retinal capillaries of mice made diabetic by streptozotocin (Bobbie et al., 2010). However, currently, the effect of diabetes on other connexins in the retinal microvasculature remains to be determined.
What is the functional consequence of a diabetes-induced inhibition of axial transmission? To help address this question, we have modeled the effect of this inhibition on a voltage generated in the capillary network and transmitted electrotonically to the proximal microvasculature (Fig. 3). From this analysis, it is evident that a functional consequence of the diabetes-induced decrease in the efficacy of axial transmission would be that less of the voltage change generated by a vasoactive molecule acting in the capillary network would reach the proximal arterioles, where calcium influx via voltage-dependent calcium channels (Matsushita et al., 2010) regulates abluminal cell contractility and thereby, lumen diameter and blood flow. It seems likely that due to the limited functional reserve of the retina’s circulatory system (Puro, 2007), even a modest dysfunction of the retinal microvasculature could result in sight-threatening complications as the ability to effectively match local perfusion to meet the metabolic demands of neuronal and glial cells becomes compromised.
This study shows that the effect of diabetes on electrotonic transmission in the retinal microvasculature is not limited to the capillaries; the efficacy of axial transmission is also decreased in the arterioles. However, this is not the first evidence that diabetes affects retinal arterioles. For example, the function of inwardly rectifying K+ channels, ATP-sensitive K+ channels and voltage-dependent calcium channels in the arterioles is altered by diabetes (Matsushita & Puro, 2006; Ishizaki et al., 2009; Matsushita et al., 2010). Furthermore, a generalized effect of diabetes on the retinal vasculature is suggested by the discovery that abluminal cell death is not limited to the capillaries, but also occurs in the arterioles (Gardiner et al., 2007). An unanswered question is whether the diabetes-induced inhibition of axial transmission plays a role in causing the vascular cell death that is a hallmark of diabetic retinopathy.
This analysis was based on the study of freshly isolated microvascular complexes. An advantage of this experimental preparation is that it was relatively straightforward to obtain dual perforated-patch recordings from abluminal cells located at well defined locations within the retinal microvasculature. Yet, it must also be noted that future studies will need to provide in vivo verification of conclusions based on the study of isolated vessels; however, technical advances will be required in order to assay electrotonic transmission in the retinal microvasculature in vivo. In addition, it remains to be ascertained what effect the inhibition of axial transmission has on the regulation of retinal blood flow in vivo. Also, it will be important to determine the biochemical mechanism by which diabetes impairs axial transmission in the retinal microvasculature.
In conclusion, our dual perforated-patch recordings indicate that early in the course of diabetes, the efficacy of axial transmission is selectively diminished within the capillary/arteriolar complex of the retina. Due to this decrease in electrotonic transmission, the spread of a locally generated voltage is relatively limited in the diabetic microvasculature. As a consequence, there is a decrease in the effectiveness by which a capillary/arteriole complex can distribute and integrate voltages that are generated in response to vasoactive signals acting at various sites within this operational unit. Thus, by compromising the precision by which local perfusion is matched to meet local metabolic needs, the diabetes-induced inhibition of axial transmission may contribute to the progression of diabetic retinopathy.
Highlights.
We characterized the electronic architecture of the rat retinal microvasculature.
Dual perforated-patch recordings were used to quantify the transmission of voltage.
In diabetic microvessels, the rate of voltage decay was increased 5-fold.
Diabetes decreases electronic transmission in the retinal microvasculature.
This functional change may play a role in the progression of diabetic retinopathy.
Acknowledgments
This project was supported by Grants EY12505 and EY07003 from the National Institutes of Health. This paper is dedicated to the memory of Marshall Nirenberg, who introduced DGP to the scientific study of the retina.
Abbreviations
- ΔVstimulator
the voltage step induced at the site of current-injection
- ΔVresponder
voltage change detected at the non-stimulated site
Footnotes
Publisher's Disclaimer: This is a PDF file of an unedited manuscript that has been accepted for publication. As a service to our customers we are providing this early version of the manuscript. The manuscript will undergo copyediting, typesetting, and review of the resulting proof before it is published in its final citable form. Please note that during the production process errors may be discovered which could affect the content, and all legal disclaimers that apply to the journal pertain.
References
- Bobbie MW, Roy S, Trudeau K, Munger SJ, Simon AM. Reduced connexin 43 expression and its effect on the development of vascular lesions in retinas of diabetic mice. Invest Ophthalmol Vis Sci. 2010;51:3758–3763. doi: 10.1167/iovs.09-4489. [DOI] [PMC free article] [PubMed] [Google Scholar]
- Ciulla TA, Harris A, Latkany P, Piper HC, Arend O, Garzozi H, Martin B. Ocular perfusion abnormalities in diabetes. Acta Ophthalmol Scand. 2002;80:468–477. doi: 10.1034/j.1600-0420.2002.800503.x. [DOI] [PubMed] [Google Scholar]
- Fernandes R, Girao H, Pereira P. High glucose down-regulates intercellular communication in retinal endothelial cells by enhancing degradation of connexin 43 by a proteasome-dependent mechanism. J Biol Chem. 2004;279:27219–27224. doi: 10.1074/jbc.M400446200. [DOI] [PubMed] [Google Scholar]
- Funk RH. Blood supply of the retina. Ophthalmic Res. 1997;29:320–325. doi: 10.1159/000268030. [DOI] [PubMed] [Google Scholar]
- Gardiner TA, Archer DB, Curtis TM, Stitt AW. Arteriolar involvement in the microvascular lesions of diabetic retinopathy: implications for pathogenesis. Microcirculation. 2007;14:25–38. doi: 10.1080/10739680601072123. [DOI] [PubMed] [Google Scholar]
- Ishizaki E, Fukumoto M, Puro DG. Functional KATP channels in the rat retinal microvasculature: topographical distribution, redox regulation, spermine modulation and diabetic alteration. J Physiol. 2009;587:2233–2253. doi: 10.1113/jphysiol.2009.169003. [DOI] [PMC free article] [PubMed] [Google Scholar]
- Kawamura H, Sugiyama T, Wu DM, Kobayashi M, Yamanishi S, Katsumura K, Puro DG. ATP: a vasoactive signal in the pericyte-containing microvasculature of the rat retina. J Physiol. 2003;551:787–799. doi: 10.1113/jphysiol.2003.047977. [DOI] [PMC free article] [PubMed] [Google Scholar]
- Kohner EM, Patel V, Rassam SM. Role of blood flow and impaired autoregulation in the pathogenesis of diabetic retinopathy. Diabetes. 1995;44:603–607. doi: 10.2337/diab.44.6.603. [DOI] [PubMed] [Google Scholar]
- Kuwabara T, Cogan D. Studies of retinal vascular patterns. 1: normal architecture. Arch Ophthalmol. 1960;64:904–911. doi: 10.1001/archopht.1960.01840010906012. [DOI] [PubMed] [Google Scholar]
- Li AF, Sato T, Haimovici R, Okamoto T, Roy S. High glucose alters connexin 43 expression and gap junction intercellular communication activity in retinal pericytes. Invest Ophthalmol Vis Sci. 2003;44:5376–5382. doi: 10.1167/iovs.03-0360. [DOI] [PubMed] [Google Scholar]
- Matsushita K, Fukumoto M, Kobayashi T, Kobayashi M, Ishizaki E, Minami M, Katsumura K, Liao SD, Wu DM, Zhang T, Puro DG. Diabetes-induced inhibition of voltage-dependent calcium channels in the retinal microvasculature: role of spermine. Invest Ophthalmol Vis Sci. 2010;51:5979–5990. doi: 10.1167/iovs.10-5377. [DOI] [PMC free article] [PubMed] [Google Scholar]
- Matsushita K, Puro DG. Topographical heterogeneity of KIR currents in pericyte-containing microvessels of the rat retina: effect of diabetes. J Physiol. 2006;573:483–495. doi: 10.1113/jphysiol.2006.107102. [DOI] [PMC free article] [PubMed] [Google Scholar]
- Mizutani M, Kern TS, Lorenzi M. Accelerated death of retinal microvascular cells in human and experimental diabetic retinopathy. J Clin Invest. 1996;97:2883–2890. doi: 10.1172/JCI118746. [DOI] [PMC free article] [PubMed] [Google Scholar]
- Oku H, Kodama T, Sakagami K, Puro DG. Diabetes-induced disruption of gap junction pathways within the retinal microvasculature. Invest Ophthalmol Vis Sci. 2001;42:1915–1920. [PubMed] [Google Scholar]
- Peppiatt CM, Howarth C, Mobbs P, Attwell D. Bidirectional control of CNS capillary diameter by pericytes. Nature. 2006;443:700–704. doi: 10.1038/nature05193. [DOI] [PMC free article] [PubMed] [Google Scholar]
- Puro DG. Physiology and pathobiology of the pericyte-containing retinal microvasculature: new developments. Microcirculation. 2007;14:1–10. doi: 10.1080/10739680601072099. [DOI] [PubMed] [Google Scholar]
- Wu DM, Miniami M, Kawamura H, Puro DG. Electrotonic transmission within pericyte-containing retinal microvessels. Microcirculation. 2006;13:353–363. doi: 10.1080/10739680600745778. [DOI] [PubMed] [Google Scholar]
- Ye XD, Laties AM, Stone RA. Peptidergic innervation of the retinal vasculature and optic nerve head. Invest Ophthalmol Vis Sci. 1990;31:1731–1737. [PubMed] [Google Scholar]
- Zhang T, Wu DM, Xu GZ, Puro DG. The electrotonic architecture of the retinal microvasculature: modulation by angiotenisin II. J Physiol. 2011;589:2383–2399. doi: 10.1113/jphysiol.2010.202937. [DOI] [PMC free article] [PubMed] [Google Scholar]