Abstract
Objectives:
To describe lesional diffusion-weighted imaging characteristics in a cohort of patients with biopsy-proven CNS inflammatory demyelinating disease (IDD) and compare diffusion characteristics of ring-enhancing CNS IDD lesions vs abscesses and tumors.
Methods:
Forty prebiopsy apparent diffusion coefficient (ADC) maps were reviewed from 30 patients with CNS IDD. Lesions were analyzed for size, T2-weighted (T2W) hypointense rim, enhancement, and ADC pattern. ADC patterns of CNS IDD ring-enhancing lesions were compared with a published cohort of 35 patients with ring-enhancing tumors and abscesses.
Results:
IDD lesions displayed a spectrum of peripheral ADC patterns at the lesion edge: restricted diffusion (low ADC), 33%; increased diffusion (high ADC), 60%; and normal diffusion (homogeneously isointense), 7%. Of biopsied lesions, 93% enhanced (ring, 52%; heterogeneous, 34%; homogeneous, 7%). A hypointense T2W rim was observed in 53%. A ring pattern on ADC (isointense or dark) was associated with T2W hypointense rims (p = 0.02) but not with ring enhancement. On serial imaging, 4 of 7 (57%) patients demonstrated changes in ADC patterns. Peripheral restriction was more common in IDD (p = 0.006) than in tumors or abscesses, whereas central restriction was only observed in abscesses. Restricted lesions in the same stage were more common in the non-IDD cohort (42% vs 20%), with a uniform restricted pattern seen only in abscesses.
Conclusions:
In ring-enhancing lesions, peripheral diffusion restriction is more common in IDD than in tumors/abscesses, whereas central restriction is more common among abscesses. Rapid ADC pattern changes in IDD probably reflect dynamic lesion evolution and may distinguish IDD from tumors.
Large or ring-enhancing demyelinating lesions may mimic neoplasms, abscesses, or ischemic strokes on conventional MRI and thus pose considerable diagnostic challenges.1,2 New MRI techniques, such as diffusion-weighted imaging (DWI), may increase pathologic specificity and help differentiate demyelinating lesions from alternative pathologic conditions.3–8
The DWI characteristics of acute demyelinating lesions are not well described, and a spectrum of changes has been reported. Radiologic studies have shown that the center of ring-enhancing lesions has increased diffusion compared with the enhancing edge, which can display restricted diffusion.9,10 A small study of 5 patients with acute CNS inflammatory demyelinating disease (IDD) found increased diffusion in their lesions,11 whereas multiple case reports have described restricted diffusion. Restricted diffusion in a concentric band surrounding a central nidus of facilitated diffusion has been described in Baló concentric sclerosis (BCS).12–15 Diffusion is usually facilitated in primary neoplasms, although high-grade tumors, metastasis, and lymphomas can have restricted diffusion.7,16–18 Intracerebral abscesses usually have restricted diffusion centrally.19,20
Larger scale DWI studies of pathologically characterized acute demyelinating lesions are lacking. The objectives of our study were 1) to describe diffusion imaging characteristics in a cohort of biopsy-proven acute CNS IDD and assess associations between ADC characteristics and clinical variables, 2) to describe changes in diffusion imaging characteristics on serial imaging, and 3) to compare diffusion imaging characteristics of CNS IDD with those of abscesses and primary and metastatic brain tumors.
METHODS
Standard protocol approvals, registrations, and patient consents.
All patients gave written informed consent to participate in this study, which was approved by the Mayo Clinic Institutional Review Board.
CNS IDD cohort.
This study is a retrospective review of MRI and clinical data from patients with biopsy-proven CNS IDD. Inclusion criteria were the following: 1) brain biopsy as part of diagnostic evaluation; 2) one or more brain diffusion-weighted MRI studies including ADC maps performed <3 months before biopsy; and 3) CNS IDD confirmed by a neuropathologist. We excluded patients with neoplasms, infection, and vascular or other nondemyelinating inflammatory disease as well as patients with a prior history of brain irradiation. Furthermore, we also excluded patients with acute disseminated encephalomyelitis defined based on pathologic criteria21 and neuromyelitis optica based on clinical criteria.22
Thirty patients from the MS Lesion Project database (n = 780) at Mayo Clinic met the inclusion criteria. Twenty-three patients had one study, and 7 had multiple prebiopsy MRIs. In cross-sectional analysis, we analyzed the MRI results nearest to the biopsy date.
Clinical material.
Clinical information was obtained via medical record review, personal interview, patient letter or telephone contact, and family or physician contact. Birth date, gender, date of symptom onset, date of index attack (attack leading to biopsy), index attack symptoms, estimated Expanded Disability Status Scale (EDSS) score at index attack, date of last follow-up, and EDSS score at last follow-up were reported. The clinical course at the time of biopsy and at the last follow-up was categorized as first demyelinating event, monophasic, relapsing remitting, secondary progressive, primary progressive, or uncertain. Patients were classified at the last follow-up as having either definite (by Poser or McDonald criteria) or probable (by Poser criteria) multiple sclerosis (MS) or a clinically isolated syndrome.
Radiographic material.
A single rater, blinded to the clinical data, evaluated the MRI studies. Lesions identified on MRI were defined as either the index (biopsied) lesion or other enhancing (active) lesions. All enhancing lesions on brain MRI were analyzed for number, size, and qualitative ADC patterns. ADC patterns were divided into the following 3 groups:
Reduced/restricted diffusion present in any part of the lesion: (1A) homogeneously dark ADC map (homogeneous restriction); (1B) dark peripheral ADC ring/arc with bright center (peripheral restriction); and (1C) peripherally bright ADC map with dark center (central restriction).
Reduced/restricted diffusion not present in any part of the lesion, with increased/facilitated diffusion detected as: (2A) homogeneously bright ADC map (homogeneous facilitation); (2B) bright ring/arc ADC map surrounding isointense ADC ring/arc with bright center (central facilitation); and (2C) heterogeneously mixed bright/isointense ADC map (heterogeneous facilitation).
Reduced/restricted diffusion not present in any part of the lesion, with normal/neutral diffusion detected as homogeneously isointense ADC. In patients with serial DWI scans, the diffusion patterns were characterized as either stable or changed.
Lesions were also analyzed for the presence of T2-weighted (T2W) hypointense rims.23 Enhancement patterns were defined as homogeneous (uniform enhancement), ring-like (peripheral ring or arc), or heterogeneous (variable/complex pattern).
Comparative tumor and abscess cohort.
A comparison cohort from a previously published study evaluating ring-enhancing lesions by our team was used in this study.23 The cohort included 13 abscesses, 14 primary brain tumors, and 8 cases of cerebral metastasis. Ring-enhancing lesions were analyzed for size, ADC patterns, and presence of a T2W rim.
Statistics.
Statistical analysis describing clinical data and comparing clinical outcomes with radiographic features was limited to the 21 patients with clinical data. To increase representativeness and statistical power, data from all 30 patients were used to describe and make comparisons between various radiographic features. To maintain statistical independence among observations, we analyzed findings at the patient level rather than at the lesion level.
We report counts and proportions for categorical variables and median, ranges, and interquartile ranges (IQRs) for numeric variables. When examining the association between 2 categorical variables we used the Fisher exact test. When examining the association between a binary categorical variable and a numeric variable, we used a two-sample Wilcoxon rank sum test. All tests were 2 sided. Because this analysis is primarily descriptive, we did not adjust our p values for multiple comparisons.24,25 However, we report p values to several digits to allow for Bonferroni-type corrections if desired. Data manipulation was performed using SAS 9.1 (SAS Institute, Cary, NC), whereas analyses were performed using R 2.8.1 (R Foundation for Statistical Computing, Vienna, Austria).
RESULTS
Demographics and cross-sectional clinical characteristics of the biopsied cohort.
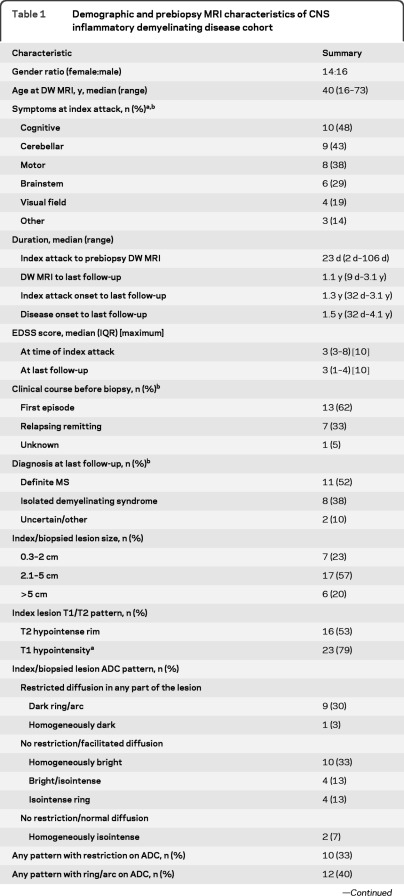
Clinical data were available for 21 of 30 patients (table 1). Median age was 40 years. Symptoms at presentation in decreasing frequency were cerebellar, motor, or cognitive; most patients (15 of 21, 71%) had polysymptomatic presentations. The index attack leading to biopsy was the first attack in 13 of 21 (62%), preceded by other attacks in 7 of 21 (33%), and indeterminate in 1 of 21 (5%). At the last follow-up, 11 of 21 (52%) had definite relapsing-remitting MS, and 8 of 21 (38%) had clinically isolated syndrome. The median duration from disease onset to the last follow-up was 1.5 years. Median EDSS score at the index attack was 3.0 (IQR 3.0−8.0) and at the last follow-up was also 3.0 (IQR 1.0−4.0).
Table 1.
Demographic and prebiopsy MRI characteristics of CNS inflammatory demyelinating disease cohort
Abbreviations: ADC = apparent diffusion coefficient; DW = diffusion weighted; EDSS = Expanded Disability Status Scale; IQR = interquartile range; MS = multiple sclerosis.
15 of 21 patients had multiple symptoms.
Among 21 patients with full clinical data available.
Among 29 patients with T1-weighted MRI.
Cross-sectional radiographic characteristics of the biopsied cohort.
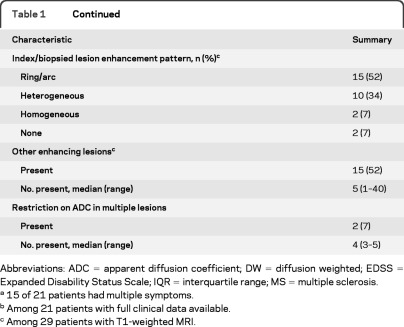
The median duration between index attack to prebiopsy MRI date was 23 days (range 2−106 days). Table 1 summarizes the prebiopsy MRI characteristics. Median index lesion size was 2.8 cm (range 0.8−8.2 cm), with 7 of 30 (57%) lesions ranging between 2.1 and 5 cm, 17 of 30 (23%) ≤2 cm, and 6 of 40 (20%) >5 cm. A hypointense T2W rim was observed in 16 of 30 (53%) index lesions, and 27 of 29 (93%) index lesions demonstrated gadolinium enhancement. Ring or arc-like enhancement was the most frequent (15 of 29 [52%]); heterogeneous enhancement was seen in 10 of 29 (34%) and 2 of 29 (7%) demonstrated homogeneous enhancement. Other, nonindex, enhancing lesions were present in 15 of 29 (52%) patients.
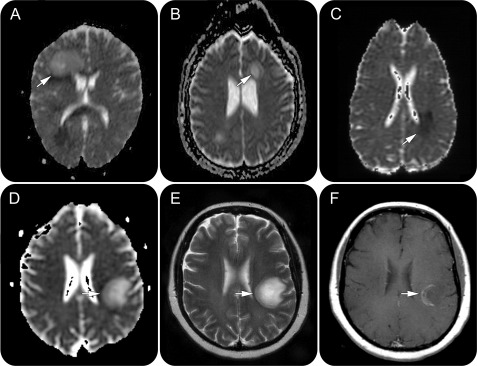
Index lesions demonstrated a variety of ADC patterns as illustrated in table 1 and figure e-1 on the Neurology® Web site at www.neurology.org. Restricted diffusion in any part of the lesion was seen in 10 of 30 (33%) patients. In this subcohort of 10 patients, with the exception of one patient who demonstrated homogeneous restriction (figure 1C), peripheral restriction with a partial (n = 6) (figure 1A) or complete dark ring (n = 3) surrounding a bright center was demonstrated. Among these 9 patients, a unique Baló-like pattern of concentric rings (figure 1, D–F) was seen in 5 patients, whereas 4 patients had a dark ring/arc ADC pattern.
Figure 1. Prebiopsy CNS inflammatory demyelinating disease MRIs demonstrating the spectrum of apparent diffusion coefficient (ADC) patterns.
(A) Dark ring/arc pattern with a partial ring of peripherally restricted diffusion surrounding a bright facilitated center. Other regions demonstrate restricted diffusion. (B) Isointense ring pattern with an isointense ring of peripherally normal diffusion surrounding a bright, facilitated center. (C) Homogeneously dark pattern with dark signal throughout the lesion. (D–F) Case of Baló concentric sclerosis. (D) ADC demonstrates a dark arc of restricted diffusion at the periphery of the lesion. (E) T2-weighted (T2W) image of the same patient showing colocalization of the ADC arc with a T2W dark ring/arc. In addition, numerous concentric T2W hypointense rings are apparent. (F) T1-weighted image with gadolinium shows the corresponding concentric arc enhancement pattern.
Restriction was present in a single lesion in 8 of 10 (80%) patients and in multiple lesions in 2 of 10 (20%) patients, with one having 3 and the other 5 restricted lesions. Neither of the patients with multiple restricted lesions showed the same ADC pattern in all lesions.
Restricted diffusion was not present in 18 of 30 (60%) patients. The most common ADC pattern was homogeneously facilitated (10 of 30, 33%). Other patterns included central facilitation with isointense peripheral ring (figure 1B) in 4 of 30 (13%) patients and heterogeneous facilitation in 4 of 30 (13%) patients. A homogeneously isointense ADC pattern was seen in 2 of 30 (7%) of patients.
Cross-sectional clinical/radiographic and radiographic/ radiographic associations.
Restricted diffusion on ADC was associated with a higher EDSS score at index attack (median EDSS 8.2 vs 3.0; p = 0.04). An ADC ring/arc pattern (dark ring or isointense ring) was associated with the presence of a T2W hypointense rim (p = 0.02) but not with the presence of a ring/arc enhancing pattern (p = 0.13) (figure 1, D and E). There was no association between a dark ring/arc ADC pattern and the presence of a T2 hypointense rim (p = 0.21). There was no association between time from index attack to MRI and the presence of restricted diffusion (p = 0.92).
Longitudinal clinical and radiographic characteristics of the cohort.
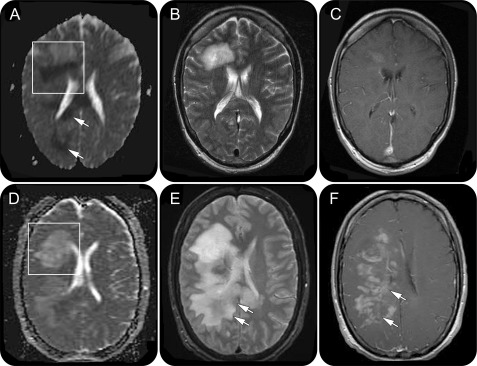
Clinical data were available for 6 of the 7 patients with serial prebiopsy MRIs. Four of 7 patients demonstrated a change in index lesion ADC pattern over a median of 18 days (range 3–42) (figure 2). Figure e-2 summarizes the radiographic and clinical changes over time; in 3 of 5 patients with neurologic decline, the index lesion evolved from a homogeneously facilitated to a dark/isointense ring ADC pattern reflecting reduced diffusion at the edge of the lesion. The only patient with clinical improvement was characterized by a decrease in index lesion size, corresponding with index lesion evolution from an isointense ring to a homogeneously facilitated ADC pattern, reflecting increased diffusion at the edge of the lesion.
Figure 2. Evolution of apparent diffusion coefficient (ADC) pattern on prebiopsy serial MRI scans over a 12-day interval in a patient with CNS inflammatory demyelinating disease.
(A and D) Boxed region on the ADC map demonstrates the change in the ADC pattern of the index lesion from a dark arc (A) to a bright/isointense (D) pattern. In addition, arrows (A) indicate areas of restricted diffusion extending beyond the index/biopsied lesion on the initial MRI scan. (B and E) Regions of restricted diffusion observed in A are not initially associated with T2-weighted signal abnormalities (B) until the subsequent MRI (E, arrows). (C and F) Similarly, gadolinium enhancement develops in the previous areas of restricted diffusion, 12 days later (F, arrows).
Demographics and radiographic characteristics of the tumor and abscess cohort.
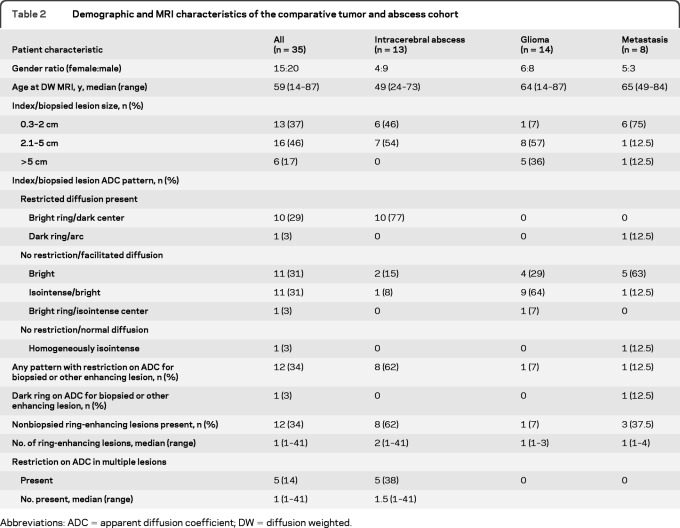
Table 2 summarizes the tumor and abscess cohort. The index (biopsied or largest) lesion size was ≤2 cm in 13 of 35 (37%), 2.1−5 cm in 16 of 35 (46%), and >5 cm in 6 of 35 patients (17%), with none of the abscesses exceeding a size >5 cm. A hypointense T2W rim was present in 27 of 35 (77%) lesions.
Table 2.
Demographic and MRI characteristics of the comparative tumor and abscess cohort
Abbreviations: ADC = apparent diffusion coefficient; DW = diffusion weighted.
The index lesion displayed a spectrum of ADC patterns with restricted diffusion in any part of the lesion in 11 of 35 (31%) patients. The most common restricted ADC pattern was central restriction in 10 of 35 (29%) patients, with a dark center and bright periphery (figure e-3A). This pattern was seen only among the abscess group and never among patients with IDD. The only other restricted ADC pattern observed was characterized by peripheral restriction seen in a single case of metastatic disease (3%). Among patients with no diffusion restriction, an ADC pattern of either homogeneous or heterogeneous facilitation was observed in 12 of 20 (60%). An isointense/normal center surrounded by bright/facilitated ring was present in one patient with glioma (3%). No patients displayed an isointense ring pattern. Diffusion was normal in one patient (3%)
Other ring-enhancing lesions (figure e-3C) were present in 12 of 35 patients (34%; median 1; range 1–40). Five of 11 patents with restricted diffusion had multiple restricted lesions; all 5 were patients with abscesses, with a uniform low ADC lesion center (figure e-3A).
Comparative analysis among CNS IDD, tumor, and abscess cohorts.
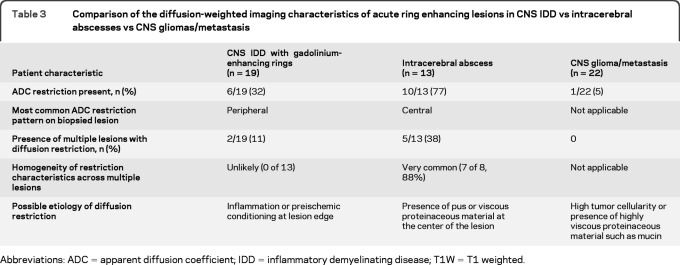
Comparative analysis was restricted to 19 patients with IDD with ring enhancement (table 3). The abscess cohort was more likely than the IDD cohort to show restriction in any ring-enhancing lesion (77% vs 32%; p = 0.03). Most importantly, 10 of 13 lesions in the abscess cohort displayed a restricted ADC center and bright periphery; this was never observed among patients with IDD. In contrast, a dark ring on ADC was significantly more common in the IDD cohort than in the tumor/abscess cohort (32% vs 3%; p = 0.006) (figure e-3B). Although a dark ring ADC pattern was also observed in a single patient with metastasis, a colocalization of a dark ring on ADC and the presence of a T2W hypointense rim was only observed in the patients with IDD (figure 1, D and E).
Table 3.
Comparison of the diffusion-weighted imaging characteristics of acute ring enhancing lesions in CNS IDD vs intracerebral abscesses vs CNS gliomas/metastasis
Abbreviations: ADC = apparent diffusion coefficient; IDD = inflammatory demyelinating disease; T1W = T1 weighted.
DISCUSSION
Our results demonstrate that ADC maps can be useful tools in differentiating challenging acute demyelinating brain lesions from alternative etiologies. Approximately one-third of IDD lesions in our study demonstrated restricted diffusion, most commonly as an ADC dark arc or ring at the lesion edge. Such peripheral diffusion restriction was significantly more common in ring-enhancing IDD lesions than in tumors and abscesses. Although we did not include strokes in our comparative cohort, the presence of peripheral restriction has not been reported in infarcts: typically, diffusion restriction is found throughout the ischemic tissue, with the lowest ADC values detected at the infarct core.26–28
The presence of peripheral restricted diffusion in acute demyelinating lesions may be due to intramyelinic edema or myelin vacuolation, which has been reported in toxic demyelination and some inborn errors of metabolism.29 Alternatively, myelin breakdown may reduce water movement in the extracellular space because of reduced fiber tract organization. Another potential mechanism is the presence of a hypercellular inflammatory infiltrate at the edge of acute demyelinating lesions or the presence of iron-laden macrophages, which can result in an overall lack of DWI signal because of very rapid T2* relaxation, as also seen in macrophages in the center of abscesses.7,10,30,31 If ADC restriction in MS was universally caused by the presence of macrophages, then T2 hypointense rims/arcs and ADC hypointense rims/arcs would have had a strong and significant correlation, which was not demonstrated in our study.
An arc or ring of ADC restriction has also been reported in Baló-like lesions.14,15,32 These lesions are characterized by the presence of a concentric ring pattern on MRI and histology.33,34 A pathologic study of 14 patients suggested that the concentric layering in BCS may be due to ischemic preconditioning, because increased expression of hypoxia markers in oligodendrocytes is also present (i.e., hypoxia-inducible factor 1α and heat shock protein 70).35 Such hypoxic changes could account for the diffusion restriction seen at the BCS lesion edge. Five patients in our study demonstrated a concentric ring pattern (figure 2, D–F), and all had restricted diffusion. In addition, 3 patients demonstrated expansion of diffusion restriction to areas that initially appeared normal but subsequently developed abnormal T2 signal and/or enhancement. Diffusion restriction preceding T2W signal abnormality has been reported in several cases of BCS.15,32
A second component of ADC pattern analysis is the behavior of multiple lesions within the same patient at the same time point: in CNS IDD, variable ADC patterns were observed, representing different stages of lesion evolution, with none of the patients displaying the same pattern in all lesions. In contrast, the abscess group demonstrated homogeneity, probably as a result of hematogenous spread. A third component of ADC pattern analysis relates to temporal evolution: the IDD cohort demonstrated rapid changes in ADC patterns on serial studies. Although serial analysis was not performed in the comparative cohort, such rapid changes would not be expected in a neoplastic process.
An important clinical association was demonstrated between index attack disability and the presence of restricted diffusion in the index/biopsied lesion. This could potentially reflect a greater extent of inflammation and/or tissue damage leading to restriction in water diffusion, resulting in more severe clinical deficits.
Limitations of this study include its retrospective nature and relatively small sample size. In addition, clinical disability was not assessed on the day of the scan, but was estimated; clinical outcome was known only for a subgroup of patients. In addition, because studies were done at a variety of institutions and the diffusion parameters were therefore not standardized, diffusion data could only be analyzed qualitatively. Finally, only cross-sectional analysis was available for the comparative cohort.
Future prospective longitudinal standardized DWI studies of acute demyelinating lesions may yield valuable information regarding their pathogenesis and temporal evolution. In addition, DWI could have a role in the differential diagnosis of ring-enhancing lesions, potentially obviating the need for biopsy in some cases.
Supplementary Material
GLOSSARY
- ADC
apparent diffusion coefficient
- BCS
Baló concentric sclerosis
- DWI
diffusion-weighted imaging
- EDSS
Expanded Disability Status Scale
- IDD
inflammatory demyelinating disease
- IQR
interquartile range
- MS
multiple sclerosis
- T2W
T2-weighted
Footnotes
Supplemental data at www.neurology.org
AUTHOR CONTRIBUTIONS
Dr. Abou Zeid: study concept or design, acquisition of data, analysis of data, statistical analysis, drafting/revising the manuscript. Dr. Pirko: drafting/revising the manuscript, analysis of data. Dr. B. Erickson: study concept or design, acquisition of data, analysis of data. S.D. Weigand: study concept or design, acquisition of data, analysis of data, statistical analysis. K.M. Thomsen: study concept or design, acquisition of data, analysis of data, statistical analysis. Dr. Scheithauer: study concept or design, acquisition of data, analysis of data, statistical analysis. Dr. Parisi: acquisition of data, analysis of data. Dr. Giannini: acquisition of data, analysis of data. L. Linbo: acquisition of data. Dr. Lucchinetti: study concept or design, acquisition of data, analysis of data, statistical analysis, study supervision, obtaining funding, drafting/revising the manuscript.
DISCLOSURE
The authors report no disclosures relevant to the manuscript. Go to Neurology.org for full disclosures.
REFERENCES
- 1.Annesley-Williams D, Farrell MA, Staunton H, Brett FM. Acute demyelination, neuropathological diagnosis, and clinical evolution. J Neuropathol Exp Neurol 2000; 59: 477– 489 [DOI] [PubMed] [Google Scholar]
- 2.Ernst T, Chang L, Walot I, Huff K. Physiologic MRI of a tumefactive multiple sclerosis lesion. Neurology 1998; 51: 1486– 1488 [DOI] [PubMed] [Google Scholar]
- 3.Cercignani M, Iannucci G, Filippi M. Diffusion-weighted imaging in multiple sclerosis. Ital J Neurol Sci 1999; 20: S246– S249 [DOI] [PubMed] [Google Scholar]
- 4.Rovaris M, Gass A, Bammer R, et al. Diffusion MRI in multiple sclerosis. Neurology 2005; 65: 1526– 1532 [DOI] [PubMed] [Google Scholar]
- 5.Schaefer PW, Grant PE, Gonzalez RG. Diffusion-weighted MR imaging of the brain. Radiology 2000; 217: 331– 345 [DOI] [PubMed] [Google Scholar]
- 6.Al-Okaili RN, Krejza J, Woo JH, et al. Intraaxial brain masses: MR imaging-based diagnostic strategy: initial experience. Radiology 2007; 243: 539– 550 [DOI] [PubMed] [Google Scholar]
- 7.Karaarslan E, Arslan A. Diffusion weighted MR imaging in non-infarct lesions of the brain. Eur J Radiol 2008; 65: 402– 416 [DOI] [PubMed] [Google Scholar]
- 8.Mukherji SK, Chenevert TL, Castillo M. Diffusion-weighted magnetic resonance imaging. J Neuroophthalmol 2002; 22: 118– 122 [DOI] [PubMed] [Google Scholar]
- 9.Phuttharak W, Galassi W, Laopaiboon V, Laopaiboon M, Hesselink JR. ADC measurements in various patterns of multiple sclerosis lesions. J Med Assoc Thai 2006; 89: 196– 204 [PubMed] [Google Scholar]
- 10.Tievsky AL, Ptak T, Farkas J. Investigation of apparent diffusion coefficient and diffusion tensor anisotrophy in acute and chronic multiple sclerosis lesions. AJNR Am J Neuroradiol 1999; 20: 1491– 1499 [PMC free article] [PubMed] [Google Scholar]
- 11.Castriota-Scanderbeg A, Sabatini U, Fasano F, et al. Diffusion of water in large demyelinating lesions: a follow-up study. Neuroradiology 2002; 44: 764– 767 [DOI] [PubMed] [Google Scholar]
- 12.Rosso C, Remy P, Creange A, Brugieres P, Cesaro P, Hosseini H. Diffusion-weighted MR imaging characteristics of an acute strokelike form of multiple sclerosis. AJNR Am J Neuroradiol 2006; 27: 1006– 1008 [PMC free article] [PubMed] [Google Scholar]
- 13.Rovira A, Pericot I, Alonso J, Rio J, Grive E, Montalban X. Serial diffusion-weighted MR imaging and proton MR spectroscopy of acute large demyelinating brain lesions: case report. AJNR Am J Neuroradiol 2002; 23: 989– 994 [PMC free article] [PubMed] [Google Scholar]
- 14.Kavanagh EC, Heran MK, Fenton DM, Lapointe JS, Nugent RA, Graeb DA. Diffusion-weighted imaging findings in Balo concentric sclerosis. Br J Radiol 2006; 79: e28– e31 [DOI] [PubMed] [Google Scholar]
- 15.Ball T, Malik O, Roncaroli F, Quest RA, Aviv RI. Apparent diffusion coefficient changes and lesion evolution in Balo's type demyelination-correlation with histopathology. Clin Radiol 2007; 62: 498– 503 [DOI] [PubMed] [Google Scholar]
- 16.Barboriak DP. Imaging of brain tumors with diffusion-weighted and diffusion tensor MR imaging. Magn Reson Imaging Clin N Am 2003; 11: 379– 401 [DOI] [PubMed] [Google Scholar]
- 17.Lemort M, Canizares-Perez AC, Van der Stappen A, Kampouridis S. Progress in magnetic resonance imaging of brain tumours. Curr Opin Oncol 2007; 19: 616– 622 [DOI] [PubMed] [Google Scholar]
- 18.Stadnik TW, Chaskis C, Michotte A, et al. Diffusion-weighted MR imaging of intracerebral masses: comparison with conventional MR imaging and histologic findings. AJNR Am J Neuroradiol 2001; 22: 969– 976 [PMC free article] [PubMed] [Google Scholar]
- 19.Ebisu T, Tanaka C, Umeda M, et al. Discrimination of brain abscess from necrotic or cystic tumors by diffusion-weighted echo planar imaging. Magn Reson Imaging 1996; 14: 1113– 1116 [DOI] [PubMed] [Google Scholar]
- 20.Kitis O, Altay H, Calli C, Yunten N, Akalin T, Yurtseven T. Minimum apparent diffusion coefficients in the evaluation of brain tumors. Eur J Radiol 2005; 55: 393– 400 [DOI] [PubMed] [Google Scholar]
- 21.Hart MN, Earle KM. Haemorrhagic and perivenous encephalitis: a clinical-pathological review of 38 cases. J Neurol Neurosurg Psychiatry 1975; 38: 585– 591 [DOI] [PMC free article] [PubMed] [Google Scholar]
- 22.Wingerchuk DM, Lennon VA, Pittock SJ, Lucchinetti CF, Weinshenker BG. Revised diagnostic criteria for neuromyelitis optica. Neurology 2006; 66: 1485– 1489 [DOI] [PubMed] [Google Scholar]
- 23.Schwartz KM, Erickson BJ, Lucchinetti C. Pattern of T2 hypointensity associated with ring-enhancing brain lesions can help to differentiate pathology. Neuroradiology 2006; 48: 143– 149 [DOI] [PubMed] [Google Scholar]
- 24.Perneger TV. What's wrong with Bonferroni adjustments. BMJ 1998; 316: 1236– 1238 [DOI] [PMC free article] [PubMed] [Google Scholar]
- 25.Rothman KJ. No adjustments are needed for multiple comparisons. Epidemiology 1990; 1: 43– 46 [PubMed] [Google Scholar]
- 26.Beauchamp NJ, Jr, Ulug AM, Passe TJ, van Zijl PC. MR diffusion imaging in stroke: review and controversies. Radiographics 1998; 18: 1269– 1283, discussion 1283−1265 [DOI] [PubMed] [Google Scholar]
- 27.Fiebach JB, Jansen O, Schellinger PD, Heiland S, Hacke W, Sartor K. Serial analysis of the apparent diffusion coefficient time course in human stroke. Neuroradiology 2002; 44: 294– 298 [DOI] [PubMed] [Google Scholar]
- 28.Lutsep HL, Albers GW, DeCrespigny A, Kamat GN, Marks MP, Moseley ME. Clinical utility of diffusion-weighted magnetic resonance imaging in the assessment of ischemic stroke. Ann Neurol 1997; 41: 574– 580 [DOI] [PubMed] [Google Scholar]
- 29.Sener RN. Diffusion magnetic resonance imaging patterns in metabolic and toxic brain disorders. Acta Radiol 2004; 45: 561– 570 [DOI] [PubMed] [Google Scholar]
- 30.Moritani T, Shrier DA, Numaguchi Y, et al. Diffusion-weighted echo-planar MR imaging: clinical applications and pitfalls: a pictorial essay. Clin Imaging 2000; 24: 181– 192 [DOI] [PubMed] [Google Scholar]
- 31.Roychowdhury S, Maldjian JA, Grossman RI. Multiple sclerosis: comparison of trace apparent diffusion coefficients with MR enhancement pattern of lesions. AJNR Am J Neuroradiol 2000; 21: 869– 874 [PMC free article] [PubMed] [Google Scholar]
- 32.Wiendl H, Weissert R, Herrlinger U, Krapf H, Kuker W. Diffusion abnormality in Balo's concentric sclerosis: clues for the pathogenesis. Eur Neurol 2005; 53: 42– 44 [DOI] [PubMed] [Google Scholar]
- 33.Chen CJ, Ro LS, Chang CN, Ho YS, Lu CS. Serial MRI studies in pathologically verified Balo's concentric sclerosis. J Comput Assist Tomogr 1996; 20: 732– 735 [DOI] [PubMed] [Google Scholar]
- 34.Moore GR, Berry K, Oger JJ, Prout AJ, Graeb DA, Nugent RA. Balo's concentric sclerosis: surviving normal myelin in a patient with a relapsing-remitting clinical course. Mult Scler 2001; 7: 375– 382 [DOI] [PubMed] [Google Scholar]
- 35.Stadelmann C, Ludwin S, Tabira T, et al. Tissue preconditioning may explain concentric lesions in Balo's type of multiple sclerosis. Brain 2005; 128: 979– 987 [DOI] [PubMed] [Google Scholar]
Associated Data
This section collects any data citations, data availability statements, or supplementary materials included in this article.


