

The presence of the hemorrhage exclusion sign on T1-weighted images with a corresponding area of low signal intensity on T2-weighted images is highly predictive for the presence of prostate cancer.
Abstract
Purpose:
To retrospectively determine the prevalence and positive predictive value (PPV) of the hemorrhage exclusion sign on T1-weighted magnetic resonance (MR) images in conjunction with findings on T2-weighted images in the detection of prostate cancer, with use of whole-mount step-section pathologic specimens from prostatectomy as the reference standard.
Materials and Methods:
The institutional review board approved this retrospective study, which was compliant with HIPAA, and the requirement to obtain informed consent was waived. Two hundred ninety-two patients with biopsy-proved prostate cancer underwent endorectal MR imaging followed by prostatectomy. The hemorrhage exclusion sign was defined as the presence of a well-defined area of low signal intensity surrounded by areas of high signal intensity on T1-weighted images. Two readers independently assessed the presence and extent of postbiopsy changes and the hemorrhage exclusion sign. The presence of a corresponding area of homogeneous low signal intensity on T2-weighted images was also recorded. The prevalence and PPV of the hemorrhage exclusion sign were calculated.
Results:
Readers 1 and 2 found postbiopsy changes in the peripheral zone in 184 (63%) and 189 (64.7%) of the 292 patients, respectively. In these patients, the hemorrhage exclusion sign was observed in 39 of 184 patients (21.2%) by reader 1 and 36 of 189 patients (19.0%) by reader 2. A corresponding area of homogeneous low signal intensity was seen on T2-weighted images in the same location as the hemorrhage exclusion sign in 23 of 39 patients (59%) by reader 1 and 19 of 36 patients (53%) by reader 2. The PPV of the hemorrhage exclusion sign alone was 56% (22 of 39 patients) for reader 1 and 50% (18 of 36 patients) for reader 2 but increased to 96% (22 of 23 patients) and 95% (18 of 19 patients) when the sign was identified in an area of homogeneous low signal intensity on T2-weighted images.
Conclusion:
Postbiopsy change is a known pitfall in the interpretation of T2-weighted images. The authors have shown that a potential benefit of postbiopsy change is the presence of excluded hemorrhage, which, in conjunction with a corresponding area of homogeneous low signal intensity at T2-weighted imaging, is highly accurate for cancer identification.
©RSNA, 2012
Introduction
Magnetic resonance (MR) imaging is generally used for local staging of prostate cancer rather than for primary detection of the disease. As a result, prostate MR imaging is usually performed after diagnostic transrectal ultrasonography (US)–guided prostate biopsy. Prostate cancer typically appears as a focus of low signal intensity on T2-weighted images; however, this finding is nonspecific and can also be seen with benign prostatic hypertrophy, prostatitis, and postbiopsy change. The latter is thought to be due at least in part to biopsy-related tissue trauma and hemorrhage and can be either intraglandular or located within the stroma separating the glands (1,2). Such change can persist for up to 4½ months after biopsy (1) and, although it can be readily identified by its high signal intensity on T1-weighted images, can compromise the interpretation of T2-weighted images because it can have a similar appearance to that of prostate cancer (low T2 signal intensity) in up to 80% of cases (3). Despite advances in MR technology, improvements in spatial resolution, and the introduction of new techniques such as diffusion-weighted imaging, this problem persists.
The problem of biopsy-related change has led some authors to recommend delaying MR imaging for 3–8 weeks after biopsy (1,4); however, the disappearance of biopsy-related change is not readily definable for a given individual. Indeed, some authors suggest that prostate MR imaging should precede biopsy in a bid to eliminate procedure-related artifacts and improve cancer detection (5). A counterargument is that, owing to the poor specificity of the serum prostate-specific antigen (PSA) test (6), a substantial proportion of men with benign disease would undergo MR imaging. Regardless, the ability to accurately detect foci of cancer is still beneficial, particularly with the development of focal therapy techniques such as thermal ablation therapy and high-intensity focused ultrasound (7,8).
At pathologic examination, the degree of hemorrhage has been shown to be significantly less in areas of prostate cancer than in regions where biopsy shows benign changes (9). This may be explained by the anticoagulant effect of citrate (10), the levels of which are known to be reduced in areas of prostate cancer (11); hence, any hemorrhage present in tumor foci would be expected to resolve more rapidly than hemorrhage in the normal peripheral zone. It appears intuitive that if this feature could be extrapolated to imaging there would be less biopsy-related hemorrhage within areas suspicious for tumor than in areas of benign prostatic tissue. Anecdotally, this feature has been dubbed the hemorrhage exclusion sign, whereby prostate tumors are outlined by postbiopsy change on T1-weighted images (12); to our knowledge, however, the usefulness of this finding has not been studied in the literature. Thus, the purpose of this study was to retrospectively determine the prevalence and positive predictive value (PPV) of the hemorrhage exclusion sign on T1-weighted MR images in conjunction with findings on T2-weighted images in the detection of prostate cancer, with use of whole-mount step-section pathologic specimens from prostatectomy as the reference standard.
Materials and Methods
Patient Characteristics
The institutional review board approved this retrospective study, which was compliant with the Health Insurance Portability and Accountability Act, and the requirement to obtain informed consent was waived. From the institutional radiology and pathology databases, we identified 311 consecutive patients during the period between February 1, 2008, and November 12, 2009, who met the following inclusion criteria: (a) Endorectal prostate MR imaging was performed after transrectal US-guided prostate biopsy, (b) prostatectomy was performed at our institution within 6 months of MR imaging, and (c) whole-mount step-section pathologic tumor maps were available. We excluded 19 patients who had previously undergone therapy for prostate cancer, had technically inadequate MR images, or did not have PSA and biopsy information available. Thus, our final study population consisted of 292 patients. Clinical details, including PSA levels, biopsy date, Gleason grade at biopsy and pathologic examination, date of MR imaging, and date of surgery, were recorded; a summary of the patient characteristics is shown in Table 1, and a description of the excluded patients is presented in Table 2.
Table 1.
Summary of Clinical and Pathologic Characteristics in Patients with and Patients without the Hemorrhage Exclusion Sign

Note.—Unless otherwise stated, data are numbers of patients, with percentages in parentheses. HES = hemorrhage exclusion sign.
Numbers in parentheses are ranges.
Table 2.
Summary of Excluded Patients

MR Imaging
MR imaging was performed with a 1.5-T (n = 237) or 3.0-T (n = 55) whole-body MR unit (Signa HDXt or Signa Excite; GE Medical Systems, Milwaukee, Wis) by using separate standardized protocols for each unit. Patients were examined in the supine position. A body coil was used for excitation, and a pelvic phased-array coil (GE Medical Systems) combined with an expandable endorectal coil (Medrad, Pittsburgh, Pa) filled with air was used for signal reception. T1-weighted transverse spin-echo images were obtained with the following parameters: 450–700-msec repetition time, 8-msec echo time (450–700/8), 5-mm-thick sections, 1-mm intersection gap, 28–36-cm field of view, and 256 × 192 matrix. Thin-section axial, sagittal, and coronal T2-weighted fast spin-echo images were obtained with the following parameters: 4000–5500/90–120 (effective), echo train length of 10–16, 3-mm-thick sections, no intersection gap, 14–20-cm field of view, and 256–320 × 192 matrix.
Image Interpretation
Two radiologists (T.B., H.A.V.) independently interpreted the MR images, which were archived in a picture archiving and communication system (Centricity, GE Medical Systems). At the time of interpretation, reader 1 (T.B.) was a senior trainee with 4 years of experience in prostate MR imaging and reader 2 (H.A.V.) was a body imaging fellow with 5 years of experience in prostate MR imaging. Neither reader was involved in the initial clinical interpretation of the MR images. Both readers were aware that the patients had prostate cancer and that a biopsy had been performed within 6 months but were blinded to clinical information, PSA values, biopsy results (tumor location and Gleason grade), and initial MR imaging reports. Axial T1-weighted images were assessed for the presence of hemorrhage, which was considered to be present when an area of high signal intensity was visualized within the prostate gland. If present, postbiopsy changes were recorded as being located in the peripheral or transition zone, right or left base, midgland, or apex. The designation of the transition zone as base, midgland, or apex was necessarily subjective and related to the equivalent peripheral zone level, allowing for the fact that the transition zone generally only extends into a portion of the apical third. The extent of postbiopsy changes was also recorded subjectively, as follows: 0 = none, 1 = mild (involving less than one-third of the respective region), 2 = moderate (involving between one-third and two-thirds of the region), and 3 = severe (involving more than two-thirds of the region). The hemorrhage exclusion sign was deemed to be present on T1-weighted images if there was either (a) a well-defined area of low signal intensity in the peripheral zone completely surrounded by an area of high signal intensity on at least one side or (b) diffuse high signal intensity within a peripheral zone region with an abrupt cutoff apparently outlining a lesion. The former definition would include small lesions or lesions extending to one margin of the peripheral zone, and the latter would include larger lesions extending to both margins of the peripheral zone.
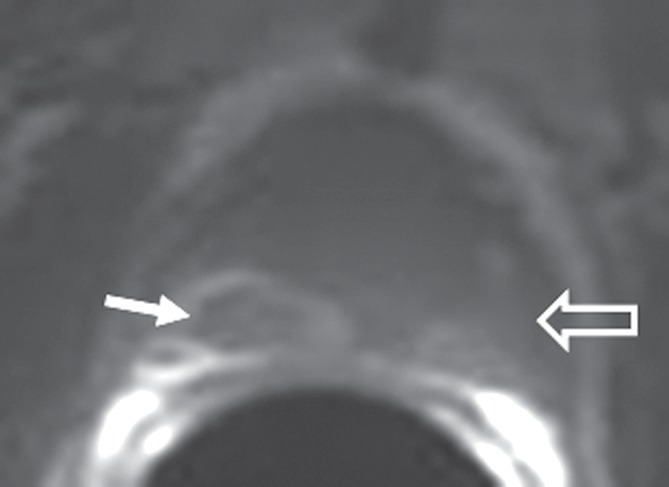
Axial T2-weighted images were used for anatomic correlation, in particular to differentiate the peripheral zone from the transition zone and postbiopsy changes from periprostatic fat (Fig 1). The presence or absence of a corresponding area of homogeneous low signal intensity on axial T2-weighted images was also recorded. The hemorrhage exclusion sign was not assessed in the transition zone owing to limitations imposed by the presence of benign prostatic hyperplasia and its known heterogeneous signal intensity. In cases demonstrating the hemorrhage exclusion sign in which the presence of tumor was confirmed with pathologic examination, the maximal axial tumor diameter was recorded.
Figure 1a:

Images demonstrate value of concurrent reading of axial T2-weighted images. (a) T1-weighted image (1.5 T, 466.7/8.0) shows areas of high signal intensity that may be considered due to postbiopsy change in the peripheral zone of the prostate gland (arrows). (b) T2-weighted image (1.5 T, 5150.0/116.7), however, shows these areas to represent periprostatic fat (arrows).
Figure 1b:
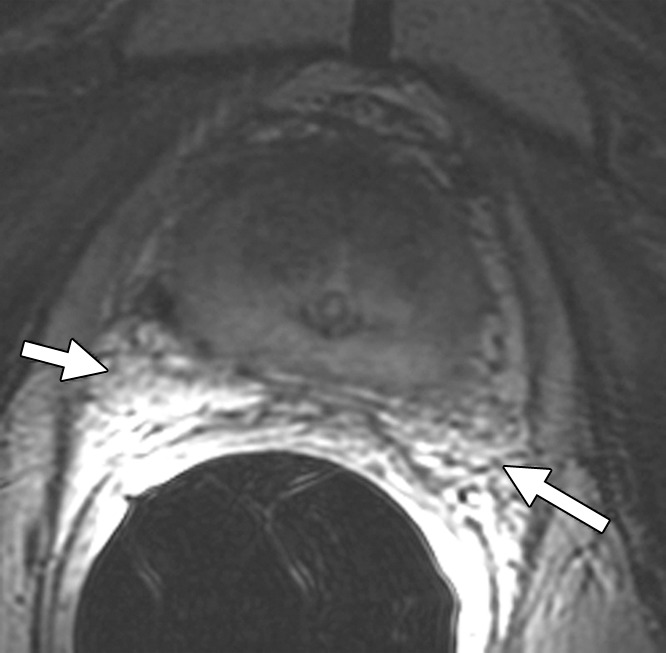
Images demonstrate value of concurrent reading of axial T2-weighted images. (a) T1-weighted image (1.5 T, 466.7/8.0) shows areas of high signal intensity that may be considered due to postbiopsy change in the peripheral zone of the prostate gland (arrows). (b) T2-weighted image (1.5 T, 5150.0/116.7), however, shows these areas to represent periprostatic fat (arrows).
Correlation with Histopathologic Findings
After prostatectomy, the prostate specimens were embedded in paraffin and sliced from apex to base at intervals of 3–4 mm. The distal 5-mm portion of the apex was amputated and coned. Microslices were placed on glass slides and stained with hematoxylin-eosin. Correlation of MR images to whole-mount pathologic tumor maps was performed in a single session by consensus of three authors (T.B., H.A.V., and O.A.). O.A. is a dedicated genitourinary radiologist with 8 years of experience. Tumor location at MR imaging was determined by correlating images to whole-mount pathologic slices, taking into account anatomic landmarks such as the prostatic urethra, prostate zones, ejaculatory ducts, and verumontanum and subjectively allowing for both prostatic distortions at MR imaging owing to the endorectal coil and the effects of specimen preparation (eg, tissue shrinkage).
Statistical Analysis
The presence, location, and extent of postbiopsy changes were summarized by using frequencies and percentages. Interreader agreement was assessed by using weighted κ statistics and interpreted as follows: values of less than 0.20 were indicative of poor agreement; 0.20–0.40, fair agreement; 0.41–0.60, moderate agreement; 0.61–0.80, good agreement; and 0.81–1.00, very good agreement. The Spearman correlation coefficient (r) was used to examine the correlation among the postbiopsy extent, number of sextants with postbiopsy changes, and interval between biopsy and MR imaging. The prevalence and PPV of the hemorrhage exclusion sign were calculated for each patient. P < .05 was considered indicative of a statistically significant difference. All analyses were done by using software (Stata 11; StataCorp, College Station, Tex).
Results
Patient and Tumor Characteristics
The median patient age was 60 years (range, 42–91 years), and the median PSA value was 4.74 ng/mL (range, 0.44–78.1 ng/mL). The final pathologic T stage was as follows: T2a (n = 45), T2b (n = 145), T2c (n = 17), T3a (n = 70), T3b (n = 13), and T4 (n = 2). The final Gleason grade was 3 + 3 (n = 66), 3 + 4 (n = 158), 3 + 5 (n = 1), 4 + 3 (n = 39), 4 + 4 (n = 16), 4 + 5 (n = 9), and 5 + 4 (n = 3). Tumor characteristics are summarized in Table 1.
MR Imaging Findings: Presence and Extent of Biopsy-related Changes
Readers 1 and 2 found biopsy-related changes in the peripheral zone in 184 (63.0%) and 189 (64.7%) of the 292 patients, respectively. When present in the peripheral zone and/or transition zone, biopsy-related changes were subjectively graded as mild, moderate, and severe, respectively, in 104 (51.2%), 71 (35.0%), and 27 (13.3%) of 202 patients by reader 1 and 101 (50.5%), 70 (35.0%), and 29 (14.5%) of 200 patients by reader 2. The interreader agreement for the extent of biopsy-related hemorrhage was good (κ = 0.67). The location of the postbiopsy changes according to each reader is summarized in Table 3.
Table 3.
Presence and Extent of Postbiopsy Changes

Note.—Data are numbers of patients, with percentages in parentheses.
Sextant location relates to right or left base, midgland, or apex.
Correlation of Interval between Biopsy and MR Imaging and Biopsy-related Changes
The mean interval between biopsy and MR imaging was 77.4 days (median, 64 days; range, 14–526 days). The mean interval between MR imaging and surgery was 39.2 days (median, 25 days; range, 0–181 days). There was a statistically significant correlation between the interval (in days) between prostate biopsy and MR imaging and the grade of hemorrhage (r = −0.29 and P < .001 for reader 1; r = −0.26 and P < .001 for reader 2) and number of sextants containing postbiopsy changes in the peripheral zone (r = −0.31 and P < .001 for reader 1; r = −0.27 and P < .001 for reader 2).
Hemorrhage Exclusion Sign
In patients with postbiopsy changes within the peripheral zone, the prevalence of the hemorrhage exclusion sign was 21.2% (39 of 184 patients) for reader 1 and 19.0% (36 of 189 patients) for reader 2. The interreader agreement for the presence of the sign was very good (κ = 0.89). For the detection of prostate cancer, the PPV of the hemorrhage exclusion sign on its own was 56.4% for reader 1 and 50.0% for reader 2.
In patients in whom the hemorrhage exclusion sign was seen on T1-weighted images, areas suspicious for cancer were seen on T2-weighted images in the same location as the hemorrhage exclusion sign in 23 of 39 patients (59%) by reader 1 and 19 of 36 patients (53%) by reader 2. The PPV of the hemorrhage exclusion sign increased to 96% (22 of 23 patients) and 95% (18 of 19 patients) when it was identified in an area suspicious for tumor on T2-weighted images. Examples illustrating the hemorrhage exclusion sign with and without corresponding suspicious areas on T2-weighted images, along with step-section pathologic tumor maps, are shown in Figures 2 and 3. In one case, both readers identified both the hemorrhage exclusion sign on T1-weighted images and an area of homogeneous low signal intensity on T2-weighted images; however, no tumor was found at pathologic examination. This case was diagnosed as a nodule of benign prostatic hyperplasia in the peripheral zone. When the hemorrhage exclusion sign was present on T1-weighted images and there was no corresponding area of low signal intensity on T2-weighted images, no foci of prostate cancer were identified on pathologic tumor maps (0 of 16 patients for reader 1; 0 of 17 patients for reader 2). In Table 4 , the hemorrhage exclusion sign has been correlated with the findings from T2-weighted imaging and pathologic examination.
Figure 2a:
Hemorrhage exclusion sign in 50-year-old man with stage T3a prostate cancer. (a) Axial T1-weighted MR image (1.5 T, 500.0/7.9) shows hemorrhage exclusion sign (solid arrow) in right mid peripheral zone. (b) Axial T2-weighted image (1.5 T, 5500/107.2) shows matching area of low signal intensity (solid arrow). (c) Corresponding photomicrograph of specimen from step-section pathologic examination (hematoxylin-eosin stain; original magnification, ×1) shows tumor foci in the right mid peripheral zone (solid arrow; areas outlined in black are Gleason 4 foci; areas outlined in green are Gleason 3 foci; overall Gleason grade = 3 + 4). High signal intensity is noted on MR images in left mid peripheral zone, consistent with minor hemorrhage (open arrow in a); however, there is no abrupt cutoff. Although there is corresponding low T2 signal (open arrow in b), no tumor is seen on photomicrograph (open arrow in c), confirming that findings represent postbiopsy change.
Figure 3a:

Images in 63-year-old man. (a) Axial T1-weighted MR image (1.5 T, 583.3/8.2) shows hemorrhage exclusion sign (arrow) in central posterior peripheral zone mid gland. (b) Axial T2-weighted image (1.5 T, 4283.0/121.4) does not show a corresponding area of low signal intensity (arrow). (c) Photomicrograph (hematoxylin-eosin stain; original magnification, ×1) at same level confirms absence of a tumor focus in this region (arrow); however, tumor is seen in anterior left peripheral zone at this level and anteriorly within transition zone (areas outlined in black and green). Overall Gleason grade was 3 + 4, and overall pathologic stage was T2b.
Table 4.
Correlation of the Hemorrhage Exclusion Sign with Findings at T2-weighted Imaging and Pathologic Examination

Figure 2b:

Hemorrhage exclusion sign in 50-year-old man with stage T3a prostate cancer. (a) Axial T1-weighted MR image (1.5 T, 500.0/7.9) shows hemorrhage exclusion sign (solid arrow) in right mid peripheral zone. (b) Axial T2-weighted image (1.5 T, 5500/107.2) shows matching area of low signal intensity (solid arrow). (c) Corresponding photomicrograph of specimen from step-section pathologic examination (hematoxylin-eosin stain; original magnification, ×1) shows tumor foci in the right mid peripheral zone (solid arrow; areas outlined in black are Gleason 4 foci; areas outlined in green are Gleason 3 foci; overall Gleason grade = 3 + 4). High signal intensity is noted on MR images in left mid peripheral zone, consistent with minor hemorrhage (open arrow in a); however, there is no abrupt cutoff. Although there is corresponding low T2 signal (open arrow in b), no tumor is seen on photomicrograph (open arrow in c), confirming that findings represent postbiopsy change.
Figure 2c:

Hemorrhage exclusion sign in 50-year-old man with stage T3a prostate cancer. (a) Axial T1-weighted MR image (1.5 T, 500.0/7.9) shows hemorrhage exclusion sign (solid arrow) in right mid peripheral zone. (b) Axial T2-weighted image (1.5 T, 5500/107.2) shows matching area of low signal intensity (solid arrow). (c) Corresponding photomicrograph of specimen from step-section pathologic examination (hematoxylin-eosin stain; original magnification, ×1) shows tumor foci in the right mid peripheral zone (solid arrow; areas outlined in black are Gleason 4 foci; areas outlined in green are Gleason 3 foci; overall Gleason grade = 3 + 4). High signal intensity is noted on MR images in left mid peripheral zone, consistent with minor hemorrhage (open arrow in a); however, there is no abrupt cutoff. Although there is corresponding low T2 signal (open arrow in b), no tumor is seen on photomicrograph (open arrow in c), confirming that findings represent postbiopsy change.
Figure 3b:

Images in 63-year-old man. (a) Axial T1-weighted MR image (1.5 T, 583.3/8.2) shows hemorrhage exclusion sign (arrow) in central posterior peripheral zone mid gland. (b) Axial T2-weighted image (1.5 T, 4283.0/121.4) does not show a corresponding area of low signal intensity (arrow). (c) Photomicrograph (hematoxylin-eosin stain; original magnification, ×1) at same level confirms absence of a tumor focus in this region (arrow); however, tumor is seen in anterior left peripheral zone at this level and anteriorly within transition zone (areas outlined in black and green). Overall Gleason grade was 3 + 4, and overall pathologic stage was T2b.
Figure 3c:

Images in 63-year-old man. (a) Axial T1-weighted MR image (1.5 T, 583.3/8.2) shows hemorrhage exclusion sign (arrow) in central posterior peripheral zone mid gland. (b) Axial T2-weighted image (1.5 T, 4283.0/121.4) does not show a corresponding area of low signal intensity (arrow). (c) Photomicrograph (hematoxylin-eosin stain; original magnification, ×1) at same level confirms absence of a tumor focus in this region (arrow); however, tumor is seen in anterior left peripheral zone at this level and anteriorly within transition zone (areas outlined in black and green). Overall Gleason grade was 3 + 4, and overall pathologic stage was T2b.
Size of Tumors Demonstrating the Hemorrhage Exclusion Sign
Twenty-four prostate cancer tumors detected at pathologic examination were deemed to have the hemorrhage exclusion sign on T1-weighted MR images by either reader. The mean maximal axial diameter of these tumors was 1.5 cm (range, 0.7–3.0 cm).
Discussion
Herein, we present the prevalence and importance of the hemorrhage exclusion sign at prostate MR imaging. The sign was present in approximately 20% of patients in whom postbiopsy changes were identified on T1-weighted images. The finding was highly reproducible, with very good interreader agreement (κ = 0.89). Although in isolation its PPV for detecting prostate cancer was relatively low (∼50%), when the hemorrhage exclusion sign was present in the same location as an area suspicious for tumor on T2-weighted images the PPV was close to 100%. In the only case where cancer was absent on the pathologic tumor map despite the presence of the hemorrhage exclusion sign on T1-weighted images and a corresponding area of low signal intensity suspicious for tumor on T2-weighted images, a benign hyperplastic nodule was identified at pathologic examination. Benign prostatic hyperplasia in the peripheral zone typically results from direct protrusion of the transition zone; however, a benign prostatic hyperplasia nodule that is spatially distinct from the transition zone, such as in this case, is rare—occurring in only 2% of all prostatectomy specimens (13).
Biopsy-induced changes in prostatic tissue hinder the ability of MR imaging to depict prostate cancer and have been reported in 28%–95% of patients in the literature (1,3,9). This wide variability is probably due to the fact that biopsies have a transient effect on prostatic tissue and, thus, the presence and extent of biopsy-related changes are directly related to the time between biopsy and imaging. In our study, in which the median time between biopsy and MR imaging was just over 2 months, we found that the prevalence of biopsy-related changes at MR imaging was approximately 65%, although in most of these cases it was subjectively considered mild. We also found a statistically significant correlation between the interval (in days) between prostate biopsy and MR imaging and the grade of hemorrhage and number of sextants containing postbiopsy hemorrhage in the peripheral zone (P < .001 for both readers). Given the prevalence of biopsy-related changes at prostate MR imaging, any imaging technique, evaluation approach, or sign that can improve the accuracy of prostate cancer detection at MR imaging would prove beneficial.
Previous studies have investigated the use of functional MR techniques to help differentiate biopsy-related change from tumor. Using diffusion-weighted MR imaging, Rosenkrantz et al (14) showed that the mean apparent diffusion coefficient of prostate cancer foci was significantly different from the mean apparent diffusion coefficient of hemorrhage in the peripheral zone, although there was a degree of overlap in apparent diffusion coefficients between the two groups. Spectroscopy has previously been shown to increase the accuracy of tumor detection in the presence of hemorrhage by 23% (3); however, more recent studies have not been performed. The T1 hemorrhage exclusion sign does not require functional imaging or additional sequences to be performed. Although the prevalence of the sign is relatively low, when present with concurrent homogeneous low signal intensity on T2-weighted images the PPV for prostate cancer is high and, as such, it represents a useful diagnostic adjunct.
Our study has some limitations, including its retrospective nature and the positive selection bias in selecting only patients who underwent surgery and subsequent whole-mount histologic examination. In addition, the time between biopsy and MR imaging was not controlled for. As such, the results and PPV are only pertinent to the selected study population of patients with biopsy-proved prostate cancer who are scheduled for prostatectomy. In addition, the use of axial T2-weighted images to interpret a sign seen on T1-weighted images has the potential to introduce diagnostic bias. However, the use of T2-weighted imaging was necessary to enable anatomic differentiation of the peripheral zone from the transition zone and, in some cases, periprosthetic fat from potential peripheral zone hemorrhage. Moreover, the two sequences are assessed as part of standard radiology practice, and the concurrent presence or absence of T2 changes was found to be essential for predicting the presence of tumor.
In summary, the presence of the hemorrhage exclusion sign at T1-weighted imaging with a corresponding area of low signal intensity at T2-weighted imaging is highly predictive for the presence of prostate cancer. Biopsy-related hemorrhage presents a problem for image interpretation, and the presence of the hemorrhage exclusion sign may prove useful in the small but significant percentage of patients in whom it is demonstrated.
Advances in Knowledge.
• According to two independent readers, the hemorrhage exclusion sign was present in 21.2% and 19.0% of patients with biopsy-related changes in the peripheral zone of the prostate.
• The presence of the hemorrhage exclusion sign on T1-weighted images with a corresponding area of homogeneous low signal intensity on T2-weighted images was strongly predictive of prostate cancer (positive predictive values of 95.7% and 94.7% for two independent readers).
• In cases where the hemorrhage exclusion sign was present but without a corresponding area of homogeneous low signal intensity on the T2-weighted images, no tumor was identified on the corresponding pathology maps.
• There was a statistically significant correlation between the time (in days) between prostate biopsy and MR imaging and both the grade of hemorrhage and the number of sextants containing postbiopsy changes in the peripheral zone.
Implication for Patient Care.
• Postbiopsy changes may hinder the identification of prostate cancer foci on T2-weighted images; however, the recognition of “excluded hemorrhage” in conjunction with a corresponding area of homogeneous low signal intensity on a T2-weighted image is highly accurate for cancer identification.
Disclosures of Potential Conflicts of Interest: T.B. No potential conflicts of interest to disclose. H.A.V. No potential conflicts of interest to disclose. O.A. No potential conflicts of interest to disclose. D.A.G. No potential conflicts of interest to disclose. H.H. No potential conflicts of interest to disclose.
Received October 18, 2011; revision requested November 21; revision received and accepted December 29; final version accepted January 6, 2012. H.A.V. receives research funding from the Peter Michael Foundation.
Current address: Department of Radiology, Addenbrooke’s Hospital and University of Cambridge, Cambridge, England.
Funding: This research was supported by the National Institutes of Health (grant R01 CA076423).
Abbreviations:
- PPV
- positive predictive value
- PSA
- prostate-specific antigen
References
- 1.White S, Hricak H, Forstner R, et al. Prostate cancer: effect of postbiopsy hemorrhage on interpretation of MR images. Radiology 1995;195(2):385–390 [DOI] [PubMed] [Google Scholar]
- 2.Bezzi M, Kressel HY, Allen KS, et al. Prostatic carcinoma: staging with MR imaging at 1.5 T. Radiology 1988;169(2):339–346 [DOI] [PubMed] [Google Scholar]
- 3.Kaji Y, Kurhanewicz J, Hricak H, et al. Localizing prostate cancer in the presence of postbiopsy changes on MR images: role of proton MR spectroscopic imaging. Radiology 1998;206(3):785–790 [DOI] [PubMed] [Google Scholar]
- 4.Qayyum A, Coakley FV, Lu Y, et al. Organ-confined prostate cancer: effect of prior transrectal biopsy on endorectal MRI and MR spectroscopic imaging. AJR Am J Roentgenol 2004;183(4):1079–1083 [DOI] [PubMed] [Google Scholar]
- 5.Ahmed HU, Kirkham A, Arya M, et al. Is it time to consider a role for MRI before prostate biopsy? Nat Rev Clin Oncol 2009;6(4):197–206 [DOI] [PubMed] [Google Scholar]
- 6.Keetch DW, Catalona WJ, Smith DS. Serial prostatic biopsies in men with persistently elevated serum prostate specific antigen values. J Urol 1994;151(6):1571–1574 [DOI] [PubMed] [Google Scholar]
- 7.Cabezas JS, Storme OA, Ramis C, Fruland BR, Kroll K, Larson TR. Initial human feasibility study of DC ablation as a treatment for benign prostatic hyperplasia: 6 month follow-up data. Conf Proc IEEE Eng Med Biol Soc 2010;2010:1609–1613 [DOI] [PubMed] [Google Scholar]
- 8.Callea A, Piccinni R, Zizzi V, et al. High-intensity focused ultrasound (HIFU) in prostate cancer: a single centre experience in patients with low, intermediate or high-risk of progression. Arch Ital Urol Androl 2010;82(4):253–255 [PubMed] [Google Scholar]
- 9.Tamada T, Sone T, Jo Y, et al. Prostate cancer: relationships between postbiopsy hemorrhage and tumor detectability at MR diagnosis. Radiology 2008;248(2):531–539 [DOI] [PubMed] [Google Scholar]
- 10.Janssen MJ, Huijgens PC, Bouman AA, Oe PL, Donker AJ, van der Meulen J. Citrate versus heparin anticoagulation in chronic haemodialysis patients. Nephrol Dial Transplant 1993;8(11):1228–1233 [PubMed] [Google Scholar]
- 11.Zakian KL, Shukla-Dave A, Ackerstaff E, Hricak H, Koutcher JA. 1H magnetic resonance spectroscopy of prostate cancer: biomarkers for tumor characterization. Cancer Biomark 2008;4(4-5):263–276 [DOI] [PubMed] [Google Scholar]
- 12.Katz S, Rosen M. MR imaging and MR spectroscopy in prostate cancer management. Radiol Clin North Am 2006;44(5):723–734, viii [DOI] [PubMed] [Google Scholar]
- 13.Egawa S, Ohori M, Uchida T, Mashimo S, Kuwao S. Nodular hyperplasia in the peripheral zone of the prostate gland. Br J Urol 1994;74(4):520–521 [DOI] [PubMed] [Google Scholar]
- 14.Rosenkrantz AB, Kopec M, Kong X, et al. Prostate cancer vs. post-biopsy hemorrhage: diagnosis with T2- and diffusion-weighted imaging. J Magn Reson Imaging 2010;31(6):1387–1394 [DOI] [PubMed] [Google Scholar]