

MR imaging findings are a stronger predictor of pathologic response after neoadjuvant chemotherapy than clinical assessment, with the greatest advantage observed with the use of volumetric measurement of tumor response early in treatment.
Abstract
Purpose:
To compare magnetic resonance (MR) imaging findings and clinical assessment for prediction of pathologic response to neoadjuvant chemotherapy (NACT) in patients with stage II or III breast cancer.
Materials and Methods:
The HIPAA-compliant protocol and the informed consent process were approved by the American College of Radiology Institutional Review Board and local-site institutional review boards. Women with invasive breast cancer of 3 cm or greater undergoing NACT with an anthracycline-based regimen, with or without a taxane, were enrolled between May 2002 and March 2006. MR imaging was performed before NACT (first examination), after one cycle of anthracyline-based treatment (second examination), between the anthracycline-based regimen and taxane (third examination), and after all chemotherapy and prior to surgery (fourth examination). MR imaging assessment included measurements of tumor longest diameter and volume and peak signal enhancement ratio. Clinical size was also recorded at each time point. Change in clinical and MR imaging predictor variables were compared for the ability to predict pathologic complete response (pCR) and residual cancer burden (RCB). Univariate and multivariate random-effects logistic regression models were used to characterize the ability of tumor response measurements to predict pathologic outcome, with area under the receiver operating characteristic curve (AUC) used as a summary statistic.
Results:
Data in 216 women (age range, 26–68 years) with two or more imaging time points were analyzed. For prediction of both pCR and RCB, MR imaging size measurements were superior to clinical examination at all time points, with tumor volume change showing the greatest relative benefit at the second MR imaging examination. AUC differences between MR imaging volume and clinical size predictors at the early, mid-, and posttreatment time points, respectively, were 0.14, 0.09, and 0.02 for prediction of pCR and 0.09, 0.07, and 0.05 for prediction of RCB. In multivariate analysis, the AUC for predicting pCR at the second imaging examination increased from 0.70 for volume alone to 0.73 when all four predictor variables were used. Additional predictive value was gained with adjustments for age and race.
Conclusion:
MR imaging findings are a stronger predictor of pathologic response to NACT than clinical assessment, with the greatest advantage observed with the use of volumetric measurement of tumor response early in treatment.
© RSNA, 2012
Introduction
Systemic chemotherapy is used to treat women with invasive breast cancer to reduce the risk of recurrence after surgery. Clinical trials comparing neoadjuvant and adjuvant chemotherapy have shown equivalent relapse-free and overall survival outcomes between the two groups. However, women receiving neoadjuvant chemotherapy (NACT) were more likely to achieve breast conservation than those receiving chemotherapy after surgery (1,2). Change in size of the primary tumor in response to chemotherapy in the neoadjuvant setting was positively associated with disease-free and overall survival. Thus, primary tumor response monitoring has predictive value and has led to greater use of chemotherapy in the neoadjuvant setting for women with breast cancer.
Contrast material–enhanced magnetic resonance (MR) imaging has been shown to better demonstrate cancer extent than traditional mammography or ultrasonography (US) in multiple studies (3–8). Because MR imaging primarily helps detect breast cancer by demonstrating contrast enhancement associated with tumor angiogenesis, it provides insight into tumor physiology and could provide an earlier and more accurate marker of tumor response than anatomic imaging or clinical breast examination.
As a companion study to Cancer and Leukemia Group B (CALGB) 150007, American College of Radiology Imaging Network (ACRIN) 6657 was conducted as the imaging component of the multicenter Investigation of Serial Studies to Predict Your Therapeutic Response with Imaging And moLecular Analysis (I-SPY TRIAL) breast cancer trial, a study of imaging- and tissue-based biomarkers for predicting response and survival. ACRIN 6657 was designed as a prospective study to test MR imaging for its ability to help predict response to treatment and stratify the risk of recurrence in patients with stage II or III breast cancer receiving NACT. The purpose of our study was to compare MR imaging and clinical assessment for prediction of pathologic response following NACT.
Materials and Methods
Participant Eligibility and Enrollment
Patients enrolling in CALGB 150007 who had T3 tumors that measured at least 3 cm in diameter at clinical examination or imaging and who were receiving NACT with an anthracycline-cyclophosphamide regimen alone or followed by a taxane were eligible for this study. Pregnant patients and those with ferromagnetic prostheses were excluded from the study. The study was open to enrollment from May 2002 to March 2006. Participation in both the ACRIN 6657 imaging study and the CALGB 150007 biomarker study were a requirement of the I-SPY TRIAL, and patients signed a single consent form. The Health Insurance Portability and Accountability Act–compliant protocol and the informed consent process were approved by the American College of Radiology Institutional Review Board and local-site institutional review boards. Patients were screened for eligibility, consented, and enrolled through CALGB 150007 and then registered to ACRIN 6657 (9). The imaging findings have not previously been reported.
Imaging Procedures
MR imaging examinations were performed within 4 weeks prior to the start of anthracycline-cyclophosphamide chemotherapy (first examination), at least 2 weeks after the first cycle and prior to the second cycle of anthracycline-cyclophosphamide chemotherapy (second examination), between anthracycline-cyclophosphamide treatment and taxane therapy if taxane was administered (third examination), and after the final chemotherapy treatment and prior to surgery (fourth examination).
MR imaging was performed with a 1.5-T imaging unit by using a dedicated breast radiofrequency coil. Prior to the start of imaging, an intravenous catheter was inserted into each patient; patients were imaged in the prone position. The MR imaging protocol included a localization acquisition and a T2-weighted sequence, followed by a dynamic contrast-enhanced series. For T2-weighted imaging, a fast spin-echo sequence with fat suppression was used in the sagittal orientation over the symptomatic breast only (two-dimensional spin echo; field of view, 16–20 cm; section thickness, 3 mm; fat saturation; echo train length, eight to 16; one echo; effective echo time, 80–140 msec; repetition time, 4000–6000 msec). For the contrast-enhanced series, high-spatial-resolution (in-plane spatial resolution, ≤1 mm) three-dimensional fat-suppressed T1-weighted imaging of the symptomatic breast was performed by using a gradient-echo sequence with a repetition time of 20 msec or less, an echo time of 4.5 msec, a flip angle of 45° or less, a 16–18-cm field of view, a minimum matrix of 256 × 192, and 64 sections with a thickness of 2.5 mm or less.
Imaging time for the T1-weighted sequence was required to be between 4.5 and 5 minutes, with one data set acquired before injection of a gadolinium-based contrast agent and repeated at least two times immediately after injection. The resulting temporal sampling of the center of k-space for the first contrast-enhanced phase was between 2 minutes 15 seconds and 2 minutes 30 seconds, providing image contrast most representative of this time point. An interphase delay between the first and the second contrast-enhanced phase was used as needed to result in temporal sampling of the second contrast-enhanced phase between 7 minutes 15 seconds and 7 minutes 45 seconds. Mammography was performed at baseline and presurgical time points only; mammographic results were therefore not included in this analysis. Mammograms were interpreted by the site radiologist according to the American College of Radiology Breast Imaging Reporting and Data System lexicon for subsequent analysis (10).
Clinical Size and Response Assessment
Clinical tumor size and clinical response category were assessed separately at each time point. Physical examination included the recording of tumor size in centimeters (measured in one dimension), as well as tumor location (distance in centimeters from the center of the nipple), and clock position. Change in clinical size was recorded as the largest change in a single dimension of the tumor. Clinical response categories were defined as follows: Complete response involved disappearance of all lesions; partial response, at least a 30% decrease in the longest diameter (LD) of the primary tumor; stable disease, neither partial response nor progressive disease; and progressive disease, at least a 20% increase in the LD of the primary tumor.
Histopathologic Analysis
Histopathologic analysis of surgical specimens was performed locally by each institution’s pathologist as specified in the I-SPY TRIAL protocol (11). Pathologic complete responses (pCRs) were reported when no residual invasive disease was present. Residual disease size was measured and reported for invasive and noninvasive components. Total extent of residual disease, measured as the greatest two-dimensional extent of residual invasive cancer inclusive of intervening areas of fibrosis or necrosis, was also reported. A centralized group of trained pathologists subsequently re-reviewed study pathology reports and slides to estimate residual cancer burden (RCB), a composite pathologic index that considers tumor size, cancer cell density, and lymph node involvement (12). RCB is a more refined pathologic measurement of residual tumor burden that appears to have better ability than pCR to discriminate response (13). RCB was measured on a continuous scale and further categorized as 0, I, II, or III according to the method described by Symmans et al (12). Responders were categorized as having an RCB index of 0 or I, while nonresponders had an RCB index of II or III. For this analysis, in which MR imaging measurements were limited to the primary cancer, MR imaging findings were also compared with only the “in-breast” component of RCB, adapted from the Symmans method to include only the tumor size and cancer cell density components of the RCB measurement. The centralized pathology review for RCB assessment resulted in revised pathologic residual disease size measurements in a subset of cases.
Image Assessment and Volumetric Analysis
Deindentified image data were centrally archived at the American College of Radiology Imaging Core Laboratory. Image evaluation included both radiologic interpretation and quantitative image analysis. Image interpretation was performed at each site by either a breast radiologist (seven sites) or MR imaging scientist (two sites), all with 3 or more years of experience in interpreting breast MR images consistent with the standard Breast Imaging Reporting and Data System MR imaging lexicon (10). Radiologic interpretation of MR images included assessment of lesion size, shape, extent, distribution, and kinetics, as well as other characteristics, including breast density, T2 appearance, and morphologic pattern. LD was measured as the greatest extent of disease, including intervening areas of nonenhancing tissue, on baseline MR images. The same measurement direction was used for all subsequent MR imaging examinations. Staff members of the breast MR imaging laboratory at the University of California at San Francisco performed the quantitative analysis of all MR image data. Contrast-enhanced images were analyzed by using the signal enhancement ratio (SER) method with a voxel-based comparison of early and late contrast enhancement (14). The primary quantitative measurement was an estimate of tumor volume, computed as the sum of voxels meeting thresholds for initial percentage enhancement (PE), defined as PE = [(S1 − S0)/S0] · 100%, and SER, defined as SER = (S1 − S0)/(S2 − S0), where S0, S1, and S2 represent the signal intensities on the precontrast, early postcontrast, and late postcontrast images, respectively. Tumor volume was computed by summing all voxels with percentage enhancement above a nominal threshold value of 70%; site-specific adjustments to this threshold were necessary to account for variability in MR imaging systems and imaging parameters. Automated assessment of tumor hot spot measured the peak SER, determined by searching the entire tumor volume for the greatest mean SER of a connected eight-pixel region. Nonanalyzable cases included those in which voxel-based SER analysis could not be performed because of an insufficient number of postcontrast time points, image misregistration, or poor image quality.
Statistical Analysis
Statistical analyses were performed at the ACRIN Biostatistics and Data Management Center at Brown University. The analyses characterized the ability of four measurements of tumor response (changes in longest dimension, volume, and SER at MR imaging and clinical size) to predict pathologic outcome defined by pCR and both the total and in-breast RCB categories. Each predictor variable was measured at the four time points. Outcomes of interest (pathologic response, RCB category) were collected on their natural continuous or ordinal scale and then dichotomized later. Imaging markers obtained at the first and second MR imaging examinations were of particular interest to predict eventual treatment response.
Summary tables and simple frequencies were used to describe the data and check for outliers and influential observations. Data were cleaned and queried according to standard operating procedures developed by ACRIN Data Management. Scatterplots, boxplots, and q-plots were used to examine and display the data. Missing data elements were determined to lead to negligible differences in the analysis.
For every predictor-outcome pair at each measurement time point, a univariate random-effects logistic regression model was first fit (random effects were assumed to follow a normal distribution). The response for this model was the dichotomized outcome of interest (pCR, RCB). The predictor was defined as the change (ratio) from baseline for each time point. A random effect for site was used to account for site-to-site variation; no other variables were included in this univariate model. All available data were used to fit each model; thus, the number of cases varied dependent on predictor-outcome pair owing to variation in number of missing data by time point. This process was repeated for each time point. The random-effects model was expanded to include all predictors of interest to characterize the combined predictive ability of these markers. The multivariate model was adjusted for race and age as specified in the original analysis plan (age was modeled with a restricted cubic spline). Only main effects were considered for three reasons: (a) This model was postulated during the design stage, (b) a more parsimonious model was desired that could be validated on other data sets, and (c) the amount of data were appropriate for a model with 10 or fewer covariates, with the rule of thumb that 15–20 events per covariate is needed for a well-fit model (15).
For each regression model, the area under the receiver operating characteristic curve (AUC) for each predictor was obtained and used as a summary measure of the diagnostic accuracy of the model. The 95% confidence interval (CI) for the AUC was calculated according to the method of DeLong et al (16). The AUC, rather than the coefficients (ie, odds ratios) from the model, was of interest, as the goal was to determine how accurately these predictors performed for the outcomes of interest. Statistical software (SAS, version 9.0, SAS Institute, Cary, NC; Stata, version 9.0, Stata, College Station, Tex; and S-PLUS, version 7.0, Insightful, Seattle, Wash) were used to process the data and facilitate statistical analyses. All CIs are reported at the 95% level. P ≤ .05 was considered to indicate a statistically significant difference.
Results
Patient Characteristics
Two hundred thirty-seven patients were enrolled, with seven patients subsequently found to be ineligible because of either medical contraindication (n = 5) or ineligible medical history (n = 2), as per the I-SPY TRIAL protocol. An additional 14 patients were not included in the imaging analysis owing to the following kinds of incomplete imaging data: no LD acquired at baseline MR imaging (n = 5), LD acquired only at baseline MR imaging (n = 5), or volume reported only for baseline MR imaging (n = 4). This analysis included 216 women with imaging and pathologic evaluation data.
Table 1 includes the characteristics of all eligible patients (n = 230) and those included in the analysis (n = 216). The median patient age in both groups was 49 years (range, 26–68 years). The racial distribution in the analysis set was approximately 75% white, 19% African-American, 4% Asian, and 2% of other or unknown race. Four percent of eligible patients were of Hispanic or Latino ethnicity.
Table 1.
Patient Characteristics
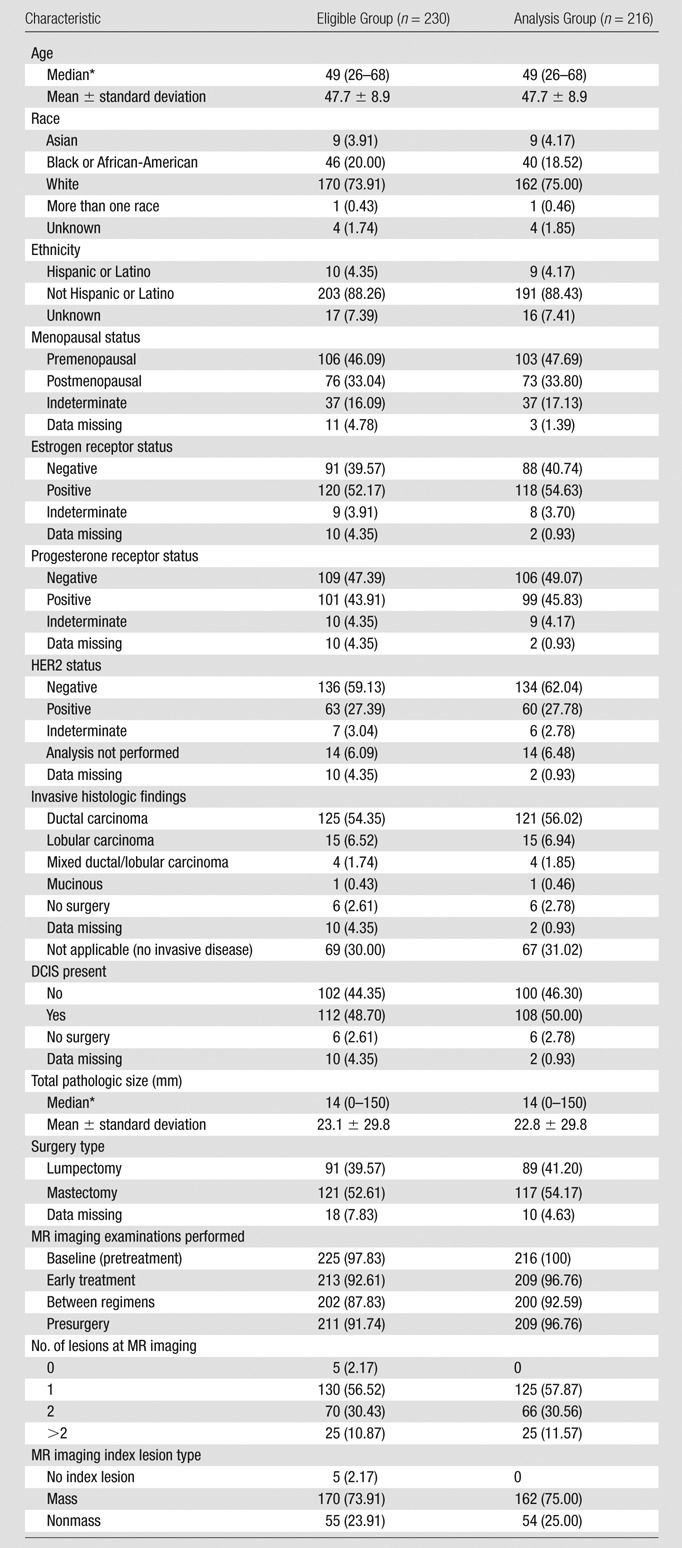
Note.—Unless otherwise specified, data are numbers of patients, with percentages in parentheses. DCIS = ductal carcinoma in situ. HER2 = human epidermal growth factor receptor 2.
Data in parentheses are ranges.
Ninety-eight percent (n = 225) of eligible patients underwent baseline examinations (first examinations). Patients returned for subsequent examinations in 93% of cases for the second examination (n = 213), 88% of cases for the third examination (n = 202), and 92% of cases for the fourth examination (n = 211). For the analysis subset, the numbers of examinations according to each measurement method available for analysis at each of the four time points are given in Table 2.
Table 2.
Measurements Available for Analysis in 216 Patients
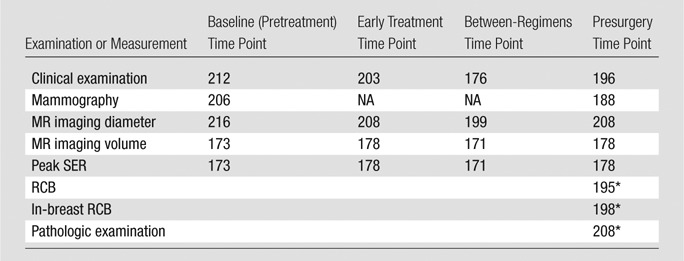
Note.—NA = not applicable.
Both RCB determination and pathologic examination were performed after surgery.
Clinical and Pathologic Outcomes
Data collected for clinical and pathologic response (pCR, RCB) are shown in Table 3 and are presented in Table 4 in dichotomized form. At completion of all chemotherapy, 41%, 42%, 8%, and 3% of patients in the analysis set showed a clinical complete response, partial response, stable disease, and progressive disease, respectively. Data on clinical response were not reported at the time of analysis for about 6% of patients. At the time of surgery, 26% of patients in the analysis set demonstrated pCR. Thirty-two percent of patients in the analysis set were responders according to RCB. For the 208 patients in whom pathologic size data were available, the mean size of residual disease was 23 mm (range, 0–150 mm) (Table 1). Residual disease included DCIS in 50% of cases.
Table 3.
Response Categories
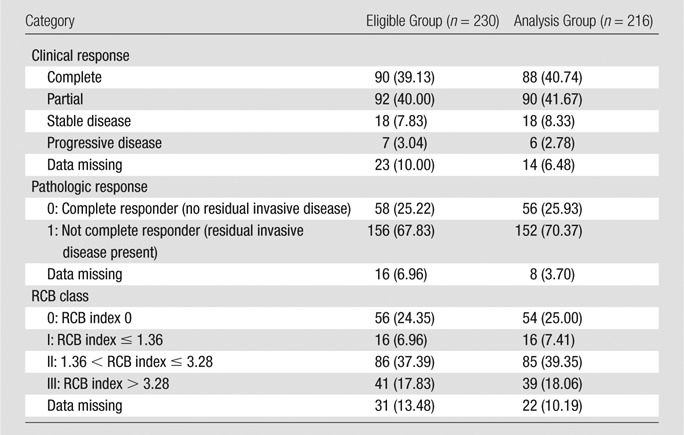
Note.—Data are numbers of patients, with percentages in parentheses.
Table 4.
Dichotomous Response Categories
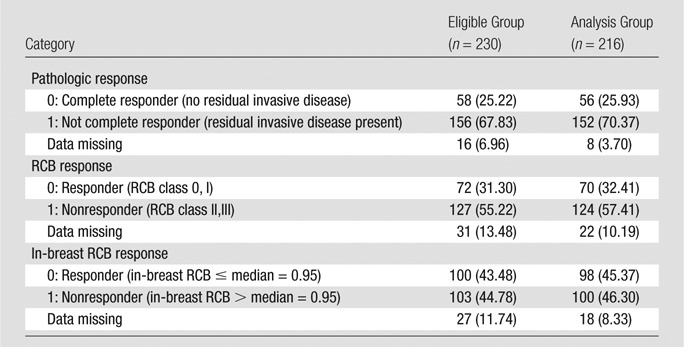
Note.—Data are numbers of patients, with percentages in parentheses.
Response Prediction
For each pathologic response outcome, AUCs for the four predictive variables are also shown plotted for change at the second, third, and fourth examinations in Figures 1–3. Higher AUCs were found for MR imaging size predictors (LD and volume) than for clinical size at all measurement time points and for all pathologic outcomes (Table 5). SER performance was lower than that of clinical size in one instance (prediction of RCB at the second examination). Volume AUC was higher than all other predictor variables at the second examination, with decreasing advantage over other predictive variables at subsequent time points. LD at MR imaging was a better predictor of pCR at the fourth examination (Fig 1). The highest overall AUC at univariate analysis (0.79) was measured for volume prediction at the fourth exami-nation of the in-breast RCB component (Fig 3).
Figure 1:

Graph shows AUCs for prediction of pCR for the four predictor variables at the early treatment, between regimens, and presurgery time points. Predictors are expressed as the ratio of value at each time point to baseline value for tumor LD (green), volume (orange), SER (blue), and clinical size (red). Solid squares = P ≤ .05.
Figure 3:

Graph shows AUCs for prediction of the in-breast RCB component for the four predictor variables at the early treatment, between regimens, and presurgery time points. Predictors are expressed as the ratio of value at each time point to baseline value for tumor LD (green), volume (orange), SER (blue), and clinical size (red). Solid squares = P ≤ .05.
Table 5.
AUC Results
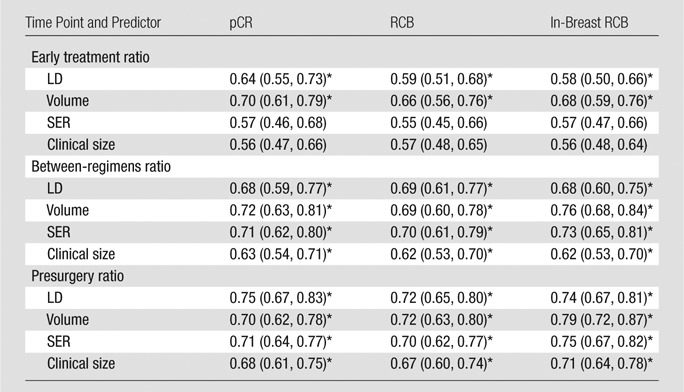
Note.—Data are AUCs, with 95% CIs in parentheses. For pCR, the dichotomy was 0 versus 1, for RCB it was RCB classes 0 and I versus II and III, and for in-breast RCB it was the median cutoff.
P < .05 for testing that AUC = 0.5.
Figure 2:

Graph shows AUCs for prediction of RCB for the four predictor variables at the early treatment, between regimens, and presurgery time points. Predictors are expressed as the ratio of value at each time point to baseline value for tumor LD (green), volume (orange), SER (blue), and clinical size (red). Solid squares = P ≤ .05.
Multivariate analysis generally resulted in higher AUCs than those for individual predictors at univariate analysis, with further increases when age and race were considered (Table 6). For example, the early treatment time point yielded multivariate models adjusted for age and race that had AUCs generally between 0.71 and 0.75, which are higher than AUCs at univariate analysis of individual predictors. As a first-order approximation, the lower limits of the AUC CIs were higher for the multivariate models than for the univariate models, indicating that the predictive ability of the multivariate models was stronger.
Table 6.
Multivariate Logistic Regression Models
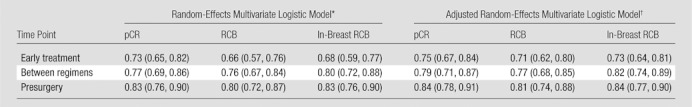
Note.—Data are AUCs, with 95% CIs in parentheses. For all values, P < .05 for testing that AUC = 0.5. For each of the measurements used as predictors, the ratios from baseline were applied to evaluate change. For pCR, the dichotomy was 0 versus 1, for RCB it was RCB classes 0 and I versus II and III, and for in-breast RCB it was the median cutoff.
In this model, predictors were LD, volume, SER, and clinical size ratios, while the random effect was site.
Adjusted for age (with cubic spline) and race.
Discussion
ACRIN 6657 is evaluating MR imaging for measuring response of primary breast cancer to chemotherapy, to determine the benefit of MR imaging relative to clinical assessment for prediction of response and risk of recurrence. These results compared estimates of tumor size derived from clinical and MR imaging data for predicting response as determined by residual disease at the time of surgical resection. Consistent with current Response Evaluation Criteria in Solid Tumors guidelines, unidimensional tumor diameter was measured with both MR imaging and clinical assessment. In addition, a volumetric estimate of tumor size was made on the basis of functional criteria applied to contrast-enhanced images. The tumor volume measurement is an aggregate of all tissue that met criteria for signal enhancement and was dependent on parameters of the image acquisition, including timing relative to contrast agent injection and physiologic conditions affecting the circulation and distribution of the contrast agent. Hence, MR imaging tumor volume is a functional measurement reflecting both the size and the microvascular properties of tissue and may differ from the actual tumor volume. These automated functional volume measurements have greater sensitivity than linear measurements for capturing early changes predicting treatment response.
ACRIN 6657 is the largest multicenter trial to date utilizing MR imaging to measure treatment response in primary breast cancers. As a companion trial opened under the I-SPY TRIAL, ACRIN 6657 used a standardized breast MR imaging method at nine institutions. Several considerations determined the selection of the image acquisition approach, including the need to standardize the approach across different system platforms at multiple institutions and the necessary image quality requirements for clinical interpretation. During the time frame of this study, these requirements precluded the short imaging times typically recommended for dynamic contrast-enhanced MR imaging techniques employing pharmacokinetic analysis (17,18). The contrast-enhanced method was compatible with standard clinical breast MR imaging and balanced image quality and resolution requirements with a three-time-point approach to obtain a low-temporal-resolution assessment of contrast enhancement dynamics (14). The temporal resolution used in this study was longer than the current American College of Radiology recommendations. The subsequent study, performed under a 6657 protocol amendment and in analysis under the I-SPY TRIAL, used temporal sampling that meets the current American College of Radiology guidelines.
AUC was used as an overall summary of predictive power to compare alternative measurements of tumor response, as determined by pCR and RCB. AUC estimates using tumor volume change were superior to clinical examination at all time points. The greatest difference in predictive ability occurred at the early time point. This finding supports the hypothesis that volumetric assessment is a more accurate measurement of tumor burden than diameter and enables earlier detection of treatment response.
When all four variables were considered in multivariate analysis, the AUC for predicting pCR at the early time point increased from 0.70 for volume alone to 0.73, indicating that combined MR imaging and clinical examination were beneficial. Additional predictive value was gained when the model was adjusted for age and race, increasing further to 0.75 for the early time point.
At the presurgery time point, the multivariate AUC estimate in the adjusted model was 0.84, with the lower confidence boundary at 0.78. This reflects a high degree of accuracy of MR imaging in combination with clinical examination for predicting pCR. Because pCR is an imperfect surrogate end point for survival, particularly in populations that combine all tumor subtypes, the ACRIN 6657 comparison of tumor volume change and pCR for predicting 3-year recurrence-free survival may provide more information about the utility of MR imaging for response assessment. These data are currently being collected and analyzed.
Differences in the imaging and pathologic methods for measuring disease extent were recognized and would result in an imperfect model for any prediction or correlation. While MR imaging depicts the enhancing areas of tumors, the volumetric assessment measures only the tumor portion that meets predetermined enhancement thresholds, including both invasive and noninvasive disease. pCR is based on the absence of invasive disease, and therefore, patients with residual DCIS are still considered to have pCR. RCB measurements made in gross specimens can miss the presence of DCIS that falls outside the invasive tumor bed. These differences may contribute to the only moderate AUCs in this study.
Tumor hot spot measurement using the peak SER was less effective than volume at the second examination but showed equal predictive ability to volume at the third- and fourth-examination time points. The reason for lower performance at the second examination remains unclear, but may involve the timing of the MR imaging examination. At 2 weeks after the first chemotherapy administration, the acute effects of treatment have subsided and MR imaging measurements reflect only persistent changes. Continuing studies under the 6657 protocol extension include single-voxel MR spectroscopy measurement of choline and tumor volume measurements in an earlier and more-narrow window following treatment and may offer insight into this potential effect.
As discussed, this study used a low-temporal-resolution dynamic contrast-enhanced approach that precluded the use of pharmacokinetic modeling. A limitation of our study was that the SER metric used to define tumor volume is likely suboptimal to the more physiologically interpretable estimates of the rate constant and blood volume derivable from pharmacokinetic modeling. Dynamic contrast-enhanced protocols with higher temporal resolution are becoming more readily available on commercial imaging units and will allow more advanced dynamic contrast-enhanced methods to be implemented in standardized conditions in breast cancer clinical trials. However, standardization of quantitative imaging in general remains a challenge. While compliance with MR imaging examinations in this study was very good, 131 (16%) of the total 831 MR imaging studies performed could not be analyzed to measure tumor volume because of poor image quality, motion artifact, or insufficient postcontrast imaging. This failure rate may be unreasonably high if tumor volume is to be applied prospectively as a predictive biomarker. This limitation can be addressed with increased training and continuous quality monitoring.
Continuing analysis will address the ACRIN 6657 trial’s primary aim to determine the ability of MR imaging–based measurements to predict 3-year recurrence-free survival, relative to clinical and pathologic response measures. The major question to be answered is how MR imaging measurements compare with pCR and RCB as intermediate end points for survival, particularly among the subgroups of patients with high-risk molecular signatures. Data emerging from the I-SPY TRIAL provide important evidence that recurrence risk varies substantially among tumor subtypes (10). Further analysis will explore imaging phenotypes associated with the molecular and genetic profiles of high- and low-risk breast cancers.
Advances in Knowledge.
• For prediction of pathologic response following neoadjuvant chemotherapy, change in breast tumor size measured at MR imaging is superior to clinical assessment; areas under the receiver operating characteristic curve (AUCs) for MR imaging and clinical size were 0.75 and 0.68, respectively, for prediction of pathologic complete response (pCR).
• Among MR imaging size measurements early in treatment, volume estimates are superior to diameter estimates for predicting pathologic outcomes; AUCs for MR imaging volume and longest diameter were 0.70 and 0.64, respectively, for prediction of pCR.
• For prediction of pCR, the greatest relative advantage in predictive ability occurs early in treatment; the difference in AUC between MR imaging volume and clinical size predictors at the early, mid-, and posttreatment time points was 0.14, 0.09, and 0.02, respectively, for prediction of pCR.
• When adjusted for age and race, the highest predictive value of 0.84 was obtained by using a multivariate model that included both MR imaging and clinical measurements.
Implications for Patient Care.
• Early assessment of treatment response on the basis of MR imaging findings may warrant changes in treatment planning, leading to better clinical outcomes.
• With excellent patient compliance in terms of the imaging examinations over the course of this investigation, our study suggests that serial MR imaging examinations can be used effectively to monitor response to treatment.
Disclosures of Potential Conflicts of Interest: N.M.H. Financial activities related to the present article: none to disclose. Financial activities not related to the present article: institution has received a research support grant from Sentinelle Medical. Other relationships: none to disclose. J.D.B. No potential conflicts of interest to disclose. W.K.B. No potential conflicts of interest to disclose. E.D.P. Financial activities related to the present article: none to disclose. Financial activities not related to the present article: is an uncompensated board or advisory board member of NextRay, MiCo, ACR Image Metrix, and Zumatek; institution receives money for consultancy from GE Healthcare, Konica-Minolta, VuComp, and Sectra and has grants or grants pending with Imaging Diagnostic Systems, GE Healthcare, Naviscan PET Systems, Konica-Minolta, DOBI Systems, VuComp, Sectra, Zumatek, Xintek, and MiCo; has patents licensed to NextRay but receives no income; holds stock or stock options in NextRay that have no value at present; institution has received equipment loans from Fischer, GE Healthcare, Fuji, Hologic, Sectra, Kodak (Carestream), and iCAD. Other relationships: has served as an unpaid consultant to GE, Sectra, and other companies in the past. M.A.R. No potential conflicts of interest to disclose. E.A.M. No potential conflicts of interest to disclose. P.T.W. Financial activities related to the present article: none to disclose. Financial activities not related to the present article: receives money, and institution receives money, for consultancy from Ultrashape; is on speakers bureau of the Institute for Advanced Medical Education. Other relationships: none to disclose. C.D.L. Financial activities related to the present article: none to disclose. Financial activities not related to the present article: is a consultant for Philips, Bayer, and GE; institution has grants or grants pending with GE; is on the speakers bureau of GE; has received payment from GE for development of educational presentations. Other relationships: none to disclose. G.M.N. Financial activities related to the present article: institution has received a grant from Philips Healthcare; has received a consulting fee or honorarium from the Institute for Advanced Medical Education. Financial activities not related to the present article: is a consultant on the medical advisory board of Bayer; institutions has research agreement grants or grants pending with Philips Healthcare; receives royalties from KRL University of Chicago; spouse is a minor stockholder in Hologic. Other relationships: none to disclose. S.P. No potential conflicts of interest to disclose. H.S.M. No potential conflicts of interest to disclose. L.J.E. No potential conflicts of interest to disclose. M.D.S. Financial activities related to the present article: none to disclose. Financial activities not related to the present article: is a member of the board of Ontario Cancer Research Institute; institution has grants or grants pending with Siemens Medical Solutions; receives royalties from MedRad. Other relationships: none to disclose.
Acknowledgments
The authors acknowledge those individuals who have contributed substantially to the work reported in the manuscript, including the ACRIN 6657 Trial Team, the I-SPY TRIAL Investigators Network, the patients who participated in the study, and the staff members who contributed to the conduct of the study at the University of California at San Francisco, the University of Pennsylvania, the University of North Carolina at Chapel Hill, Georgetown University, the University of Alabama, Memorial Sloan-Kettering Cancer Center, the University of Texas Southwestern, the University of Washington, and the University of Chicago. The authors also gratefully acknowledge Savannah Partridge, PhD, Jessica Gibbs, BS, and David Newitt, PhD, at the University of California San Francisco breast MR imaging laboratory for performing the image analysis. The authors also thank Darryl Z. L’Heureux, PhD, for his contributions to this manuscript.
Received April 22, 2011; revision requested May 20; revision received November 8; accepted November 16; final version accepted January 20, 2012.
Funding: This research was supported by the National Cancer Institute (grants U01 CA079778 and U01 CA080098).
Abbreviations:
- ACRIN
- American College of Radiology Imaging Network
- AUC
- area under the receiver operating characteristic curve
- CALGB
- Cancer and Leukemia Group B
- CI
- confidence interval
- DCIS
- ductal carcinoma in situ
- I-SPY TRIAL
- Investigation of Serial Studies to Predict Your Therapeutic Response with Imaging And moLecular Analysis
- LD
- longest diameter
- NACT
- neoadjuvant chemotherapy
- pCR
- pathologic complete response
- RCB
- residual cancer burden
- SER
- signal enhancement ratio
References
- 1.Fisher B, Bryant J, Wolmark N, et al. Effect of preoperative chemotherapy on the outcome of women with operable breast cancer. J Clin Oncol 1998;16(8):2672–2685 [DOI] [PubMed] [Google Scholar]
- 2.Wolmark N, Wang J, Mamounas E, Bryant J, Fisher B. Preoperative chemotherapy in patients with operable breast cancer: nine-year results from National Surgical Adjuvant Breast and Bowel Project B-18. J Natl Cancer Inst Monogr 2001;(30):96–102 [DOI] [PubMed] [Google Scholar]
- 3.Esserman L, Hylton N, Yassa L, Barclay J, Frankel S, Sickles E. Utility of magnetic resonance imaging in the management of breast cancer: evidence for improved preoperative staging. J Clin Oncol 1999;17(1):110–119 [DOI] [PubMed] [Google Scholar]
- 4.Weatherall PT, Evans GF, Metzger GJ, Saborrian MH, Leitch AM. MRI vs. histologic measurement of breast cancer following chemotherapy: comparison with x-ray mammography and palpation. J Magn Reson Imaging 2001;13(6):868–875 [DOI] [PubMed] [Google Scholar]
- 5.Schnall MD, Blume J, Bluemke DA, et al. MRI detection of distinct incidental cancer in women with primary breast cancer studied in IBMC 6883. J Surg Oncol 2005;92(1):32–38 [DOI] [PubMed] [Google Scholar]
- 6.Van Goethem M, Schelfout K, Dijckmans L, et al. MR mammography in the pre-operative staging of breast cancer in patients with dense breast tissue: comparison with mammography and ultrasound. Eur Radiol 2004;14(5):809–816 [DOI] [PubMed] [Google Scholar]
- 7.Berg WA, Gutierrez L, NessAiver MS, et al. Diagnostic accuracy of mammography, clinical examination, US, and MR imaging in preoperative assessment of breast cancer. Radiology 2004;233(3):830–849 [DOI] [PubMed] [Google Scholar]
- 8.Hollingsworth AB, Stough RG, O’Dell CA, Brekke CE. Breast magnetic resonance imaging for preoperative locoregional staging. Am J Surg 2008;196(3):389–397 [DOI] [PubMed] [Google Scholar]
- 9.Esserman LJ, Berry DA, Cheang MC, et al. Chemotherapy response and recurrence-free survival in neoadjuvant breast cancer depends on biomarker profiles: results from the I-SPY 1 TRIAL (CALGB 150007/150012; ACRIN 6657). Breast Cancer Res Treat 2011 Dec 25. [Epub ahead of print] [DOI] [PMC free article] [PubMed] [Google Scholar]
- 10.American College of Radiology Breast imaging reporting and data system atlas: MRI. Reston, Va: American College of Radiology, 2003 [Google Scholar]
- 11.Barker AD, Sigman CC, Kelloff GJ, Hylton NM, Berry DA, Esserman LJ. I-SPY 2: an adaptive breast cancer trial design in the setting of neoadjuvant chemotherapy. Clin Pharmacol Ther 2009;86(1):97–100 [DOI] [PubMed] [Google Scholar]
- 12.Symmans WF, Peintinger F, Hatzis C, et al. Measurement of residual breast cancer burden to predict survival after neoadjuvant chemotherapy. J Clin Oncol 2007;25(28):4414–4422 [DOI] [PubMed] [Google Scholar]
- 13.Nahleh Z, Sivasubramaniam D, Dhaliwal S, Sundarajan V, Komrokji R. Residual cancer burden in locally advanced breast cancer: a superior tool. Curr Oncol 2008;15(6):271–278 [DOI] [PMC free article] [PubMed] [Google Scholar]
- 14.Hylton NM. Vascularity assessment of breast lesions with gadolinium-enhanced MR imaging. Magn Reson Imaging Clin N Am 1999;7(2):411–420, x [PubMed] [Google Scholar]
- 15.Harrell FE. Regression modeling strategies. New York, NY: Springer, 2001 [Google Scholar]
- 16.DeLong ER, DeLong DM, Clarke-Pearson DL. Comparing the areas under two or more correlated receiver operating characteristic curves: a nonparametric approach. Biometrics 1988;44(3):837–845 [PubMed] [Google Scholar]
- 17.Henderson E, Rutt BK, Lee TY. Temporal sampling requirements for the tracer kinetics modeling of breast disease. Magn Reson Imaging 1998;16(9):1057–1073 [DOI] [PubMed] [Google Scholar]
- 18.Planey CR, Welch EB, Xu L, et al. Temporal sampling requirements for reference region modeling of DCE-MRI data in human breast cancer. J Magn Reson Imaging 2009;30(1):121–134 [DOI] [PMC free article] [PubMed] [Google Scholar]