

Abstract
Objective:
To evaluate the distribution of white matter (WM) disease in frontotemporal lobar degeneration (FTLD) and Alzheimer disease (AD) and to evaluate the relative usefulness of WM and gray matter (GM) for distinguishing these conditions in vivo.
Methods:
Patients were classified as having FTLD (n = 50) or AD (n = 42) using autopsy-validated CSF values of total-tau:β-amyloid (t-tau:Aβ1–42) ratios. Patients underwent WM diffusion tensor imaging (DTI) and volumetric MRI of GM. We employed tract-specific analyses of WM fractional anisotropy (FA) and whole-brain GM density analyses. Individual patient classification was performed using receiver operator characteristic (ROC) curves with FA, GM, and a combination of the 2 modalities.
Results:
Regional FA and GM were significantly reduced in FTLD and AD relative to healthy seniors. Direct comparisons revealed significantly reduced FA in the corpus callosum in FTLD relative to AD. GM analyses revealed reductions in anterior temporal cortex for FTLD relative to AD, and in posterior cingulate and precuneus for AD relative to FTLD. ROC curves revealed that a multimodal combination of WM and GM provide optimal classification (area under the curve = 0.938), with 87% sensitivity and 83% specificity.
Conclusions:
FTLD and AD have significant WM and GM defects. A combination of DTI and volumetric MRI modalities provides a quantitative method for distinguishing FTLD and AD in vivo.
Several biomarkers have been proposed to distinguish between frontotemporal lobar degeneration (FTLD) and Alzheimer disease (AD) as entry criteria for disease-modifying treatment trials. Total-tau (t-tau), β-amyloid (Aβ1–42), and other CSF analytes support in vivo diagnosis, with t-tau:Aβ1–42 ratio showing superior discriminating power in autopsy-confirmed studies.1–3 However, CSF collection is invasive, costly, and limited in availability.
Structural MRI of gray matter (GM)4–6 and diffusion tensor imaging (DTI) of white matter (WM)4 are less invasive and widely available candidate biomarkers. Autopsy-confirmed or CSF-defined investigations of FTLD and AD have demonstrated that GM MRI may be a useful biomarker.4,7 FTLD is generally associated with anterior GM changes and AD with more posterior GM disease. Recent approaches extend these findings to classify individual patients.4–6,8
Few investigations have used DTI to evaluate WM disease in AD and FTLD.4,9–13 Group studies of DTI in clinically diagnosed FTLD have demonstrated significant WM disease in several tracts relative to healthy seniors,12,13 although the distribution of disease may vary across clinical phenotypes.9,10 In a comparative study of CSF-defined groups, reduced fractional anisotropy (FA) in corpus callosum and inferior frontal-occipital fasciculus was found in FTLD relative to AD.4 The role of WM disease in the classification of FTLD and AD remains to be assessed.
In this article, we evaluate the distribution of WM and GM disease in CSF-defined cohorts of FTLD and AD. We then evaluate the relative contribution of WM and GM for the classification of individual patients.
METHODS
Protocol approval, registration, and patient consent.
All patients were recruited from the University of Pennsylvania Department of Neurology. Written informed consent was obtained for all patients and healthy seniors using a University of Pennsylvania Institutional Review Board–approved protocol.
Patients.
We analyzed scans from 130 participants. This included 92 patients who underwent a diagnostic lumbar puncture and also had volumetric T1 magnetization-prepared rapid gradient echo (MPRAGE) structural MRI and DTI scans. These patients were clinically diagnosed with AD (N = 34) or an FTLD spectrum syndrome such as primary progressive aphasia (n = 21), behavioral variant frontotemporal degeneration (n = 27), or corticobasal syndrome (n = 10). Clinical diagnosis was performed by a board-certified neurologist (M.G.) using published criteria.14–17 We additionally included healthy seniors (n = 38) with volumetric T1 MPRAGE structural MRI and DTI scans. Table 1 summarizes demographic characteristics. Groups were matched across demographic characteristics, including age, education, and gender (all p > 0.10). Additionally, AD and FTLD groups were matched for disease duration (p > 0.10).
Table 1.
Demographics and neuropsychological characteristics of healthy seniors, patients with frontotemporal lobar degeneration, and patients with Alzheimer disease
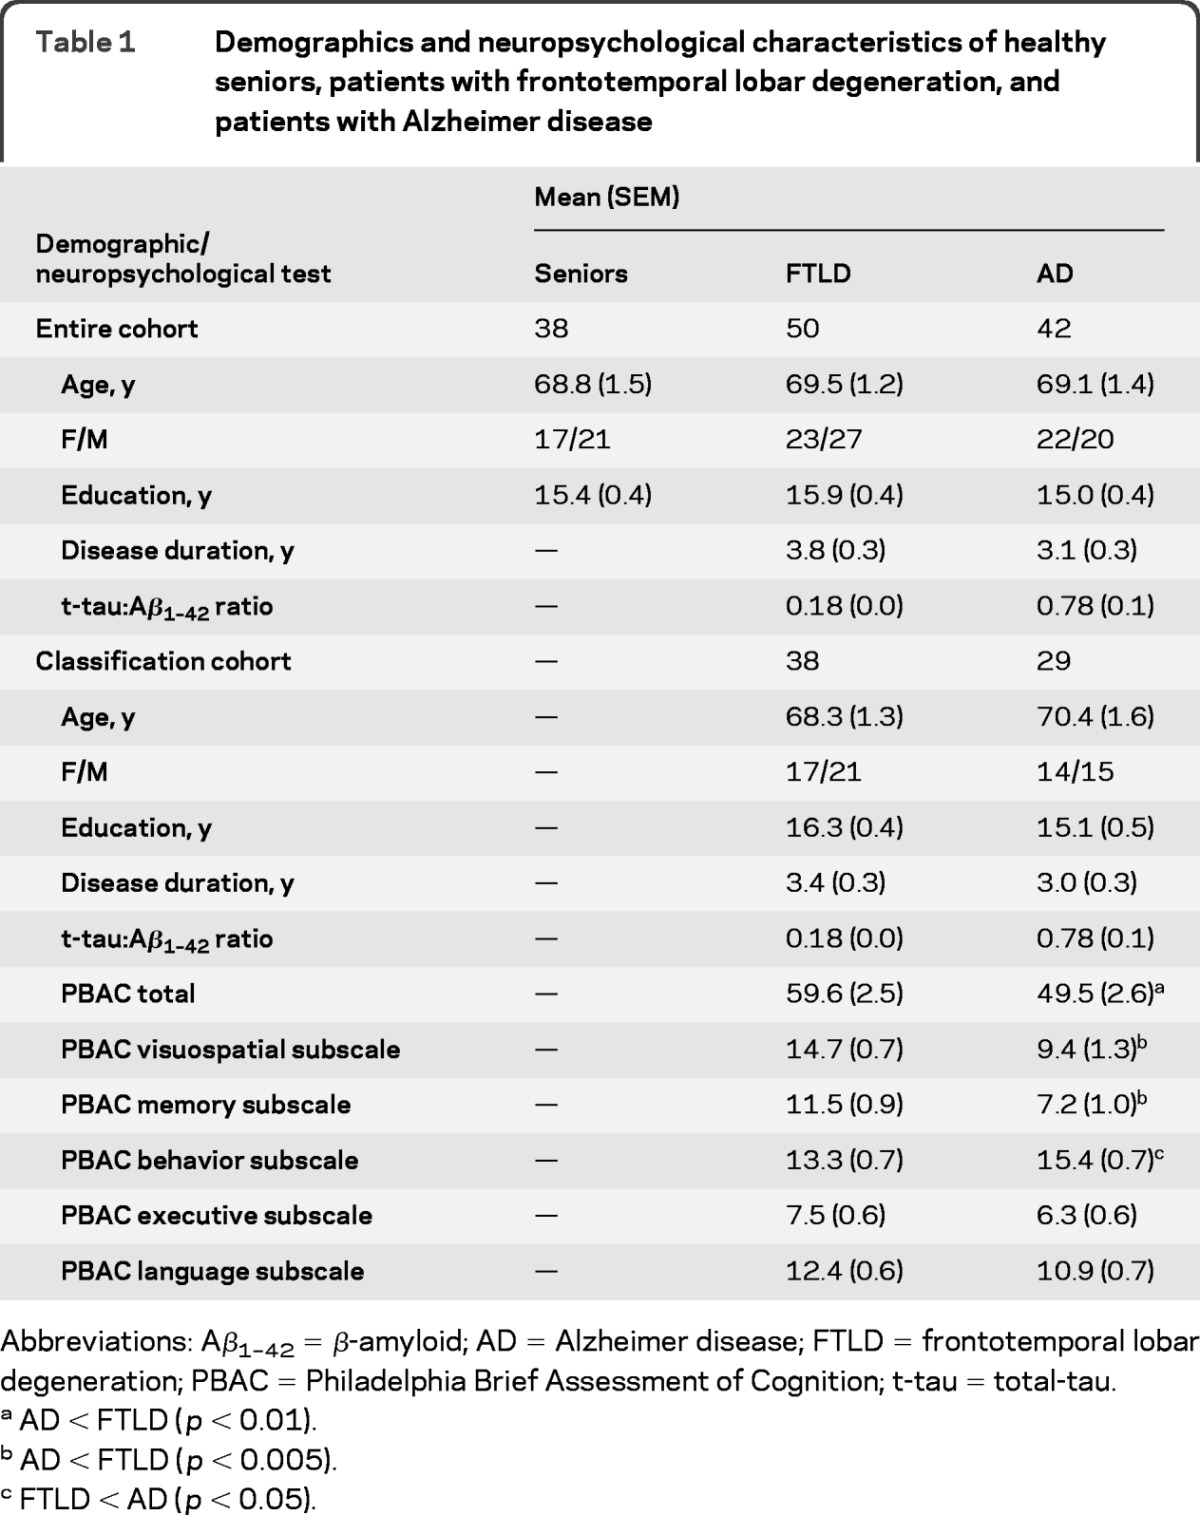
Abbreviations: Aβ1–42 = β-amyloid; AD = Alzheimer disease; FTLD = frontotemporal lobar degeneration; PBAC = Philadelphia Brief Assessment of Cognition; t-tau = total-tau.
AD < FTLD (p < 0.01).
AD < FTLD (p < 0.005).
FTLD < AD (p < 0.05).
Neuropsychological assessment.
A subset of patients (n = 67; 38 FTLD, 29 AD) underwent neuropsychological examination using the Philadelphia Brief Assessment of Cognition (PBAC).18 The PBAC is a brief, comprehensive, and validated dementia screening instrument that provides a subscale measure for 5 domains of cognition affected by dementia, including memory, visuospatial operations, language, executive control, and behavioral/social comportment. The PBAC total score quantifies the presence and severity of dementia and is highly correlated with Mini-Mental State Examination (MMSE).18 The subset of patients who completed the PBAC were matched across AD and FTLD patient groups for demographic characteristics and were matched to the larger cohort of patients who underwent neuroimaging (all p > 0.10; table 1). Neuropsychological assessment was conducted within approximately 4 months of neuroimaging data collection and this duration did not differ between AD (mean ± SEM = 4.01 ± 0.83 months) and FTLD [mean ± SEM = 3.27 ± 0.74 months; t(65) <1].
CSF analysis.
CSF was obtained at the time of clinical and MRI evaluation for all patients with AD and FTLD, and analyzed in duplicate using either a sandwich ELISA or LUMINEX t-tau and Aβ1–42 levels, as described previously.1,19 Patients were classified as AD or FTLD using an autopsy-validated t-tau:Aβ1–42 ratio cutoff of 0.34 (table 1). This cutoff revealed 100% sensitivity and 91% specificity for discriminating between AD and non-AD,3 where t-tau:Aβ1–42 ≥0.34 was associated with AD and where t-tau:Aβ1–42 <0.34 was associated with non-AD. Throughout this article we assume that non-AD is consistent with FTLD pathology because of the phenotype diagnosis, consistent with our autopsy-validated CSF series.
Neuroimaging acquisition.
All participants underwent a structural T1-weighted MPRAGE MRI acquired from a SIEMENS 3.0 T Trio scanner with an 8-channel coil using the following parameters: repetition time = 1,620 msec, echo time = 3 msec, slice thickness = 1.0 mm, flip angle = 15°, matrix = 192 × 256, and in-plane resolution = 0.9 × 0.9 mm. Diffusion-weighted images (DWIs) were acquired using a 30-direction, single shot, spin-echo EPI sequence, with field of view = 22 cm, matrix = 96 × 112, repetition time = 6.5 s, echo time = 99 msec, b value = 0, 1,000 s/mm2; 3 averages with total scan time = 8 minutes for 72 × 2-mm-thick slices with in-plane resolution = 2 mm2.
Tract-specific analysis of diffusion tensor imaging.
Diffusion tensor images (DTIs) were reconstructed from the DWIs using DTI-TK (http://dti-tk.sourceforge.net/) and then analyzed using a previously reported tract-specific analysis (TSA) framework.20 TSA involves 4 processing steps: segmentation of specific tracts on a template, modeling of each tract, normalization of the subject's DTs to the template space, and statistical analysis. We used a DTI template created from a population of aging adults (age 60–80 years), using the publicly available IXI dataset (http://biomedic.doc.ic.ac.uk/brain-development/index.php?n=Main.Datasets). Specific tracts were then segmented on this template by an expert, after whole-brain fiber tractography.21 This approach takes advantage of prior knowledge of WM topology to separate tracts and minimizes interpretive confounds due to crossing fibers within a voxel. One central and 5 lateralized tracts were generated: a single corpus callosum (CC) and bilateral corticospinal (CST), inferior fronto-occipital fasciculus (IFO), inferior longitudinal fasciculus (ILF), superior longitudinal fasciculus (SLF), and uncinate fasciculus (UNC) tracts.
The skeleton of each tract was approximated by a parametric surface using the continuous medial representation framework (cm-rep).22 DTI images from all subjects were coregistered to the DTI template using a state-of-the-art tensor-based normalization technique.23 Spatially normalized tensor fields were sampled for each subject along directions emanating from the tract skeleton to the tract boundary, and averaged, producing a single average tensor for each point on the parametric skeleton for each subject. FA values were derived from the average tensors, yielding scalar FA maps over 2-dimensional skeleton surfaces. Point-wise hypothesis testing with correction for multiple tests was performed on these maps using a nonparametric permutation-based cluster inference technique adapted to curved manifolds, with 1,000 permutations. We evaluated FA differences between each patient group relative to healthy seniors (p < 0.001 cluster threshold). We also performed direct comparisons of FA differences between FTLD and AD and for these comparisons we used a more liberal threshold (p < 0.01 cluster threshold) since there is reduced statistical power when comparing 2 disease groups relative to comparing a disease group and healthy group.
GM density analysis.
Whole-brain MRI volumes were preprocessed using PipeDream (https://sourceforge.net/projects/neuropipedream/) and Advanced Normalization Tools (http://www.picsl.upenn.edu/ANTS/) using a previously reported procedure.4 Briefly, PipeDream deforms each individual dataset into a standard local template space in a canonical stereotactic coordinate system. A diffeomorphic deformation was used for registration that is symmetric to minimize bias toward the reference space for computing the mappings, and topology-preserving to capture the large deformation necessary to aggregate images in a common space. These algorithms allow template-based priors to guide cortical segmentation and compute GM probability, which we use as a measure of GM density. Images were smoothed using a 4-mm full-width half-maximum Gaussian kernel.
Analyses were performed using FSL's randomize module (www.fmrib.ox.ac.uk/fsl/randomise). Group differences were evaluated using permutation-based methods with 1,000 permutations/test. For each patient group compared to healthy seniors, we report clusters that survive a q < 0.005 (false discovery rate [FDR]–corrected) threshold and contain a minimum of 400 adjacent voxels. For our direct comparison of AD and FTLD we report clusters that survive a q < 0.05 (FDR-corrected) threshold and contain a minimum of 400 adjacent voxels. The latter analysis corrected for multiple comparisons but used a more liberal threshold since there is reduced statistical power when comparing 2 disease groups relative to a disease group compared to a healthy group.
Classification.
We used ROC curves to classify each participant who had GM, DTI, and a neuropsychological evaluation as having FTLD or AD with 3 approaches. First, we used the mean FA of the anterior CC region that significantly differed in our DTI comparison of FTLD relative to AD (see below). Second, we used the mean GM density for the 3 cortical regions that differed in comparisons of FTLD and AD (see below). For each of these modalities we computed a logistic regression that generated a probabilistic likelihood of AD or FTLD diagnosis in each patient for each region. In each logistic regression we included a nuisance covariate for total PBAC score, a measure of disease severity, since we observed a group difference in this measure (see below). Third, we computed a backward stepwise logistic regression using all classifiers (1 DTI region, 3 GM regions, and 1 nuisance covariate for total PBAC) from the prior analyses to determine the optimal model for classifying AD and FTLD.
RESULTS
Neuropsychological assessment.
Neuropsychological results are summarized in table 1. Patients with AD were significantly more impaired than patients with FTLD on total PBAC [t(65) = 2.77; p < 0.01], PBAC visuospatial subscale [t(65) = 3.75; p < 0.001], and PBAC memory subscale [t(65) = 3.22; p < 0.005]. Patients with AD and patients with FTLD did not differ on PBAC executive subscale [t(65) = 1.35; p > 0.10] or PBAC language subscale [t(65) = 1.64; p > 0.10]. Patients with FTLD were significantly more impaired than patients with AD on the PBAC behavior subscale [t(65) = 2.09; p < 0.05].
Diffusion tensor imaging results.
Patients with FTLD have significantly reduced FA relative to healthy seniors in all analyzed white matter tracts, including bilateral CST, IFO, ILF, SLF, and UNC as well as in CC (figure 1A, top). This is most prominent in anterior portions of these tracts. Patients with AD compared to healthy seniors have significantly reduced FA in bilateral CST, IFO, ILF, SLF, and right UNC and CC (figure 1B, top). A direct comparison between AD and FTLD revealed significantly reduced FA in anterior CC in FTLD relative to AD (figure 2A). Patients with AD did not show any areas of significantly reduced FA relative to FTLD. The location and size of significant clusters in each tract for each comparison are reported in table e-1 on the Neurology® Web site at www.neurology.org.
Figure 1. Fractional anisotropy and gray matter density in frontotemporal lobar degeneration and Alzheimer disease (AD) relative to controls.

T-maps reflecting significantly reduced fractional anisotropy (FA) at the top of each panel and reduced gray matter (GM) density at the bottom of each panel. (A) Frontotemporal lobar degeneration relative to healthy seniors. (B) AD relative to healthy seniors. CC = corpus callosum (CC in the midline at the top of each panel is an anterior view); CST = cerebrospinal tract; IFO = inferior fronto-occipital fasciculus; ILF = inferior longitudinal fasciculus; SLF = superior longitudinal fasciculus; UNC = uncinate.
Figure 2. Direct contrasts of fractional anisotropy and gray matter density in frontotemporal lobar degeneration (FTLD) and Alzheimer disease (AD).

Regions of interest (red) identified from direct patient group comparisons. (A) Significantly reduced fractional anisotropy in the contrast of FTLD < AD in the anterior corpus callosum. (B) Significantly reduced gray matter density for the contrasts of AD < FTLD in precuneus and posterior cingulate and for FTLD < AD in anterior temporal cortex. Midsagittal inset shows locations of coronal slices, and y-axis coordinate is provided for each slice.
GM density results.
Patients with FTLD have significantly reduced GM throughout frontal and anterior temporal cortex relative to healthy seniors (figure 1A, bottom). Patients with AD have widespread GM atrophy relative to healthy seniors throughout parietal, temporal, and frontal cortex (figure 1B, bottom). A direct comparison of groups revealed significantly reduced GM in left anterior temporal cortex in FTLD relative to AD, and significantly reduced GM in the precuneus and posterior cingulate gyrus in AD relative to FTLD (figure 2B). Table e-2 summarizes the location and size of significant clusters for each group comparison.
FTLD and AD patient classification.
Table 2 shows that DTI provides a significant classifier (AUC = 0.795; p < 0.001), with 79% sensitivity and 59% specificity for discriminating between AD and FTLD. The ROC curves are provided in figure 3. All 3 regions identified in the GM analyses achieved a significant AUC, ranging from 0.792 to 0.890. The posterior cingulate provided the highest GM-based classification accuracy, with 87% sensitivity and 66% specificity and the precuneus achieved modest specificity (82%) and sensitivity (79%). A backward stepwise regression revealed that a combination of GM and WM, with the addition of a nuisance covariate for total PBAC to control for disease severity, provides the best overall fit for predicting diagnosis (χ2 = 49.18; p < 0.001; y = 24.36 + 18.93 [CC] + 17.34 [posterior cingulate] +23.59 [precuneus] + 0.05 [total PBAC]). Classification accuracy for this combined approach achieved the highest overall AUC (AUC = 0.938; p < 0.001), with 87% sensitivity and 83% specificity: 33 out of 38 patients with FTLD were correctly classified as FTLD and 24 out of 29 patients with AD were correctly classified as AD.
Table 2.
ROC results with sensitivity and specificity for the classification of frontotemporal lobar degeneration using DTI and GM, and multimodal combination of neuroimaging methods
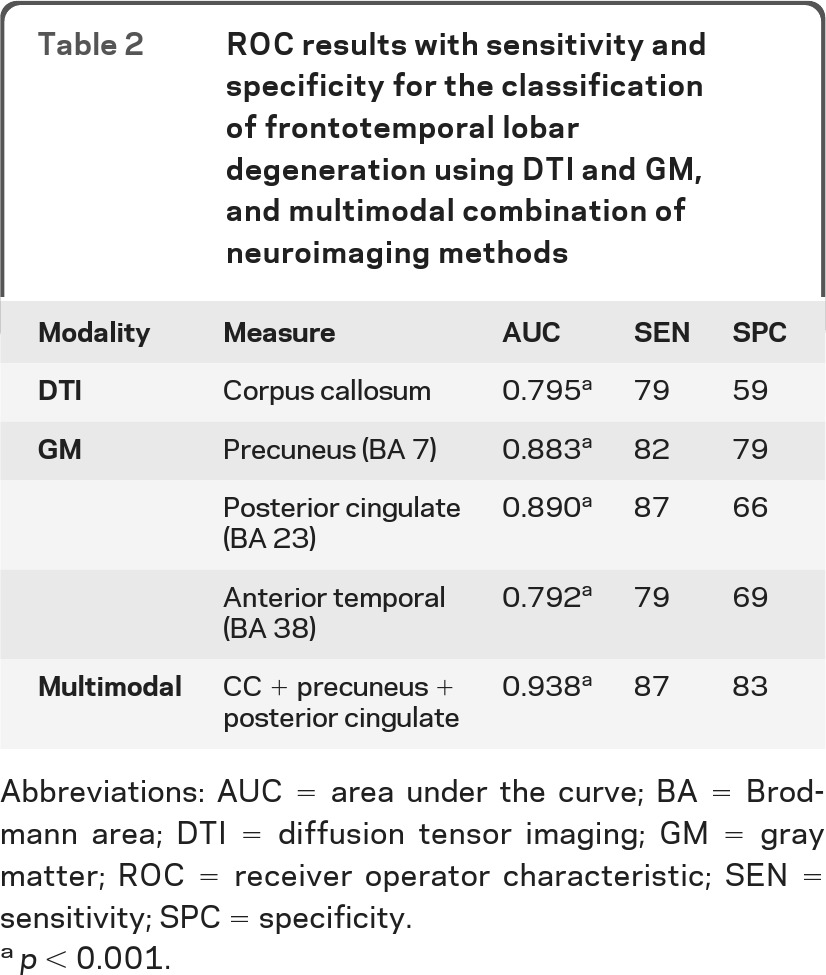
Abbreviations: AUC = area under the curve; BA = Brodmann area; DTI = diffusion tensor imaging; GM = gray matter; ROC = receiver operator characteristic; SEN = sensitivity; SPC = specificity.
p < 0.001.
Figure 3. Receiver operator characteristic curves for classification of frontotemporal lobar degeneration and Alzheimer disease based on the optimal measure from each domain alone, and multimodal combination of fractional anisotropy and gray matter density.

DTI = diffusion tensor imaging.
DISCUSSION
FTLD and AD can be difficult to discriminate in vivo due to often overlapping clinical features. Clinicopathologic correlation studies confirm that overlapping clinical phenotypes are associated with AD and FTLD spectrum pathology in multiple domains of cognition.17,24,25 Corticobasal syndrome often due to FTLD spectrum pathology and posterior cortical atrophy often due to AD have overlapping visuospatial features; nonfluent/agrammatic primary progressive aphasia associated with FTLD spectrum pathology and logopenic primary progressive aphasia associated with AD may have overlapping language difficulties; patients with behavioral variant frontotemporal dementia and patients with AD may present with behavioral difficulty, an executive disorder, or an episodic memory deficit. Therefore, there is an urgent need to improve diagnostic accuracy in a quantitative manner that does not rely on clinical features in order to screen patients for clinical trials involving disease-modifying agents.
While rare studies have described DTI in FTLD,4,9–12,26 we are unaware of previous work attempting to classify individuals with FTLD and AD on the basis of WM disease. Our findings suggest that both FTLD and AD have significantly reduced FA. Previous group studies have demonstrated WM changes in anterior brain regions in clinically diagnosed patients with FTLD.9,11–13 Our observation of reduced FA anteriorly is consistent with this body of work. Moreover, direct contrasts revealed that patients with FTLD have reduced FA relative to patients with AD in anterior CC, consistent with a previous comparative, whole-brain DTI analysis demonstrating reduced FA in this region in CSF-defined cohorts.4 A few previous DTI studies have investigated the distribution of WM changes in patients with known disease defined by autopsy, CSF, or Pittsburgh compound B.4,10 In the present study, all patients had CSF t-tau:Aβ1–42 that classified individuals as having AD or FTLD based on an autopsy-validated sample. Thus, our findings are likely to reflect WM changes in patients with distinct underlying pathology.
It is noteworthy that all previous investigations, like ours, failed to observe reduced FA in AD relative to FTLD.4,11,27 This includes a TSA study of CSF-defined FTLD and AD,27 though this previous TSA report was limited by reduced DTI resolution (12 directions) and a smaller cohort of patients. FTLD may exhibit greater WM changes than AD due to prominent underlying neuropathology in FTLD that specifically involves microglia in FTLD-tau28 and glial lesions immunoreactive to TDP-43 in FTLD-TDP.29 WM pathology is much more modest in AD. This difference emphasizes the potentially important role that WM imaging may play in comparative studies distinguishing FTLD from AD. Indeed, our backward stepwise regression demonstrated that FA contributes significantly to the classification of FTLD and AD.
Our classification results based solely on DTI may provide a sensitive (79%) biomarker for distinguishing FTLD from AD, but DTI itself has modest specificity (59%). One possibility is that separate assessments of axial and radial diffusivities that contribute to FA may improve specificity, as suggested in a previous study of primary progressive aphasia,10 though the interpretation of these indices is highly controversial.30
Previous work may have been somewhat limited in its ability to perform studies classifying individual patients in part because of the imaging analysis techniques. Prior studies thus relied on user-dependent techniques for defining a region or tract of interest, and potential variability in the definition of a tract inherent in user-dependent approaches, even among experts, limits the power of classification studies. We circumvented this problem while managing interpretive confounds associated with the directionality of crossing fibers by using a TSA approach. This user-independent analysis is based on a local WM anatomic atlas that automatically defines all tracts in a manner analogous to defining GM structures with voxel-based morphometry. Additional work is needed with this analytic technique in autopsy-defined cases to validate tract definition.
It is well-established that AD and FTLD have distinct patterns of GM defects4,7 and our results are consistent with previous reports. However, few investigations have evaluated the relative usefulness of GM and WM for in vivo diagnosis of these 2 patient groups. We observed that GM regions compromised in AD provided better classification accuracy than WM, but that GM in the anterior temporal cortex for FTLD was a significant but weaker classifier. More advanced algorithms involving support vector machines have demonstrated higher classification accuracy for GM alone than our approach.5,6 Other studies have used machine learning techniques to combine GM imaging with other neuroimaging modalities in order to distinguish AD from controls31,32 and FTLD from AD,4,8 and our results are consistent with their claims that a multimodal approach yields higher classification accuracy compared to GM imaging alone. However, an advantage of the simpler approach in the present study is that it can easily be adapted for clinical evaluation of individual patients rather than a group-level machine learning analysis involving expert technical judgments.
Critically, a multimodal approach that incorporates WM and GM provides an optimal classification method that is both sensitive and specific for discriminating between AD and FTLD. Classification measures with high sensitivity allow the clinician to detect the presence or absence of disease. However, specificity is also required to discriminate between diseases with distinct histopathologic characteristics. With the emergence of potential disease-modifying agents, comparative studies of this sort are important to establish specificity so that patients may be appropriately entered into etiologically specific clinical trials.
There is growing evidence that there are at least 3 subtypes of underlying pathology associated with FTLD, including tau-positive inclusions (FTLD-tau), TDP-43 proteinopathies (FTLD-TDP), and less commonly associated with the fused in sarcoma protein (FTLD-FUS).33 The multimodal approach in this article measured classification accuracy using CSF t-tau:Aβ1–42, which has been reported as sensitive and specific for discriminating between AD and non-AD3 and we assume that phenotypes associated with the latter are related to FTLD pathology. T-tau:Aβ1–42 is not, however, sensitive for discriminating between pathologic subtypes of FTLD, and future work is required to identify candidate CSF biomarkers for further discriminating between these subgroups of FTLD.34
We conclude that individuals with AD and FTLD have significant changes in WM and GM that appear to reflect distinct underlying neuropathologic processes with reasonably high accuracy. This multimodal approach supports noninvasive classification of individual patients with a high degree of sensitivity and specificity in a clinical setting.
Supplementary Material
GLOSSARY
- Aβ1–42
β-amyloid
- AD
Alzheimer disease
- CC
corpus callosum
- CST
corticospinal tract
- DTI
diffusion tensor imaging
- DWI
diffusion-weighted image
- FA
fractional anisotropy
- FDR
false discovery rate
- FTLD
frontotemporal lobar degeneration
- GM
gray matter
- IFO
inferior fronto-occipital
- ILF
inferior longitudinal fasciculus
- MMSE
Mini-Mental State Examination
- MPRAGE
magnetization-prepared rapid gradient echo
- PBAC
Philadelphia Brief Assessment of Cognition
- ROC
receiver operator characteristic
- SLF
superior longitudinal fasciculus
- t-tau
total-tau
- TSA
tract-specific analysis
- UNC
uncinate fasciculus
- WM
white matter.
Footnotes
Supplemental data at www.neurology.org
AUTHOR CONTRIBUTIONS
Corey T. McMillan drafted/revised manuscript for content, contributed to study concept/design, performed analysis/interpretation of the data, and performed statistical analysis. Caroline Brun drafted/revised manuscript for content, contributed to study concept/design, and performed analysis/interpretation. Sarmad Siddiqui, Mathew Churgin, and David Libon contributed to the analysis/interpretation. Paul Yushkevich contributed to the study concept/design, drafting/revising the manuscript, study supervision, and obtained funding. Hui Zhang contributed to the study concept/design and drafting/revising the manuscript. Ashley Boller contributed to analysis/interpretation of the data and acquisition of the data. James Gee contributed to study concept/design, obtained funding, and provided supervision. Murray Grossman drafted/revised manuscript for content, contributed to study concept/design, performed analysis/interpretation of the data, obtained funding, and provided supervision.
DISCLOSURE
The authors report no disclosures relevant to the manuscript. Go to Neurology.org for full disclosures.
REFERENCES
- 1. Bian H, van Swieten JC, Leight S, et al. CSF biomarkers in frontotemporal lobar degeneration with known pathology. Neurology 2008; 70: 1827– 1835 . [DOI] [PMC free article] [PubMed] [Google Scholar]
- 2. Grossman M, Farmer J, Leight S, et al. Cerebrospinal fluid profile in frontotemporal dementia and Alzheimer's disease. Ann Neurol 2005; 57: 721– 729 . [DOI] [PubMed] [Google Scholar]
- 3. Irwin DJ, McMillan CT, Toledo JB, et al. Comparison of cerebrospinal fluid levels of tau and AB1–42 in Alzheimer disease and frontotemporal degeneration using 2 analytical platforms. Arch Neurol Epub 2012 Apr 9 [DOI] [PMC free article] [PubMed] [Google Scholar]
- 4. Avants BB, Cook PA, Ungar L, Gee JC, Grossman M. Dementia induces correlated reductions in white matter integrity and cortical thickness: a multivariate neuroimaging study with sparse canonical correlation analysis. NeuroImage 2010; 50: 1004– 1016 . [DOI] [PMC free article] [PubMed] [Google Scholar]
- 5. Klöppel S, Stonnington CM, Chu C, et al. Automatic classification of MR scans in Alzheimer's disease. Brain 2008; 131: 681– 689 . [DOI] [PMC free article] [PubMed] [Google Scholar]
- 6. Davatzikos C, Resnick SM, Wu X, Parmpi P, Clark CM. Individual patient diagnosis of AD and FTD via high-dimensional pattern classification of MRI. NeuroImage 2008; 41: 1220– 1227 . [DOI] [PMC free article] [PubMed] [Google Scholar]
- 7. Rabinovici GD, Seeley WW, Kim EJ, et al. Distinct MRI atrophy patterns in autopsy-proven Alzheimer's disease and frontotemporal lobar degeneration. Am J Alzheimers Dis Other Dement 2007; 22: 474– 488 . [DOI] [PMC free article] [PubMed] [Google Scholar]
- 8. Zhang Y, Schuff N, Ching C, et al. Joint assessment of structural, perfusion, and diffusion MRI in Alzheimer's disease and frontotemporal dementia. Int J Alzheimers Dis 2011; 54: 68– 71 . [DOI] [PMC free article] [PubMed] [Google Scholar]
- 9. Whitwell JL, Avula R, Senjem ML, et al. Gray and white matter water diffusion in the syndromic variants of frontotemporal dementia. Neurology 2010; 74: 1279– 1287 . [DOI] [PMC free article] [PubMed] [Google Scholar]
- 10. Galantucci S, Tartaglia MC, Wilson SM, et al. White matter damage in primary progressive aphasias: a diffusion tensor tractography study. Brain 2011; 134: 3011– 3029 . [DOI] [PMC free article] [PubMed] [Google Scholar]
- 11. Zhang Y, Schuff N, Du A-T, et al. White matter damage in frontotemporal dementia and Alzheimer's disease measured by diffusion MRI. Brain 2009; 132: 2579– 2592 . [DOI] [PMC free article] [PubMed] [Google Scholar]
- 12. Matsuo K, Mizuno T, Yamada K, et al. Cerebral white matter damage in frontotemporal dementia assessed by diffusion tensor tractography. Neuroradiology 2008; 50: 605– 611 . [DOI] [PubMed] [Google Scholar]
- 13. Borroni B, Brambati SM, Agosti C, et al. Evidence of white matter changes on diffusion tensor imaging in frontotemporal dementia. Arch Neurol 2007; 64: 246– 251 . [DOI] [PubMed] [Google Scholar]
- 14. Gorno-Tempini ML, Hillis AE, Weintraub S, et al. Classification of primary progressive aphasia and its variants. Neurology 2011; 76: 1006– 1014 . [DOI] [PMC free article] [PubMed] [Google Scholar]
- 15. McKhann GM, Knopman DS, Chertkow H, et al. The diagnosis of dementia due to Alzheimer's disease: recommendations from the National Institute on Aging-Alzheimer's Association workgroups on diagnostic guidelines for Alzheimer's disease. Alzheimers Dement 2011; 7: 263– 269 . [DOI] [PMC free article] [PubMed] [Google Scholar]
- 16. Murray R, Neumann M, Forman MS, et al. Cognitive and motor assessment in autopsy-proven corticobasal degeneration. Neurology 2007; 68: 1274– 1283 . [DOI] [PubMed] [Google Scholar]
- 17. Rascovsky K, Hodges JR, Knopman D, et al. Sensitivity of revised diagnostic criteria for the behavioural variant of frontotemporal dementia. Brain 2011; 134: 2456– 2477 . [DOI] [PMC free article] [PubMed] [Google Scholar]
- 18. Libon DJ, Rascovsky K, Gross RR, et al. The Philadelphia Brief Assessment of Cognition (PBAC): a validated screening measure for dementia. Clin Neuropsychologist 2011; 25: 1314– 1330 . [DOI] [PMC free article] [PubMed] [Google Scholar]
- 19. Shaw LM, Vanderstichele H, Knapik-Czajka M, et al. Cerebrospinal fluid biomarker signature in Alzheimer's disease neuroimaging initiative subjects. Ann Neurol 2009; 65: 403– 413 . [DOI] [PMC free article] [PubMed] [Google Scholar]
- 20. Yushkevich PA, Zhang H, Simon TJ, Gee JC. Structure-specific statistical mapping of white matter tracts. NeuroImage 2008; 41: 448– 461 . [DOI] [PMC free article] [PubMed] [Google Scholar]
- 21. Wakana S, Jiang H, Nagae-Poetscher LM, van Zijl PCM, Mori S. Fiber tract-based atlas of human white matter anatomy. Radiology 2004; 230: 77– 87 . [DOI] [PubMed] [Google Scholar]
- 22. Yushkevich PA. Continuous medial representation of brain structures using the biharmonic PDE. NeuroImage 2009; 45: S99– S110 . [DOI] [PMC free article] [PubMed] [Google Scholar]
- 23. Zhang H, Yushkevich PA, Alexander DC, Gee JC. Deformable registration of diffusion tensor MR images with explicit orientation optimization. Med Image Anal 2006; 10: 764– 785 . [DOI] [PubMed] [Google Scholar]
- 24. Lee SE, Rabinovici GD, Mayo MC, et al. Clinicopathological correlations in corticobasal degeneration. Ann Neurol 2011; 70: 327– 340 . [DOI] [PMC free article] [PubMed] [Google Scholar]
- 25. Grossman M. Primary progressive aphasia: clinicopathological correlations. Nat Rev Neurol 2010; 6: 88– 97 . [DOI] [PMC free article] [PubMed] [Google Scholar]
- 26. Borroni B, Alberici A, Premi E, et al. Brain magnetic resonance imaging structural changes in a pedigree of asymptomatic progranulin mutation carriers. Rejuvenation Res 2008; 11: 585– 595 . [DOI] [PubMed] [Google Scholar]
- 27. Hu W, Zhang H, McMillan C, Lee V, Trojanowski J, Grossman M. Distinct white matter tract changes in frontotemporal dementia associated with FTLD and Alzheimer's disease pathology or CSF biomarkers. Neurology 2010; 74 (suppl 2): A569 Abstract . [Google Scholar]
- 28. Forman MS, Zhukareva V, Bergeron C, et al. Signature tau neuropathology in gray and white matter of corticobasal degeneration. Am J Pathol 2002; 160: 2045– 2053 . [DOI] [PMC free article] [PubMed] [Google Scholar]
- 29. Geser F, Martinez-Lage M, Robinson J, et al. Clinical and pathological continuum of multisystem TDP-43 proteinopathies. Arch Neurol 2009; 66: 180– 189 . [DOI] [PMC free article] [PubMed] [Google Scholar]
- 30. Wheeler-Kingshott CAM, Cercignani M. About “axial” and “radial” diffusivities. Magn Reson Med 2009; 61: 1255– 1260 . [DOI] [PubMed] [Google Scholar]
- 31. Zhang D, Wang Y, Zhou L, Yuan H, Shen D, Alzheimer's Disease Neuroimaging Initiative Multimodal classification of Alzheimer's disease and mild cognitive impairment. NeuroImage 2011; 55: 856– 867 . [DOI] [PMC free article] [PubMed] [Google Scholar]
- 32. Walhovd KB, Fjell AM, Brewer J, et al. Combining MR imaging, positron-emission tomography, and CSF biomarkers in the diagnosis and prognosis of Alzheimer disease. AJNR Am J Neuroradiol 2010; 31: 347– 354 . [DOI] [PMC free article] [PubMed] [Google Scholar]
- 33. Mackenzie IRA, Neumann M, Bigio EH, et al. Nomenclature and nosology for neuropathologic subtypes of frontotemporal lobar degeneration: an update. Acta Neuropathol 2010; 119: 1– 4 . [DOI] [PMC free article] [PubMed] [Google Scholar]
- 34. Hu WT, Chen-Plotkin A, Grossman M, et al. Novel CSF biomarkers for frontotemporal lobar degenerations. Neurology 20107;75:2079–2086 [DOI] [PMC free article] [PubMed] [Google Scholar]
Associated Data
This section collects any data citations, data availability statements, or supplementary materials included in this article.