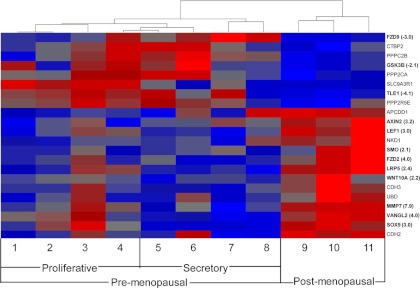
Fig. 2.
Differentially expressed genes involved in the Wnt signaling pathway in Pre-M and Post-M endometrial epithelial cells. Hierarchical cluster analysis of 22 Wnt-associated genes showing P < 0.05 (ANOVA) and a fold change of more than 2 comparing proliferative (samples 1–4), secretory (samples 5–8), and Post-M (samples 9–11) endometrial epithelial cells. Each column shows the relative gene expression of a single patient sample for the Wnt-associated genes, which are labeled on the abscissa. Higher expression (red) and lower expression (blue) is indicated by color and intensity. qRT-PCR validation of selected genes and fold change are identified by bold lettering. Dendrogram and heat map were generated by Partek Genomics Suite software.

