

Abstract
We describe a computational analysis method to evaluate the efficacy of immunomagnetic rare cell separation from non-Newtonian particulate blood flow. The core procedure proposed here is calculation of local viscosity distributions induced by red blood cell (RBC) sedimentation. Numerical calculation methods have previously been introduced to simulate particulate behavior of individual RBCs. However, due to the limitation of the computational power, those studies are typically capable of calculating only very small number (less than 100) of RBCs, and are not suitable to analyze many of practical separation methods for rare cells such as circulating tumor cells (CTCs). We introduce a sedimentation and viscosity model based on our experimental measurements. The computational field is divided into small unit control volumes, where local viscosity distribution is dynamically calculated based on the experimentally found sedimentation model. For the analysis of rare cell separation, local viscosity distribution is calculated as a function of the volume RBC rate. The direction of gravity takes an important role in such a sedimentation-involved cell separation system. We evaluated the separation efficacy with multiple design parameters including the channel design, channel operational orientations (inverted and upright) and flow rates. The results showed excellent agreements with real experiments to demonstrate the effectiveness of our computational analytical method. We demonstrated higher capture efficiency with the inverted microchannel configuration. We conclude that proper direction of blood sedimentation significantly enhances separation efficiency in microfluidic devices.
INTRODUCTION
Ex Vivo detection of rare cells or proteins from whole blood has been a topic of great interest across both fundamental medical research and clinical diagnostics community [1–14]. Blood is a non-Newtonian complex medium composed of plasma and blood cells. Red blood cells (RBCs) occupy 30–50% of the blood volume and play a very important role in defining the mechanical properties of blood as a particulate medium. Measurements of blood sedimentation and viscosity have been used as means for clinical diagnosis [15–20]. The sedimentation rate at which the RBCs fall varies markedly in certain pathological conditions [15–17]. Blood viscosity is believed to be a factor related to a risk of cardiovascular events [18–19]. Blood viscosity in tube flow have been measured mainly aimed for clinical applications [20].
Emerging technologies of microfluidic systems allowed creation of several types of miniature blood handling devices [1–14]. Separation of rare cells, such as Circulating Tumor Cells (CTCs), from blood has been especially focused on, because simple tests of blood can potentially provide critical information needed for diagnosis and prognosis of cancer. Separation methods include ones utilizing magnetic separation [3–12] or antibody functionalized microstructures in microchannels [13–14]. Since blood screening can potentially provide quantitative and high-throughput measurements at reduced material consumption, study of blood behavior in engineered microdevices is becoming increasingly important.
In the theoretical consideration of such microdevices, however, blood is simply treated as a viscous Newtonian medium. Although a simple Newtonian model is useful to roughly estimate the blood flow and device functionality for certain Lab-On-a-Chip applications, it does not represent the essential phenomena found in rare cell separation processes. Non-Newtonian behavior of blood caused by the particulate nature of blood cells can significantly affect the performance of the blood-handling device. Studies on computational physiology use lattice Boltzmann mathematical models to simulate flows containing multiple phases [21]. This method has been extended to study clotting process in a blood vessel [22] and to study blood cell dynamics to predict macroscopic blood rheology [23]. Others use the moving particle semi-implicit (MPS) method, where RBCs and platelets are modeled as assemblies of discrete particles [24]. They employed a vector/parallel super computer system to perform calculation. Due to the severe requirement of the computational power to calculate the motion of all the individual elements, number of blood cells that can be analyzed is still limited (typically less than 100) even with very advanced computing systems.
In this paper, we discuss a computational method we have developed to analyze the behavior of blood flow and to evaluate the efficacy of immunomagnetic rare cell separation process in a microfluidic device. The important feature in our computational method is modeling of blood flow. In our previous efforts, we have demonstrated microchip-based immunomagnetic separation of CTCs spiked into whole blood [12]. The uniqueness of the study included the rareness of the tumor cells (from ~1000 cells down to ~5 cells per mL) separated from whole blood. Tumor cell to blood cell ratio is extremely small (about 1:109, including RBCs). In order to analyze such fluidic devices that handle relatively large number of normal blood cells, computational methods that calculate behaviors of individual blood cells are unpractical and consume too much computational power.
We constructed a hybrid mathematical model to describe non-linear mechanical properties of blood flow, based on experimental measurements of macroscopic RBC sedimentation and viscosity for different volume RBC rates. RBC sedimentation in a microfluidic chip was then calculated with multiple design parameters including two different gravity configurations of inverted and upright positions. The nano/microscopic (~100 nm range) behavior of rare cells labeled with magnetic nanoparticles is calculated for each condition to assess capture efficiency of rare cells separated from blood flow.
THERORETICAL FRAMEWORK: ASSUMPTIONS AND MODELS
Blood sedimentation in a microfluidic device
Firstly, we introduce a simplified assumption for RBC sedimentation as follows:
-
1
RBC sedimentation in each control volume is given as a relative velocity ΔVRBC of the RBCs from the medium, and is expressed as a function of the volume RBC rate ρRBC.
Figure 1 shows our model of blood sedimentation in a flow. The flow field is divided into cubic control volumes. The flow vector Vmed of the medium, RBC sedimentation velocity ΔVRBC and volume RBC rate ρRBC is defined for each control volume. ΔVRBC is an averaged, relative velocity to the medium and is defined only in the direction of gravity. Transfer of RBCs between adjacent control volumes for each time step is calculated based on these three parameters.
Figure 1.
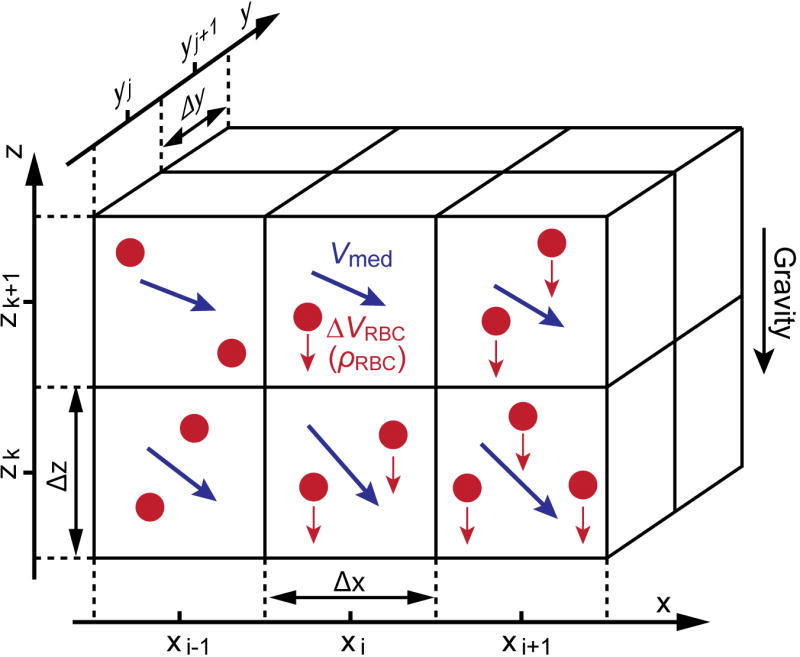
Model of red blood cell sedimentation in a medium flow. RBC sedimentation in each control volume is given as a relative velocity ΔVRBC of the RBCs from the medium, and is expressed as a function of the volume RBC rate ρ RBC.
Based on the above described model, we have made a procedure to calculate behaviors of RBCs in microfluidic flows. First, the flow field of the medium was calculated using a finite element analysis simulation program COMSOL. We assume macroscopic medium flow Vmed,u (u = x, y, z) is not affected by RBC motion. The flow field is segmented into cubic control volumes. For each time step, the volume RBC rate is updated using the RBC flux from neighboring control volumes. Each value of RBC flux is calculated from the volume RBC rate and the RBC flow velocity, which is given as the summation of medium flow velocity and the average velocity ΔVRBC of RBCs relative to the medium. The relative RBC velocity ΔVRBC is a function of ρRBC and is only considered in z direction. The absolute velocity of RBCs becomes:
| (1) |
| (2) |
| (3) |
RBC flux Φu (u = x, y, z) at an interface is expressed in the following equation:
| (4) |
where D is the diffusion constant. If we estimate the value of D by Einstein–Stokes equation
| (5) |
where KB =1.38×10⁻²³ kg·m2 ·s−2 ·K−1, T = 300 K, η and R are Boltzmann’s constant, absolute temperature, medium viscosity, radius of the spherical particle, respectively. The typical values of parameters of microfluidic blood flow containing RBCs are given as follows:
| (6) |
| (7) |
| (8) |
| (9) |
| (10) |
| (11) |
where h is the typical height of a micro channel. The two terms in (4) are estimated to be:
| (12) |
| (13) |
Therefore, we neglect the diffusion term in the following calculations.
When we define ΔρRBC as the change of the volume RBC rate in a control volume ΔxΔyΔz at a time step of t → t + Δt, it satisfies
| (14) |
where and are RBC flux in and flux out at and , respectively (see figure 1). Thus, the volume RBC rate can be updated by using the following equation:
| (15) |
Partial viscosity model for rare cell separation
Here we discuss the theoretical model to analyze immunomagnetic rare cell separation from whole blood. The important idea we introduce here is the assumption of partial viscosity:
-
2
Viscous force acting on a rare cell is the summation of vector partial viscous forces from the medium and the RBCs, each of which works in the same direction as its respective relative velocity to the cell.
This assumption is an expanded interpretation of the Einstein’s viscosity model [25], where viscosity is linearly correlated with volume rate of particles. Both models describe viscous force as the summation of partial contributions from particles.
Another force acting on the cell is the magnetic force. The cells are labeled with magnetic nanoparticles which are functionalized with tumor specific antibodies. Each cell is attracted along the magnetic field gradient to be sorted onto a bottom substrate. Figure 2 shows the model of rare cell separation from blood.
Figure 2.

Model of cell separation from blood. The viscous force acting on a rare cell is the summation of vector partial viscous forces from the medium and the RBCs, each of which works in the same direction as its respective relative velocity.
Magnetic force Fmag acting on the cell depends on the susceptibility and the total amount of attached nanoparticles. Fmag is expressed in the following way:
| (16) |
where μ0 = 4π ×10−7 T · m · A−1 is the magnetic permeability of vacuum, B is the magnetic field intensity. N is the number of magnetic nanoparticles attached to the cell, RF is the radius of the magnetic nanoparticles, and ΔχF as the volumetric susceptibility of the magnetic nanoparticles. We use conditions of RF = 50 nm and ΔχF = 5 (SI).
A cell is subjected to the drag force Fdrag from the medium and RBCs. In order to consider the viscous force contributed from the RBCs, we introduce a term “partial viscosity ΔηRBC,” which is a function of the volume RBC rate ρRBC. The partial viscosity ΔηRBC represents the contribution of viscous force from RBCs, which have an independent flow vector VRBC=Vmed + ΔVRBC different from the medium flow vector Vmed. The total drag force is expressed as the summation of the viscous force from the medium and the partial viscous force from the RBCs.
| (17) |
Where Rcell = 7.5 μm is the radius of the rare cell. Note that forces from the medium viscosity and the RBC viscosity are calculated from different velocity vectors, namely cell velocities relative to the medium flow and to the RBC flow.
Analysis of rare cell trajectory in blood
Here we describe a procedure that traces trajectory of a rare cell that is separated from the blood. The trajectory of a labeled rare cell is calculated in the following way. When we assume a quasi-static motion, the two forces equal to each other, namely
| (18) |
Solving (17) for ΔVcell using (18) gives
| (19) |
The velocity of the cell is now given as
| (20) |
For each time step t → t + Δt, the velocity of the cell is calculated based on the current position Xcell(t). The updated position is given by
| (21) |
MEASUREMENTS OF BLOOD CHARACERISTICS: SEDIMENTATION AND VISCOSITY
Measurement and modeling of blood sedimentation
Relative RBC sedimentation velocity ΔVRBC, which is a function of ρRBC, can be simply measured as the RBC sedimentation velocity V in an experiment with a capillary tube similar to microhematocrit tube. Figure 3 shows a sedimentation model of RBC suspension in a static tube. RBCs suspended at a volume density of ρRBC are kept in a sedimentation tube. After a certain time, the suspension shows four characteristic layers, namely, supernatant, diffusion, main suspension and settling layers. Here we consider the velocity V at which the sedimentation length L grows. Velocity V is a direct reflection of the average RBC settling velocity ΔVRBC in the main suspension. Growth of the diffusion layer is found to be slow enough to be neglected in this experimental model. Due to the interaction between RBCs, ΔVRBC is expressed as a function of volume RBC rate ρ RBC of the medium.
Figure 3.

Red blood cell sedimentation in a capillary tube. The average RBC settling velocity ΔV RBC in the main suspension can be observed as the sedimentation velocity V.
We performed a sedimentation experiment to measure the average sedimentation velocity for blood samples with different volume RBC rates. Some proteins in blood plasma are known to cause RBCs to stick to each other forming aggregates which settle faster. These aggregates result in drastic changes in the sedimentation velocity, and thus measurement of sedimentation velocity is used for diagnostic purposes [15–20]. We used a centrifugal process to replace blood plasma with a buffer solution. Centrifugal separation is often used in commercially available rare cell detection methods [26, 27]. It is possible to replace plasma without significantly losing rare cells contained in blood. Samples were prepared in the following way: firstly 2.5mL of blood drawn from a healthy subject and is added with 3.5mL PBS and centrifuged at a relative centrifugal force (RCF) of 800G for 10 minutes. Supernatant containing plasma as well as buffer and formed sediment of white blood cells and platelets are removed.
The buffer solution is added again to make the suspensions with volume RBC rates ρRBC = 0.5, 0.25, 0.13, 0.06, 0.03, 0.01. The processed blood is mixed well and 2 mL of each sample is measured in a transparent tubes with an inside diameter of 4.2 mm, and kept stable for hours. Figure 4 shows the measured sedimentation for six different volume RBC rates. The sedimentation velocity is estimated as the slope of the line fit for each sedimentation plot. The velocities for different volume RBC rates are shown in figure 5.
Figure 4.

Measured RBC sedimentation for different volume RBC rates. After blood plasma is replaced by centrifuge, buffer solution is added to make the suspensions with volume RBC rates of 0.5, 0.25, 0.13, 0.06, 0.03, 0.01.
Figure 5.

Plot of sedimentation velocity as a function of volume RBC rate. Fit curves are y = a(1 − x)n (n = 2,3,4,5), based on the assumption that the sedimentation velocity ΔV RBC = 0 at ρRBC = 1.
Fit curves for y = a(1 − x)n (n = 2, 3, 4, 5) are calculated to model the sedimentation velocity ΔVRBC as a function of ρ RBC, assuming that the sedimentation velocity should approach asymptotically to 0 as ρRBC gets closer to 1. Comparing the lines in figure 5, we use
| (22) |
as the model to express sedimentation velocity as a function of the volume RBC rate.
Blood viscosity measurement
When ΔVRBC = 0, the RBC suspension can be treated as a continuous medium, and the total viscosity ηRBC is given as the summation of the medium viscosity and the partial viscosity as:
| (23) |
By definition,
| (24) |
The relation between volume RBC rate ρRBC and blood viscosity ηRBC has been expressed in many formulas including linear [25], quadratic [28] and exponential [29] functions. One of the simplest is a linear expression given by Einstein [25]:
| (25) |
We performed a measurement to find the blood viscosities as a function of RBC volume rates. Viscosities are measured for different shear rates ranging from 2/s to 750/s. A cone plate viscometer (DV-I+, Brookefield, Middleboro, MA) was used for the measurement. Figure 6 shows the measured data. We used simple linear fit similar to Einstein’s model to estimate the function that gives the viscosity.
Figure 6.

Measured viscosity as a function of RBC volume rate plotted for different shear rates. Viscosities are measured with a cone plate viscometer (DV-I+, Brookefield, Middleboro, MA). A linear fit for each viscosity plot is also shown.
We assume the shear rate of a moving rare cell to be in the order of ΔVcell/Rcell, with the cell radius of R cell = 7.5×10⁻⁶ m and the approximated cell velocity ΔVcell of ~10×10−6 m/s. We use the line fit at a shear rate of 2/s as the viscosity model in the following simulation, namely:
| (26) |
Comparing (23) and (26), we find:
| (27) |
| (28) |
Other viscosity model such as a quadratic [28] or an exponential [29] function could be also used for (27) and (28). Note that the drag force in (17) is exactly given by the measured total viscosity ηRBC when ΔVRBC = 0. Our viscosity model is to extend the use of (27) and (28) to the cases where ΔVRBC ≠ 0 as well to calculate the total drag force expressed in (17).
RESULTS AND DISCUSSION: SIMULATION AND EXPERIMENTALVERIFICATIONS
Blood sedimentation in bent tubes
In order to verify the efficacy of our mathematical model, we simulated RBC sedimentation in a simple bent tube, and the results are compared with experimental observations. The micro channel model is a bent tube with inside diameter of 1.6 mm. The radius of the bent curvature is 20 mm. An RBC suspension with a volume rate of 0.02 starts flowing in a bent tube, which is initially filled with a medium at t = 0 s. Three dimensional model of the bent tube is built with 85×85×20 control volumes as shown in Figure 1. The program is made on MATLAB, and the calculation was made to update the distribution of volume RBC rates with each time step of 0.01s. Photographs and simulation results are shown in figure 7 for time points at t = 20 s, 80 s, 140 s. Simulation shows a good agreement with the measurements especially when sedimentation is well grown in the tube at t = 140 s.
Figure 7.

Comparative experiments of blood sedimentation in a bent tube. Photographs (preferred to be viewed in color) taken at (a) 20s, (b) 80s and (c) 140s. Simulation results at (d) 20s, (e) 80s and (f) 140s.
Device model of rare cell separation
We applied above described analytical model to assess the efficacy of cancer cell separation systems we described in a previous publication [12]. Figure 8(a) shows a schematic photograph of the microfluidic device for immunomagnetic assay-based cell separation. The details of the setup are described in [12]. The microchannel is made of Polydimethylsiloxane (PDMS). A 150 μm thick glass cover slip is bonded to serve as the substrate or the “capture plane.” The channel height and width are h = 500 μ m and w = 17 mm, respectively. Three NdFeB block magnets with maximum energy product of 42 MGOe (grade N42) are arranged in parallel to have alternate polarities. Other important dimensions are indicated in the three dimensional device model created for a finite element analysis software COMSOL shown in figure 8(b). Figure 8(c) is a flow velocity magnitude calculated with the sample flow rate of Q =10mL/hour. The average flow velocities is given as
Figure 8.

Configuration of the microfluidic immunomagnetic separation device. (a) Photograph of the microfluidic device. (b) Three dimensional model created for a finite element analysis software COMSOL. (c) Flow velocity magnitude [mm/s] and (d) Magnetic field flux density [T] simulated with COMSOL.
| (29) |
The velocity is within the typical values of those found in previous studies of microchip-based separators [6–11], where the velocities in the order of 10−6 m/s [11] ~ 10−3 m/s [6] have been demonstrated. Figure 8(d) is the magnetic field flux density. We used a gauss meter to measure the magnetic field induced by one magnet, and the obtained intensity value was used for the calculation of the three magnets. Both figure 8(c) and (d) are plotted for a z-plane 250μm away (middle of the channel height) from the bottom surface of the channel.
The unique feature we introduce here is that we use the microdevice in two configurations: upright and inverted channel positions. In this way we can change the direction of gravity with regard to the magnetic force. When the channel is inverted, the RBCs will settle down in the opposite direction to that of the cancer cells being attracted to the direction toward the magnets. The role of gravity is to effectively separate RBCs and tumor cells.
Computational analysis of rare cell separation
Figure 9 and 10 show the results of RBC sedimentation in the upright and inverted microchannels. The three dimensional model of the microchannel (see figure 8(b)) is divided into 20 (x-axis) × 60 (y-axis) × 20 (z-axis) control volumes. The channel is initially filled with medium without any RBCs. A RBC suspension with a rate of ρRBC = 0.5 is flown in the channel at 10 mL/hour starting at the time point of t = 0 s. As one can see for the upright channel case in figure 9(a) and figure 10(a), RBC sedimentation gradually covers the bottom substrate “capture plane” (indicated as blue lines). On the other hand with the inverted channel in figure 9(b) and figure 10(b), there is a separation between the bottom substrate and the RBC stream. Note that it is preferable that the “capture plane,” i.e. the substrate, should not be covered with viscous layer of RBC sedimentation.
Figure 9.

Simulated sedimentation result for the (a) upright and (b) inverted channels at the center y-plane are shown for time points of 20s, 40s and 80s. The upright channel makes thicker sedimentation layer on the bottom substrate and the corner near the inlet.
Figure 10.

Three dimensional presentation of sedimentation in (a) upright and (b) inverted channels at 270s is also shown. Part of 20 (x-axis) × 60 (y-axis) × 20 (z-axis) control volumes are shown.
Here we discuss the efficacy of rare cell separation with the microchip. The RBC sedimentation pattern changes depending on the time point of the simulation. Capture rates are calculated for different time points when a cell enters the inlet.
We assume the density of a cancer cells to be dcell =1.077×10³ kg/m3, as in [5]. Additional gravitational force acting on a cancer cell is given by subtracting buoyancy force as:
| (30) |
Where g is the acceleration of gravity g = 9.8m/s2 and the medium density is considered to be dwater =1.00×10³ kg/m3.
On the other hand, according to our simulation, the value for ∇B2 is around ∇B2 =10 ~ 70[T2/m]at the bottom of the channel. The magnetic force in Z-direction is roughly estimated to be
| (31) |
which is nearly 100 times larger than the gravitational force. We neglected the gravitational force in the simulation.
The effect of magnetic force on RBCs are also discussed in literatures [3,4,9]. The key parameters of RBC density and volumetric susceptibility are [4]:
| (32) |
| (33) |
where we take an average susceptibility of oxygenated and deoxygenated RBCs. The gravitational force and magnetic force on RBCs are calculated as:
| (34) |
| (35) |
One can expect that RBC sedimentation could be affected at about 10% by the magnetic force. Considering the variations found in the measured sedimentation velocity and the mathematical model we used here (see figure 5), effect of 10% is still within the range of measurement errors, and small enough to be neglected to simplify the calculation process. In the following simulation, we did not take magnetic force on RBCs into account.
Figure 11(a) and (b) are examples of trajectories of cells that are released at t = 270 s in the upright channel and the inverted channel, respectively.
Figure 11.

Side-view cell trajectories of the CTCs that are released at a time point of t = 270s for the (a) upright and (b) inverted channels. Three-dimensional views of trajectories are also shown for the upright and inverted channels. Position of the magnets (cyan lines) and shape of the microchannel (black lines) are included.
Experimental verification
In order to evaluate the significance of our analytical method, we performed comparative experiments of real cancer cell separation and computational simulations with different channel orientations, flow rates, and the channel design. The conditions used here are:
Upright, flow rate 10mL/hour, standard channel (channel width = 17 mm)
Inverted, flow rate 10mL/hour, standard channel (channel width = 17 mm)
Inverted, flow rate 5mL/hour, standard channel (channel width = 17 mm)
Inverted, flow rate 10mL/hour, half-wide channel (channel width = 8.5 mm),
For each condition, we performed two experiments with the real microchannel. The detail of the experimental protocol is reported elsewhere [12]. Noteworthy is that we used a rotational holder to place microchannels in an inverted or upright position. A 100μL aliquot of cancer cell suspension that contains an average of 150 Colo205 cells is spiked in 2.5mL of healthy blood sample. Blood plasma was replaced with buffer solution. Care was taken when we removed plasma after the centrifugal process, not to disturb the thin layer between plasma and RBC and to save rare cells contained there. The number of magnetic particles N attached to a rare cell depends on several experimental conditions such as the type of the rare cell, the amount of antigen expression on the cell surface, concentration of introduced magnetic nanoparticles, etc. We first found N = 20,000 to match the simulation and experimental rare cell capture rates for the condition (a), then the same condition of N = 20,000 was used for all the other conditions of (b)–(d). Note that in the case of our simulation, the capture rate is a monotonically increasing function of N.
The RBC sedimentation calculated for the conditions (a)–(d) is shown in figure 12. Maps of the captured CTCs are shown in figure 13 for both experiments and simulations. For the experiments, locations of the captured cells are recorded with a mechanical positioning stage. Experiments and simulations match well for all the conditions, showing the efficacy of our computational analytical method. Comparison of (a) and (b) shows that the capture efficiency of upright channel is significantly low, which can be attributed to the very high viscosity of the dense RBC layer that covers the capture plane. As one can see from figure 6, viscosity is more than 20cP when the volume RBC rate becomes more than 0.5. The effect of flow rates can be found in comparison of (b) and (c). One may expect a higher capture rate for the lower flow rate. However, interestingly, the lower flow rate of 5 mL/hour creates a thicker layer of RBCs which slow motion of cancer cells. The capture rate with 5 mL/hour resulted in a comparable value as with 10mL/hour. (d) was performed with a half-wide microchannel, which makes average flow velocity two times faster than (b). The capture rate in this case also stayed similar to the standard condition of (b). The results suggest that the orientation of the gravity makes a large effect on the capture rate in microchannels.
Figure 12.

Red blood cell sedimentation calculated for four conditions (a)–(d) with different channel orientations, flow rates, and the channel design.
Figure 13.

Simulated and experimental maps of the captured CTCs compared for the four different conditions (a)–(d). For the simulation, 150 cells are randomly released on the plane at the inlet. In the experiments, an average of 150 cells are spiked into blood. The simulated results show good agreements with the experimental results, in terms of the number of captured cells and the distributions.
CONCLUSION
We have demonstrated a computational model to evaluate the efficacy of microfluidic device that separate rare cells from blood. We performed sedimentation and viscosity measurements to build a mathematical model that has been applied to segmented control volumes in the computational field. Based on the method, we performed a three dimensional simulation of rare cell separation in a micro fluidic device. Simulations have been performed for different channel orientations, flow rates, and the channel designs. The result showed excellent agreements with the real experiments, demonstrating the relevance of our computational analytical method. We showed that the direction of gravity takes an important role in an immunomagnetic separation system. We evaluated the separation efficacy of two types of gravity configurations with inverted and upright channels. We conclude that the performance of the separation device can be effectively enhanced by inverting the microchannel to properly direct blood sedimentation.
Acknowledgments
We thank Ms. Nancy Lane, Drs Michael Huebschman, Jonathan W. Uhr and Eugene P. Frenkel of the University of Texas Southwestern Medical Center for their discussions and support in clinical applications and validation of the presented methods. We also thank Dr Konstantin V. Sokolov of the University of Texas at Austin for their fruitful discussions, Dr. Hirofumi Tanaka of the University of Texas at Austin for his help in measuring blood viscosities and Dr. Rodney S. Ruoff’s laboratory of the University of Texas at Austin for his help in the COMSOL simulation. We are grateful for the financial support from National Institute of Health (NIH) National Cancer Institute (NCI) Cancer Diagnosis Program under the grant 1R01CA139070.
References
- 1.Srinivasan V, Pamula VK, Fair RB. Lab Chip. 2004;4:310–315. doi: 10.1039/b403341h. [DOI] [PubMed] [Google Scholar]
- 2.Ahn CH, Choi JW, Beaucage G, NEVIN JH, Lee JB, Puntambekar A, Lee JY. Proc IEEE. 2004;92:154–173. [Google Scholar]
- 3.Han KH, Frazier AB. Lab Chip. 2006;6:265–273. doi: 10.1039/b514539b. [DOI] [PubMed] [Google Scholar]
- 4.Furlani EP. J Phys D: Appl Phys. 2007;40:1313–1319. [Google Scholar]
- 5.Mostert B, Sleijfer S, Foekens JA, Gratama JW. Cancer Treat Rev. 2009;35:463–474. doi: 10.1016/j.ctrv.2009.03.004. [DOI] [PubMed] [Google Scholar]
- 6.Yung CW, Fiering J, Muellerb AJ, Ingber DE. Lab Chip. 2009;9:1171–1177. doi: 10.1039/b816986a. [DOI] [PubMed] [Google Scholar]
- 7.Furdui VI, Harrison DJ. Lab Chip. 2004;4:614. doi: 10.1039/b409366f. [DOI] [PubMed] [Google Scholar]
- 8.Karl S, David M, Moore L, Grimberg BT, Michon P, Muellter I, Zborowski M, Zimmerman PA. Malar J. 2008;7:66. doi: 10.1186/1475-2875-7-66. [DOI] [PMC free article] [PubMed] [Google Scholar]
- 9.Zborowski M, Fuh CB, Green R, Sun L, Chalmers JJ. Anal Chem. 1995;67:3702–3712. doi: 10.1021/ac00116a014. [DOI] [PubMed] [Google Scholar]
- 10.Zborowski M, Chalmers J. J Anal Chem. 2011;83:8050–8056. doi: 10.1021/ac200550d. [DOI] [PMC free article] [PubMed] [Google Scholar]
- 11.Kim KS, Park JK. Lab Chip. 2005;5:657–664. doi: 10.1039/b502225h. [DOI] [PubMed] [Google Scholar]
- 12.Hoshino K, Huang YY, Lane N, Huebschman M, Uhr JW, Frenkel EP, Zhang XJ. Lab Chip. 2011;11:3449–3457. doi: 10.1039/c1lc20270g. [DOI] [PMC free article] [PubMed] [Google Scholar]
- 13.Nagrath S, et al. Nature. 2007;450:1235–1239. doi: 10.1038/nature06385. [DOI] [PMC free article] [PubMed] [Google Scholar]
- 14.Stott SL, et al. Proc Natl Acad Sci USA. 2010;107:1012539. [Google Scholar]
- 15.Whittington RB. Proc R Soc B. 1942;131:183–190. [Google Scholar]
- 16.Westergren A. Triangle. 1957;3:20–5. [PubMed] [Google Scholar]
- 17.Brigden ML. Am Fam Physician. 1999:1443–50. [PubMed] [Google Scholar]
- 18.Lowe GDO, Lee AJ, Rumley A, Price JF, Fowkes FGR. Brit J Haematol. 1997;96:168–173. doi: 10.1046/j.1365-2141.1997.8532481.x. [DOI] [PubMed] [Google Scholar]
- 19.de Simone G, Devereux RB, Chien S, Alderman MH, Atlas SA, Laragh JH. Circulation. 1990;81:107–117. doi: 10.1161/01.cir.81.1.107. [DOI] [PubMed] [Google Scholar]
- 20.Pries AR, Neuhaus D, Gaehtgens P. Am J Physiol Heart Circ Physiol. 1992;263:H1770–H1778. doi: 10.1152/ajpheart.1992.263.6.H1770. [DOI] [PubMed] [Google Scholar]
- 21.Fang H, Wang Z, Lin Z, Liu M. Phys Rev E. 2002;65:051925. doi: 10.1103/PhysRevE.65.051925. [DOI] [PubMed] [Google Scholar]
- 22.Ouared R, Chopard B. J Stat Phys. 2005;121:209–221. [Google Scholar]
- 23.Sun C, Munn LL. Biophys J. 2005;88:1635–1645. doi: 10.1529/biophysj.104.051151. [DOI] [PMC free article] [PubMed] [Google Scholar]
- 24.Tsubota K, Wada S, Kamada H, Kitagawa Y. J Earth Simulat. 2006;5:2–7. [Google Scholar]
- 25.Einstein A. Investigation on the Theory of Brownian Movement. Dover; New York: 1956. [Google Scholar]
- 26.Rosenberg R, Gertler R, Friederichs J, Fuehrer K, Dahm M, Phelps R, Thorban S, Nekarda H, Siewert JR. Cytometry. 2002;49:150–158. doi: 10.1002/cyto.10161. [DOI] [PubMed] [Google Scholar]
- 27.Balic M, Dandachi N, Hofmann G, Samonigg H, Loibner H, Obwaller A, van der Kooi A, Tibbe AGJ, Doyle GV, Terstappen LWMM, Bauernhofer T. Cytom Part B-Clin Cy. 2005;68B:25–30. doi: 10.1002/cyto.b.20065. [DOI] [PubMed] [Google Scholar]
- 28.Batchelor GK. J Fluid Mech. 1977;83:97–117. [Google Scholar]
- 29.Mooney MJ. J Colloid Interface Sci. 1951;6:162–170. [Google Scholar]