Abstract
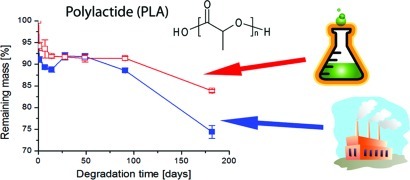
The rate of degradation of large-scale synthesized polylactide (PLA) of industrial origin was compared with that of laboratory-scale synthesized poly(L-lactide) (PLLA) of similar molar mass. The structural discrepancy between the two material types resulted in a significant difference in degradation rate. Although the hydrolysis of industrial PLA was substantially faster than that of PLLA, the PLA material became less brittle and fragmented to a lesser extent during degradation. In addition, a comprehensive picture of the degradation of industrial PLA was obtained by subjecting different PLA materials to hydrolytic degradation at various temperatures and pH’s for up to 182 days. The surrounding environment had no effect on the degradation rate at physiological temperature, but the degradation was faster in water than in a phosphate buffer after prolonged degradation at temperatures above the Tg. The degree of crystallinity had a greater influence than the degradation environment on the rate of hydrolysis. For a future use of polylactide in applications where bulk plastics are generally used today, for example plastic packages, the appropriate PLA grade must be chosen based on the conditions prevailing in the degradation environment.
Keywords: polymer materials, biodegradable, degradation, polylactide, packaging applications
Introduction
The possibility of replacing current bulk plastics with biodegradable and renewable polymers has been revived during the past decade. The development of economically feasible industrial production processes has made polylactide (PLA) one of the most promising alternatives for environmentally friendly plastic packages and devices.1−4 Some challenges remain, however, and research has recently focused on, for example, improving the impact resistance and ductility5−7 or increasing the crystallization rate.8,9 Preferably, PLA-based materials should have sufficient mechanical properties but also degrade throughout or instantly after the application period. The hydrolytic degradation of PLA has been studied intensively10 and was early found to be dependent on several factors including the morphology,11 degree of crystallinity,12 molar mass,12 hydrophobicity,13 size and geometry of the samples,14 stereocomplex formation,15 and conditions in the degradation environment such as pH and temperature.13 Although much is known of the degradation of PLA in general and poly(L-lactide) (PLLA) in particular, less attention has been paid to the differences in degradation between industrially produced PLA and PLLA. PLA of industrial origin is generally a stereocopolymer with some percentage of D-units in the poly(L-lactide) chain and has higher molar mass distribution. Industrial PLA is also formulated with a stabilizer, a nucleating agent, and other additives important for processing and stability. These additives are known to be important contributors to the degradation of PLA-type polymers. For the future sustainable use of industrial PLA, a full understanding of the degradation is required. We have previously evaluated the degradation and degradation product patterns of commercial stereocomplex PLA and plain PLA.16 The aim of the present work was to reveal the differences in the hydrolytic degradation between industrial polylactide and laboratory-scale synthesized poly(L-lactide). The key question is whether the knowledge of the degradation of PLLA is directly transferable to the degradation of industrial PLA. In addition, we intended to obtain a comprehensive picture of the influence of the environment and polymer grade on the rate of degradation of polylactides with similar molar mass. Thus, two types of PLA materials with different D-contents, a 50:50 blend thereof, and synthesized poly(L-lactide) as reference material were subjected to hydrolytic degradation at various temperatures and pH’s. The molar mass of the materials was similar but the molar mass distribution and the D-content were different.
Experimental Section
Materials
The industrial polylactides used in this study were commercial products from Nature Works Co. LLC USA (3051D and 3001D). The D-content of the two PLA materials was determined using a Perkin-Elmer polarimeter 343 equipped with a sodium lamp at a wavelength of 589 nm according to a previously described method.17,18 PLLA was synthesized via ring-opening polymerization from L-lactide.19 Chloroform (CHCl3) (HPLC grade, Fischer Scientific), methanol (AR, BDH Prolabo), acetonitrile (J.T. Baker), hydrochloric acid (HCl) (Fischer) and D,L-2-hydroxyvaleric acid sodium salt (Aldrich) were used as received. Dulbeccós Phosphate Buffered Saline (PBS, Cat. No. H15–011, PAA laboratories, Austria) and FeSSIF acetate buffer (Phares, Switzerland) were diluted and pH adjusted to 7.4 and 5, respectively. Water for chromatography (Merck) was used as received.
Sample Preparation
Polymer films were prepared by dissolving 2 g PLA chloroform to a 5% (w/w) solution and subsequent solution-casting in silanized glass molds. The solvent was evaporated, and the films were dried under reduced pressure (0.5 × 10⁻³ mbar) for 1 week. Circular samples with a diameter of 10 mm and a thickness of approximately 250 μm were punched from the films.
Hydrolysis
The PLA samples were subjected to hydrolytic degradation in different environments and temperatures. Each specimen was placed in a vial containing 10 mL of degradation medium, sealed with a butyl/PTFE septum and aluminum lid and placed in a thermostatically controlled oven. At predetermined time intervals, between 1 and 182 days, triplicate samples of each material were withdrawn from the test environment, dried under vacuum, and subjected to the various analyses.
Mass Loss
The degradation was followed by determining the residual mass of the samples at the predetermined times. After withdrawing the samples from the hydrolysis medium, the solid samples were dried to constant weight under reduced pressure. The percentage mass loss, Δmd, was determined by comparing the dry mass (md) at the specific time with the initial mass (m0) according to
| 1 |
Size Exclusion Chromatography (SEC)
The molar mass changes of the PLA samples were analyzed with a Verotech PL-GPC 50 Plus system equipped with a PL-RI Detector and two PolarGel-M Organic (300 × 7.5 mm) columns from Varian. The samples were injected with a PL-AS RT Autosampler for PL-GPC 50 Plus and THF was used as mobile phase (1 mL/min, 35 °C). Calibration was achieved using narrow molar mass distribution polystyrene standards with molar masses in the range of 162–400 000 g/mol. Corrections for the flow rate fluctuations were made using toluene as an internal standard. CirrusTM GPC Software was used to process the data. The kinetics of degradation was investigated assuming an exponential decrease of Mn according to20,21
| 2 |
Differential Scanning Calorimetry (DSC)
The thermal properties were investigated using a DSC (Mettler Toledo DSC 820 module) under nitrogen atmosphere. Two to six milligrams of the sample was placed in a 40 μL aluminum cap without pin and sealed with a lid. Samples were heated under a nitrogen flow of 50 mL/min from 0 to 200 °C at a rate of 10 °C, held at 200 °C for 2 min, thereafter cooled to 0 °C at a rate of 10 °C, and held at the lowest temperature for 2 min. Finally, the samples were heated from 0 to 200 °C at a rate of 10 °C. Triplicate samples were analyzed at each time point. The melting temperature was noted as the maximum value from the first heating scan, and the glass transition temperature was taken as the midpoint of the glass transition. The approximate degree of crystallinity of the samples was calculated according to
| 3 |
where wc is the degree of crystallinity, ΔHf is the heat of fusion of the sample, and ΔHf0 is the heat of fusion for a 100% crystalline polymer. The value used for ΔHf0 was 93 J/g.11
Results and Discussion
The degradation rates of both the industrial PLA and the laboratory-scale synthesized PLLA as well as the influence of environment and polymer grade on the rate of degradation were evaluated during 182 days of hydrolytic degradation. Of the many commercially available PLA grades, two different materials with different D-contents, a 50:50 blend thereof, and PLLA as reference material were selected and subjected to hydrolysis in different media and at different temperatures (Table 1). The molar mass of the materials was similar but the molar mass distribution and the D-content were different. The two PLA materials, 3051D and 3001D, had D contents of 4.5% and 1.6%, respectively. In general, the PLA material degraded faster than PLLA but the latter became more brittle and fragmented more extensively after prolonged degradation.
Table 1. Polymer Material Properties before Hydrolysis and Conditions Used for Determining the Degradation of Industrial Polylactide (PLA) and Laboratory-Scale Synthesized Poly(L-lactide) (PLLA).
| PLA type | degradation medium | Mn(g/mol)b | Mw/Mnb | Tm (°C)c | wc (%)c | Tg (°C)d |
|---|---|---|---|---|---|---|
| Characteristics of the Industrial PLA and the Laboratory-Scale Synthesized PLLA | ||||||
| 3051D (4.5% D-LA) | H2O, 37 °C | 96 400 ± 600 | 2.11 ± 0.01 | 142.2 ± 4.6 | 6.8 ± 0.8 | 45.2 ± 0.0 |
| PBSa, pH 7.4, 37 °C | ||||||
| PLLA | H2O, 37 °C | 85 600 ± 100 | 1.16 ± 0.01 | 170.3 ± 0.8 | 49.4 ± 1.1 | 47.5 ± 0.2 |
| PBSa, pH 7.4, 37 °C | ||||||
| influence of degradation environment | ||||||
| 3051D (4.5% D-LA) | H2O, 37 °C | 96 400 ± 600 | 2.11 ± 0.01 | 142.2 ± 4.6 | 6.8 ± 0.8 | 45.2 ± 0.0 |
| H2O, 60 °C | ||||||
| PBSa, pH 7.4, 37 °C | ||||||
| PBSa, pH 7.4, 60 °C | ||||||
| PBSa, pH 7.4, 80 °C | ||||||
| pH 5, 60 °C | ||||||
| Influence of PLA Grade | ||||||
| 3051D (4.5% D-LA) | H2O, 60 °C | 96 400 ± 600 | 2.11 ± 0.01 | 142.2 ± 4.6 | 6.8 ± 0.8 | 45.2 ± 0.0 |
| 3001D (1.6% D-LA) | H2O, 60 °C | 89 300 ± 1000 | 1.77 ± 0.02 | 160.9 ± 1.6 | 45.9 ± 1.3 | 47.9 ± 0.5 |
| 3051D:3001D 50:50 blend | H2O, 60 °C | 89 800 ± 2000 | 1.94 ± 0.01 | 157.4 ± 2.2 | 37.9 ± 2.3 | 47.1 ± 3.9 |
Phosphate buffered solution.
Determined by THF-SEC calibrated with narrow molar mass polystyrene standards.
Determined by DSC from the first heating scan.
Determined by DSC from the second heating scan.
Comparison Between Industrial PLA and Laboratory-Scale Synthesized PLLA
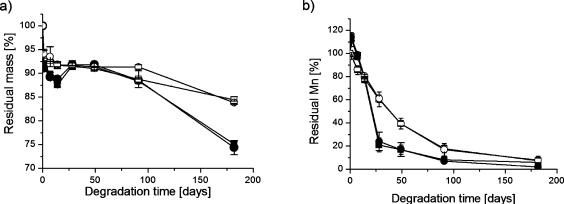
The hydrolytic degradation of the industrial polylactide (PLA) and of the laboratory-scale synthesized poly(L-lactide) (PLLA) was examined by monitoring the mass loss and molar mass changes during hydrolysis, Figure 1.
Figure 1.
(a) Residual mass and (b) residual molar mass as a function of degradation time during the hydrolysis of polylactide 3051D in (■) H2O at 37 °C (●) PBS at 37 °C, and PLLA in (□) H2O at 37 °C, (○) PBS at 37 °C.
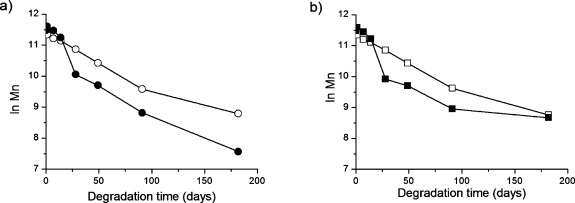
The mass loss of the PLA and PLLA materials was approximately the same during the first 49 days, but thereafter the mass loss was faster in the case of the PLA material. Differences in molar mass between commercial PLA and PLLA were also observed, but this divergence was more prominent than for mass loss and was observed at an earlier stage. After 28 days, the residual Mn of 3051D degraded in PBS at 37 °C was only 24% compared to 61% for PLLA degraded under the same conditions. The molar mass is a much better indicator of polymer degradation than mass loss because changes are observed at an earlier stage. Chain cleavage occurs continuously during degradation, but it is not until the molar mass falls below a certain value that the oligomers become water-soluble and diffuse into the surrounding medium. For PLA, we have estimated this value to be approximately 1000 g/mol corresponding to oligomers with 13 repeating LA units.22 This was also evident in the very large differences between the mass loss and molar mass loss profiles at 37 °C (cf. Figure 1a, b). The residual Mn for 3051D degraded in PBS at 37 °C for 91 days was only 7%, whereas 88% of the original mass was still retained. This large difference clearly emphasizes the importance of determining the molar mass as well as the mass loss when performing degradation studies. The molar mass changes were also used to estimate the average hydrolytic degradation rate constant (k) values, cf. Equation 2. These were calculated from the logarithmic Mn values as a function of degradation time (Figure 2).
Figure 2.
(a) Logarithmic number average molar mass of (●) 3051D and (○) PLLA in PBS at 37 °C, and (b) for (■) 3051D and (□) PLLA in H2O, during the hydrolysis at 37 °C.
The logarithmic Mn profiles of the PLA and PLLA materials were significantly different. The commercial PLA had different Mn decrease rates during early (0–14 days) and later degradation (14–182 days) in both PBS and H2O. The decrease rate of the PLLA material, however, was the same up to 91 days where after it seems to slow down. Due to the absence of data points beyond 182 days, the approximate k values up to 91 days were determined for comparison (Table 2).
Table 2. Hydrolytic Degradation Rate Constant (k) Values for Industrial Polylactide (PLA) and Laboratory-Scale Synthesized Poly(L-lactide) (PLLA).
|
k × 102 (days–1) |
|||||||
|---|---|---|---|---|---|---|---|
| PLA type | degradation medium | 0–14 days | r | 14–91 days | r | 0–91 days | r |
| 3051D(4.5% D-LA) | PBS, 37 °C | 2.8 | 0.99 | 2.0 | 1.00 | ||
| H2O, 37 °C | 2.9 | 0.99 | 1.6 | 0.98 | |||
| PLLA | PBS, 37 °C | 2.0 | 1.00 | ||||
| H2O, 37 °C | 1.9 | 1.00 | |||||
The k values for the commercial PLA was significantly higher during early degradation but relatively similar to the corresponding values for the PLLA material during later degradation (14–91 days). The two regions of different Mn decrease rates coincide with a large drop in molar mass between 14 and 28 days (cf. Figure 1). The residual Mn of 3051D degraded in PBS at 37 °C decreased from 79% to 24% between 14 and 28 days. Different k values during different degradation periods have been observed previously for PLA.23 Reported k values for PLLA are typically 1 order of magnitude lower than the estimated k values in this work.23,24 This difference is due to that the experiment was set up as a batch run where the degradation medium was not replaced during degradation. The acidic degradation products are then accumulated in the solutions and catalyze the further degradation. The batch run setup was chosen to allow for determining the degradation products formed during hydrolysis. If the degradation medium had been continuously exchanged, approximate k values of 1 × 10⁻³ would have been expected as observed in previous work from our group on related materials.25
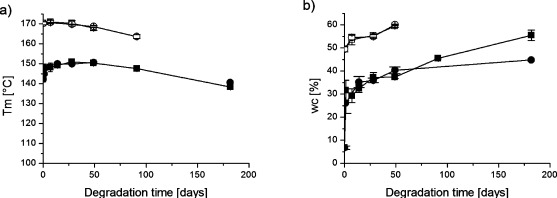
The observed differences in the degradation rates between the PLA materials were primarily due to the higher degree of crystallinity and also to the lower dispersity of PLLA, which decrease the degradation rate. The incorporated D-units in the PLA material perturb the crystallization process and thereby reduce the degree of crystallinity. It is well-known that the degradation of semicrystalline polyesters starts in the amorphous regions and continues in the crystalline regions when almost all the amorphous parts have been degraded. This may also be seen in the thermal properties of the PLA materials, where the effect of hydrolysis on the melting point, Tm, and on the degree of crystallinity, wc, were determined (Figure 3).
Figure 3.
(a) Melting temperature and (b) degree of crystallinity as a function of degradation time for polylactide 3051D in (■) H2O at 37 °C (●) PBS at 37 °C, and PLLA in (□) H2O at 37 °C, (○) PBS during hydrolysis at 37 °C.
Prior to degradation, the PLLA material had a much higher melting temperature and a greater degree of crystallinity than the PLA material. These differences were maintained during the degradation with a gradual decrease in Tm and an increase in wc for both material types. Somewhat surprisingly, the wc for 3051D increased very rapidly from 7% to 26% and 32% already after 1 day of degradation in PBS and water, respectively. The aqueous environment and slightly raised temperature obviously allowed a recrystallization of the PLA material. From one day and onward, the trends in wc were similar for both PLA and PLLA. These findings are in line with previously reported results that the incorporation of small amounts of D-units in the poly(L-lactide) chain enhance the hydrolytic degradation.23,26 The higher the D-content, the faster a difference in rate of degradation is observed.26 The higher molar distribution of the industrial PLA also influenced the rate of degradation. The Mw/Mn value of only 1.16 for laboratory-scale PLLA results in a very homogeneous material where there are more restricted access for water molecules to penetrate and induce hydrolysis.
Degradation Environment
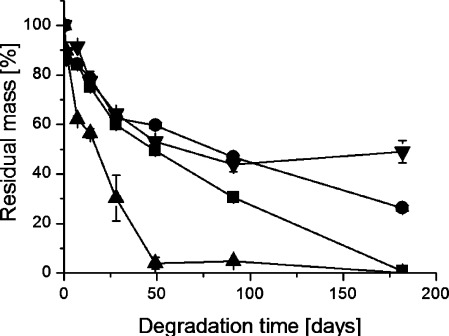
In order to further evaluate the degradation of industrial PLA, the mass loss and the molar mass changes of the 3051D PLA material in different environments was monitored (Figure 4, molar mass changes shown in Supporting Information).
Figure 4.
Residual mass as a function of degradation time during hydrolysis of polylactide 3051D in (■) H2O at 60 °C, (●) PBS at 60 °C, (▲) PBS at 80 °C, and (▼) pH 5 buffer at 60 °C.
The rate of mass loss increased with increasing degradation temperature. Only 4% of the original mass remained after 49 days of degradation at 80 °C compared to 88% after the same period of degradation at 37 °C (Figure 1a). The corresponding value for PLA degraded at 60 °C was 47%. Thus, there was a significant difference in degradation rate between 60 and 80 °C although both temperatures are above the Tg of the polymer. This means that the temperature as such influenced the degradation rate and that the difference between 37 and 60 °C was not solely because the degradation was respectively below and above the Tg. This has been discussed by several researchers, but the results have been ambiguous.27−30 For example, Weir et al.29 concluded that the degradation mechanism of PLLA was very similar below and above the Tg, whereas Agrawal et al.28 state that the degradation mechanisms were different. Lowering the pH from 7.4 to 5 did not influence the mass loss. This is somewhat unexpected because hydrolytic degradation of aliphatic polyesters is autocatalyzed by carboxylic end-groups generated by chain scission of the ester bonds.31 As observed previously, the buffering capacity of the PBS solution was somewhat restricted at the elevated temperature (60 °C) where degradation occurred relatively rapidly with a large formation of acidic degradation products and a fast drop in pH.16
The degradation environment had no influence on the mass loss or molar mass changes at 37 °C, but differences were observed at 60 °C. At 37 °C, the degradation rate was the same in water and in PBS (Figures 1a and 1b). This is in agreement with previous results on PLA32 but in contrast to what we observed for the amorphous, and thus more rapidly degrading, poly(but-2-ene-1,4-diyl malonate) (PBM) where the degradation was faster in deionized water than in PBS.33 When the temperature was raised to 60 °C, degradation was faster in water than in PBS, but this difference appeared first after 28 days of degradation for mass loss (Figure 4) and already after one day of degradation for molar mass changes (Figure 4). Apparently, a certain minimum degradation rate is needed for a difference in degradation rate between water and PBS to be observed. This was also observed in the case of the melting temperature and degree of crystallinity at 60 °C (data shown in the Supporting Information).
PLA Grade
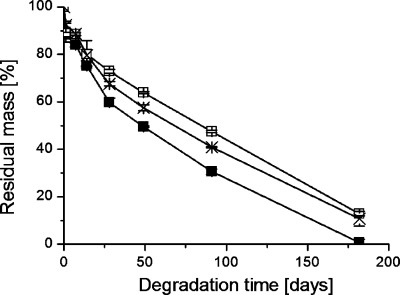
Finally, the influence of different PLA grades on the degradation rate was determined. The residual mass of the PLA grades 3051D and 3001D and of their 50:50 blend is shown in Figure 5.
Figure 5.
Residual mass as a function of degradation time during hydrolysis of (■) polylactide 3051D, (□) polylactide 3001D, and ( × ) 50:50 blend of polylactide 3051D and 3001D in H2O at 60 °C.
The polylactide 3051D with a D-content of 4.5% had a faster mass loss rate than 3001D with a D-content of 1.6%. The 50:50 blend was intermediate between its two components. It is interesting to note, however, that the difference appeared from 28 days and onward, whereas the mass loss of 3051D was constant until 49 days of degradation in different media (cf. Figure 4). Thus, the morphology had a greater influence on the degradation rate with respect to mass loss at 60 °C than the hydrolysis medium. As in the case of mass loss, the PLA grade influenced the melting temperature profile during degradation (data shown in the Supporting Information).
The polylactide 3001D with a D-content of 1.6% had a higher melting point than 3051D with a D-content of 4.5% and this difference remained during hydrolysis. The 50:50 blend was intermediate between its two components. Although the melting temperatures of the two materials differed, the melting temperature profiles were similar for all the materials. This means that the initial difference in material properties was maintained throughout the life span of the material. It is worth mentioning that the difference in wc between PLLA and 3001D was relatively small; 49 and 46%, respectively (cf. Table 1). A larger difference would be expected due to their difference in D-content; 0% and 1.6% respectively. The relatively high wc of 3001D may be due to an added nucleating agent and this further illustrates the important differences between industrial and laboratory-scale PLA materials.
Conclusions
The rate of degradation of industrial polylactide (PLA) was substantially faster than that of laboratory-scale synthesized poly(L-lactide) with similar molar mass. Incorporation of small amounts of D-units in the poly(L-lactide) chain and higher molar mass distribution enhanced the hydrolytic degradation. Despite this, the PLA material maintained its physical properties for a longer period of time than PLLA, which fragmented into small pieces earlier. A comprehensive picture of the rate of degradation of industrial PLA was established. The degradation was faster in water than in PBS after prolonged degradation at temperatures above the Tg. The degree of crystallinity had a greater influence than the degradation environment on the hydrolysis rate. The molar mass of the PLA materials decreased very rapidly and significantly faster than the mass loss, and this effect was observed regardless of temperature.
Thus, predicting the degradation of industrial PLA based on a knowledge of laboratory-scale synthesized PLLA is not straightforward, and the appropriate PLA grade must be chosen on the basis of the conditions prevailing in the degradation environment.
Acknowledgments
The authors gratefully acknowledge The Swedish Research Council, VR (Grant A0347801) and the ERC Advanced Grant, PARADIGM (Grant 246776) for their financial support of this work.
Supporting Information Available
Additional data on the influence of degradation environment and PLA grade on the hydrolytic degradation. This material is available free of charge via the Internet at http://pubs.acs.org
The authors declare no competing financial interest.
Supplementary Material
References
- Albertsson A.-C.; Varma I. K. Biomacromolecules 2003, 4, 1466–1486. [DOI] [PubMed] [Google Scholar]
- Vink E. T. H.; Rabago K. R.; Glassner D. A.; Gruber P. R. Polym. Degrad. Stab. 2003, 80, 403–419. [Google Scholar]
- Vink E. T. H.; Rabago R.; Glassner D. A.; Springs B.; O’Connor R. P.; Kolstad J.; Gruber P. R. Macromol. Biosci. 2004, 4, 551–564. [DOI] [PubMed] [Google Scholar]
- Södergård A.; Stolt M., Industrial Production of High Molecular Weight Poly(Lactic Acid). In Poly(Lactic Acid): Synthesis, Structures, Properties, Processing, and Applications; Auras R., Lim L. T., Selke S. E. M., Tsuji H., Eds.; John Wiley & Sons: Hoboken, NJ, 2010; pp 27–24. [Google Scholar]
- Anderson K. S.; Schreck K. M.; Hillmyer M. A. Polym. Rev. 2008, 48, 85–108. [Google Scholar]
- Chang K.; Robertson M. L.; Hillmyer M. A. ACS Appl. Mater. Interfaces 2009, 1, 2390–2399. [DOI] [PubMed] [Google Scholar]
- Robertson M. L.; Paxton J. M.; Hillmyer M. A. ACS Appl. Mater. Interfaces 2011, 3, 3402–3410. [DOI] [PubMed] [Google Scholar]
- Hu X.; An H.; Li Z.-M.; Geng Y.; Li L.; Yang C. Macromolecules 2009, 42, 3215–3218. [Google Scholar]
- Xu Z.; Niu Y.; Wang Z.; Li H.; Yang L.; Qiu J.; Wang H. ACS Appl. Mater. Interfaces 2011, 3, 3744–3753. [DOI] [PubMed] [Google Scholar]
- Tsuji H., Hydrolytic Degradation. In Poly(Lactic Acid): Synthesis, Structures, Properties, Processing, and Applications; Auras R., Lim L. T., Selke S. E. M., Tsuji H., Eds.; John Wiley & Sons: Hoboken, NJ, 2010; pp 345–381. [Google Scholar]
- Fischer E. W.; Sterzel H. J.; Wegner G. Kolloid Z. Z. Polym. 1973, 251, 980–990. [Google Scholar]
- Pitt C. G.; Gratzl M. M.; Kimmel G. L.; Surles J.; Schindler A. Biomaterials 1981, 2, 215–220. [DOI] [PubMed] [Google Scholar]
- Reed A. M.; Gilding D. K. Polymer 1981, 22, 494–498. [Google Scholar]
- Li S.; Garreau H.; Vert M. J. Mater. Sci.: Mater. Med. 1990, 1, 123–130. [Google Scholar]
- Tsuji H. Polymer 2000, 41, 3621–3630. [Google Scholar]
- Andersson S. R.; Hakkarainen M.; Inkinen S.; Södergård A.; Albertsson A.-C. Biomacromolecules 2010, 11, 1067–1073. [DOI] [PubMed] [Google Scholar]
- Feng L.-D.; Sun B.; Bian X.-C.; Chen Z.-M.; Chen X.-S. Polym. Test. 2010, 29, 771–776. [Google Scholar]
- Odelius K. O., M.; Höglund A.; Albertsson A.-C.. J. Appl. Polym. Sci. 2012, in press.
- Odelius K.; Plikk P.; Albertsson A.-C. Biomacromolecules 2005, 6, 2718–2725. [DOI] [PubMed] [Google Scholar]
- Pitt C. G.; Gu Z. W. J. Controlled Release 1987, 4, 283–292. [Google Scholar]
- Ikada Y.; Tsuji H. Macromol. Rapid Commun. 2000, 21, 117–132. [Google Scholar]
- Höglund A.; Hakkarainen M.; Edlund U.; Albertsson A.-C. Langmuir 2010, 26, 378–383. [DOI] [PubMed] [Google Scholar]
- Saha S. K.; Tsuji H. Polym. Degrad. Stab. 2006, 91, 1665–1673. [Google Scholar]
- Saha S. K.; Tsuji H. Macromol. Mater. Eng. 2006, 291, 357–368. [Google Scholar]
- Dånmark S.; Finne-Wistrand A.; Schander K.; Hakkarainen M.; Arvidson K.; Mustafa K.; Albertsson A. C. Acta Biomater. 2011, 7, 2035–2046. [DOI] [PubMed] [Google Scholar]
- Vert M.; Chabot F.; Leray J.; Christel P. Makromol. Chem. 1981, 5, 30–41. [Google Scholar]
- Bergsma J. E.; Rozema F. R.; Bos R. R. M.; Boering G.; Joziasse C. A. P.; Pennings A. J. J. Mater. Sci.: Mater. Med. 1995, 6, 642–646. [Google Scholar]
- Agrawal C. M.; Huang D.; Schmitz J. P.; Athanasiou K. A. Tissue Eng. 1997, 3, 345–352. [Google Scholar]
- Weir N. A.; Buchanan F. J.; Orr J. F.; Farrar D. F.; Dickson G. R. Proc. Inst. Mech. Eng., Part H 2004, 218, 321–330. [DOI] [PubMed] [Google Scholar]
- Lyu S.; Schley J.; Loy B.; Lind D.; Hobot C.; Sparer R.; Untereker D. Biomacromolecules 2007, 8, 2301–2310. [DOI] [PubMed] [Google Scholar]
- Pitt C. G.; Chasalow F. I.; Hibionada Y. M.; Klimas D. M.; Schindler A. J. Appl. Polym. Sci. 1981, 26, 3779–3787. [Google Scholar]
- Andersson S. R.; Hakkarainen M.; Albertsson A.-C. Biomacromolecules 2010, 11, 3617–3623. [DOI] [PubMed] [Google Scholar]
- Höglund A.; Målberg S.; Albertsson A.-C. Macromol. Biosci. 2012, 12, 260–268. [DOI] [PubMed] [Google Scholar]
Associated Data
This section collects any data citations, data availability statements, or supplementary materials included in this article.


