

Abstract
Midbrain dopamine (MbDA) neurons are functionally heterogenous and modulate complex functions through precisely organized anatomical groups. MbDA neurons are generated from Wnt1-expressing progenitors located in the ventral mesencephalon (vMes) during embryogenesis. However, it is unclear whether the progenitor pool is partitioned into distinct cohorts based on molecular identity and whether the timing of gene expression uniquely identifies subtypes of MbDA neurons. In this study we show that Wnt1-expressing MbDA progenitors from E8.5–12.5 have dynamic molecular identities that correlate with specific spatial locations in the vMes. We also tested the hypothesis that the timing of Wnt1 expression in progenitors is related to the distribution of anatomically distinct cohorts of adult MbDA neurons using Genetic Inducible Fate Mapping (GIFM). We demonstrate that the Wnt1 lineage contributes to specific cohorts of MbDA neurons during a seven day epoch and that the contribution to MbDA neurons predominates over other ventral Mb domains. In addition, we show that calbindin-, GIRK2-, and calretinin-expressing MbDA neuron subtypes are derived from Wnt1-expressing progenitors marked over a broad temporal window. Through GIFM and quantitative analysis we demonstrate that the Wnt1 lineage does not undergo progressive lineage restriction, which eliminates a restricted competence model of generating MbDA diversity. Interestingly, we uncover that two significant peaks of Wnt1 lineage contribution to MbDA neurons occur at E9.5 and E11.5. Collectively, our findings delineate the temporal window of MbDA neuron generation and show that lineage and timing predicts the terminal distribution pattern of MbDA neurons.
Keywords: genetic inducible fate mapping, VTA, SNc, cell fate
INTRODUCTION
Midbrain dopamine (MbDA) neurons are critical for the modulation of motor behaviors as well as cognitive processes (Iverson et al., 2010). Classically, MbDA neurons are anatomically divided into three subpopulations: the bilateral substantia nigra pars compacta (SNc), the medially located ventral tegmental area (VTA), and the retrorubral field (RRF). MbDA neurons of the SNc principally innervate the dorsal striatum by way of the nigrostriatal projections to modulate complex motor behaviors (Fallon, 2003). VTA MbDA neurons primarily innervate pre-frontal cortex and the ventral striatum through the mesocortical and mesolimbic pathways, respectively (Altar et al., 1983; Fallon, 1981; Ikemoto, 2007; Loughlin and Fallon, 1982). VTA MbDA neurons modulate a diverse and complex array of behaviors including memory, motivation, reward, and cognition (Fallon, 2003). RRF MbDA neurons broadly innervate dorsal and ventral striatum to modulate activity of both the nigrostriatal and the mesolimbic pathways (Deutch et al., 1988).
In addition to the differences in their anatomical position, circuitry, and function, MbDA neurons are further partitioned by the expression of distinct molecular markers. SNc MbDA neurons primarily express G-protein-regulated inward rectifier K+ channel (GIRK-2) (Thompson et al., 2005). In contrast, VTA and RRF MbDA neurons are biased toward the expression of the calcium-binding proteins calbindin and calretinin (McRitchie et al., 1996). Currently, it is not understood how MbDA neuron heterogeneity is acquired or how the anatomical organization of MbDA neurons is established during development. In addition to being an important question in developmental biology, understanding how the distinct subtypes of MbDA neurons are established is clinically relevant because the dysfunction or depletion of MbDA neuron subtypes are associated with specific neurological disorders. For example, VTA MbDA neurons are primarily impacted in schizophrenia (Fallon, 2003) while SNc MbDA neurons are predominantly depleted in Parkinson’s Disease (Damier et al., 1999). Currently, the front line treatment of Parkinson’s disease is the exogenous administration of L-DOPA, although this paradigm may be associated with untoward side effects (Buck and Ferger, 2010; Calabresi et al., 2010). Cell based therapies, including the use of induced pluripotent stem cells (iPSCs), are emerging as a potentially powerful approach to ameliorate Parkinson’s disease (Seifinejad et al., 2010; Soldner et al., 2009). Therefore, understanding how different subpopulations of MbDA neurons are established in development is likely to be instructive in therapeutic approaches where it is necessary to rescue the loss of specific MbDA neuron subtypes.
MbDA neurons are derived from the vMes during embryonic development (Bayer et al., 1995; Kawano et al., 1995). MbDA neurons are generated in three developmental stages from approximately E7.5–E14.5 in mouse: progenitor specification, early differentiation (immature neurons), and late differentiation (Ang, 2006). Importantly, elucidating the function of transcription factors, signaling molecules and their interactions during vMes development has been essential for the ability to manipulate stem cells and iPSCs for cell based therapies (Kim et al., 2002; Lee et al., 2000; Soldner et al., 2009). We have focused on Wnt1, which is expressed in the vMes from E8.0–E14.0 in the mouse embryo (Wilkinson et al., 1987). Previous studies have shown that Wnt1 null embryos have a loss of the entire Mb, including MbDA neurons (McMahon and Bradley, 1990; Panhuysen et al., 2004; Prakash and Wurst, 2007). Wnt1 is necessary for the ectopic induction of MbDA neurons by FGF8 and SHH (Prakash et al., 2006). Further evidence for a role of Wnt1 in MbDA neuron development is that partially-purified conditioned medium from Wnt1 transfected fibroblasts increases the number of MbDA neurons in vitro (Castelo-Branco et al., 2003). Finally, Wnt1/β-catenin signaling regulates the expression of the MbDA neuron determinant LMX1a (Chung et al., 2009). Additionally, Wnt1-expressing progenitors in the vMes contribute to MbDA neurons, but not nearby serotonergic or cholinergic neurons in vivo (Zervas et al., 2004). The aforementioned studies indicate a necessity to further investigate the relationship between Wnt1 and MbDA neuron development. The unresolved issues are elucidating the molecular identity of Wnt1-expressing progenitors and determining the temporal contribution of the Wnt1 lineage to anatomically distinct subtypes of MbDA neurons. We addressed these issues using molecular marker analysis and GIFM in this study.
MATERIALS AND METHODS
Mice
All mice utilized in this study were housed and handled in accordance with Brown University Institutional Animal Care and Use Committee Guidelines (IACUC #0909081). Wnt1-CreERT;mGFP sires were crossed with outbred swiss webster dams to conduct GIFM experiments (Figs. 6–8, 10–14). In addition, TOPGAL or Wnt1-Venus mice were bred to each other or to swiss webster mice to determine the molecular identity of Wnt1-expressing MbDA progenitors (Figs. 2–4). An illustration of the alleles of each mouse line is provided in Figure 1A. The Wnt1-CreERT transgene was generated by excising the cDNA encoding a CreERT fusion protein from pCreERT (Feil et al., 1996) and subcloning it into pWexp3 (Echelard et al., 1994). We previously validated that CreER expression in Wnt1-CreERT embryos mimics endogenous Wnt1 expression and is not expressed ectopically (Ellisor et al., 2009). To analyze the contribution of the Wnt1 lineage to MbDA neurons, we crossed Wnt1-CreERT mice with knock-in mice expressing the TaumGFP reporter allele. For the generation of TaumGFP mice, a lox-STOP-lox-mGFP-IRES-NLS-LacZ-pA targeting cassette was integrated into exon 2 of the Tau genomic locus (Hippenmeyer et al., 2005). The TaumGFP mice were gratefully obtained from S. Arber. TOPGAL mice were obtained from Jackson Labs (Strain Name: Tg(Fos-LacZ)34Efu/J; Stock Number: 004623). TOPGAL was engineered by replacing the luciferase reporter gene of TOPFLASH with the bacterial lacZ gene (DasGupta and Fuchs, 1999). The TOPGAL allele consists of a promoter with three consensus LEF1/TCF-binding motifs and a minimal c-fos promoter to drive the expression of a lacZ gene. Because the TOPGAL reporter is activated by the binding of stabilized β-catenin to the LEF1/TCF-binding motifs, expression of the TOPGAL reporter is a marker of cells responding to canonical WNT signaling. TOPGAL expression in TOPGAL embryos mimics endogenous β-catenin expression and is not expressed ectopically (DasGupta and Fuchs, 1999). Wnt1-Venus transgenic mice were generated by C. Bromleigh and A. Joyner, and were obtained as a gift from A. Joyner. The Wnt1-Venus transgene was generated by subcloning a YFP variant (Venus) into the modified pWexp3 vector (Echelard et al., 1994) that was used to generate Wnt1-CreERT mice (Zervas et al., 2004). The Venus protein in whole mount embryos was detected using filters and settings consistent with detecting GFP by whole mount (Ellisor et al., 2009). In sections, the Venus protein is detected with anti-GFP antibodies. We validated that RNA transcripts of GFP as well as GFP immunolabeling recapitulated Wnt1 expression (Figure 1B).
Figure 6.

MbDA neurons in the VTA, RRF, and SNc domains were derived from Wnt1-expressing progenitors over a prolonged time period. MbDA neurons in adult Wnt1-CreERT;TaumGFP mice marked by tamoxifen administration at distinct 24 hour time points between E7.5–E13.5. A–G: VTA (medial) MbDA neurons. H–N: A8/RRF (retrorubral field) MbDA neurons. O–V: SNc (lateral) MbDA neurons. MbDA neurons are indicated by TH immunolabeling (green) and the Wnt1 lineage is indicated by nuclear β-gal immunolabeling (red). Arrows show examples of neurons that expressed both TH and β-gal. Scale Bar = 32μm.
Figure 8.

The temporal contribution of the Wnt1 lineage to vMb structures. A–B: Cresyl violet staining indicating the anatomical distribution of selected nuclei is shown. The following vMb structures were analyzed: subthalamic nucleus (STh), interfascicular nucleus (IFN), posterior hypothalamic area (PHA), substantia nigra pars reticulata (SNr), red nucleus (RN), edinger-westphal nucleus (EW). The following MbDA neuron containing structures were also analyzed: substantia nigra pars reticulata (SNc), ventral tegmental area (VTA), retrorubral field (RRF). C–D: Representative examples of the Wnt1 lineage contribution to vMb structures in Wnt1-CreERT;TaumGFP mice marked by tamoxifen administration at E9.5. The Wnt1 lineage derived cells (β-gal+, red) and hoechst nuclear counterstaining (blue) are shown in a dorsal (C) and intermediate (D) horizontal section. E–F: The Wnt1 lineage contributes to a few BRN3a+ neurons in EW (E) and rarely to RN (F). Examples of cells co-expressing β-gal and BRN3a are indicated by arrows. G: The relative contribution of neurons derived from the Wnt1 lineage to the indicated vMb structures that were marked from E7.5 to E13.5. “−” no contribution, “+” sparse contribution, “++” moderate contribution, “+++” high contribution. H: Summary schematic showing the progressive restriction of the Wnt1 lineage contribution to vMb structures with the exception of the pattern of contribution to the MbDA neurons. Scale Bar = 250μm (A,B); 15μm (C,D).
Figure 10.

Sampling method for quantifying MbDA neurons derived from the Wnt1 lineage. A,B: Hemi-horizontal sections from ventral location (See Fig. 9F,K) at low magnification and representative examples of MbDA neurons (TH+ green) and the Wnt1 lineage (β-gal+, red). Coincident labeling indicates Wnt1 derived MbDA neurons. Counting frames were overlaid on MbDA neurons and allowed for the reproducible partitioning of medial to lateral or rostral to caudal populations. For each counting frame, a 40x z-series was collected and neurons expressing both TH and β-gal were counted (see methods). We provided two examples of how counting frames were applied to sections from Wnt1-CreERT;TaumGFP adult mice that were marked by tamoxifen administration at E9.5 (A) or E10.5 (B). Examples of 1 μm thick optical sections from 40x z-series stacks; each number corresponds to the assigned counting frames shown in the low magnification images. Scale Bar = 520 μm (A,B), 31 μm (40x z-series images).
Figure 14.

The relative contribution of Wnt1-expressing cells to dorsal, intermediate, and ventral MbDA neurons. A–C: The percentage of MbDA neurons in the dorsal (A), intermediate (B), and ventral (C) spatial domains marked by GIFM with tamoxifen administration between E7.5–E13.5. The counting frames that were used for group analysis are shown in Fig. 9 (dorsal: all counting frames in H and I; intermediate: all counting frames in J, ventral: all counting frames in K–L). The contribution of the Wnt1 lineage to dorsal and intermediate MbDA neurons follows a regression model (black trend line) similar to the model for the contribution of the Wnt1 lineage to MbDA neurons as a whole. However, the Wnt1 lineage contribution to ventral MbDA neurons does not follow this pattern. A–C, insets. Orthogonal linear contrast models showing that the Wnt1 lineage contribution to the dorsal, intermediate, and ventral MbDA neurons at E10.5 was significantly less than at E9.5 or E11.5; * indicates p<0.0001.
Figure 2.

Molecular identity of Wnt1-expressing progenitors in early vMes. A–B: Whole mount E8.5 embryos indicate the location of sections that are shown. A: sagittal view. B: dorsal view. Illustration shows region of analysis. C–J: Sections from E8.5 Wnt1-Venus;TOPGAL embryo showing Wnt1(GFP)+ progenitors (green) in the mes and the indicated markers (magenta); note that Wnt1(GFP) was not expressed in rhombomere 1 (r1) or in the prosencephalon (pros). White arrowheads with asterisk show co-localization of Wnt1(GFP)+ progenitors and marker; white arrowheads show examples of Wnt1(GFP)+ only cells; white arrows show cells expressing only the marker. C,G: Wnt1(GFP)+ progenitors that were mitotic (pHH3+) were located in mitotic zone at the periphery of the tissue. D,H: LMX1a was co-localized with medial, but not lateral Wnt1(GFP)+ progenitors. E,I: OTX2 was co-localized with Wnt1(GFP)+ progenitors both medially and laterally; in medial sections the OTX2+/Wnt1(GFP)− prosencephalon (red) was apparent. F,J: There were Wnt1(GFP)+ cells that responded to canonical WNT signaling in the medial domain as evident by overlap with β-gal from the TOPGAL reporter (Fig 2F). However, fewer Wnt1(GFP)+ cells responded to canonical WNT signaling in the lateral domain (Fig. 2J). Scale bar = 32μm (C–J).
Figure 4.

Molecular identity of Wnt1-expressing progenitors in late vMes. A: An E12.5 whole mount embryo indicates the vMes. Illustration shows region of analysis. B–E: Medial and off-midline sagittal sections from E12.5 Wnt1-Venus embryos showing Wnt1(GFP)+ progenitors (green) in the mes and the indicated markers (red); hoechst staining (blue) shows tissue morphology. Black and white insets show single channel of each marker. F–G: Transverse sections showing the morphology and domains of interest in H–L. H–L: Transverse sections at rostral (r), intermediate (i), and caudal (c) levels showing Wnt1(GFP)+ cells (green) and indicated markers (magenta). K: Summary schematics showing domains of expression of Wnt1(GFP) (green), Otx2 (red), Lmx1a (blue), and TH (yellow). Note that intermingling of markers indicates overlapping domains versus exclusive expression domains. L–N: Horizontal planes showing Otx2 (green) and Lmx1a (magenta) at dorsal (d), intermediate (i), and ventral levels (v).
Figure 1.

Transgenic mice used in this study. A: Illustrations of the alleles contained in the mouse lines used in this study: Wnt1-CreERT, TaumGFP, Wnt1-Venus, and TOPGAL. Details of the mouse lines are provided in the “Mice” section of Materials and Methods. Yellow and blue boxes indicate Wnt1 (Wnt1-CreERT and Wnt1-Venus) or Tau (TaumGFP) translated and nontranslated exons. tag indicates a short sequence of LacZ in Wnt1-CreERT and Wnt1 Venus; Z indicates a lacZ gene (TaumGFP and TOPGAL); L indicates a consensus binding motif for LEF1/TCF (TOPGAL); white arrowheads indicate loxP sites (TaumGFP). B–E: Venus expression in Wnt1-Venus embryos mimics endogenous Wnt1 expression. B: Sagittal view of a Wnt1-Venus E10.5 embryo indicating the location of the ventral mes, the region of interest in this study. C–D: In-situ hybridization in E10.5 Wnt1-Venus embryos for with probes recognizing Wnt1 (C) and YFP (D, identifying the expression of the Wnt1-Venus transgene). The expression of Wnt1 and YFP overlaps in a very similar domain in the ventral mes, indicating that the Wnt1-Venus transgene is not expressed ectopically and that it is a true readout of endogenous Wnt1 expression. E: Immunolabeling for GFP protein in an E10.5 Wnt1-Venus embryo. GFP protein expression also overlaps in a very similar domain of expression to the Wnt1 gene, also indicating that the Wnt1 transgene is not expressing ectopically. Scale bar = 63μm (BE).
Genotyping
Mice were genotyped from tail biopsies as described previously (Ellisor et al., 2009). Complete details of genotyping Wnt1-CreERT;mGFP mice can be found in Ellisor et al. (2009). Tail samples from Wnt1-Venus and TOPGAL mice were digested in 100 μl of tail lysis buffer (containing Proteinase K) for 12 h at 60°C followed by heat activation at 90°C. To genotype Wnt1-Venus mice, a 600 bp amplicon corresponding to a fragment of the Wnt1-Venus allele was amplified in an 20 μl reaction [15.54 μl ddH20, 1 μl DMSO, 2 μl 15mM MgCl2 10X Buffer, 0.16 μl 100 mM dNTPs, 0.10 μl 150 pmol/μl EGFP forward primer (5’-CTG GTC GAG CTG GAC GGC GAC G-3’), 0.10 μl 150 pmol/μl EGFP reverse primer (5’-CAC GAA CTC CAG CAG GAC CAT G-3’), 0.1 μl of Taq polymerase (Invitrogen; Carlsbad, CA) and 1.0 μl of tail lysate (DNA template)] using the following PCR program (94°C for 3 min, 30 cycles of 94°C for 30 s, 60°C for 30 s and 72°C for 1 min, and 72°C for 3 min). To genotype TOPGAL mice, a 200 bp amplicon indicating the TOPGAL allele was amplified in an 20 μl reaction [16.54 μl ddH20, 2 μl 15 mM MgCl2 10X Buffer, 0.16 μl 100 mM dNTPs, 0.10 μl 150 pmol/μl LacZ primer 1 (5’-TAC CAC AGC GGA TGG TTC GG-3’), 0.10 μl 150 pmol/μl LacZ primer 2 (5’-GCG ATG TCG GTT TCC GCG AG-3’), 0.1 μl of Taq polymerase (Invitrogen; Carlsbad, CA) and 1.0 μl of tail lysate (DNA template)] using the following PCR program (94°C for 2 min., 30 cycles of 94°C for 1 min., 61°C for 1 min, 72°C for 1 min, and 72°C for 10 min). We added 4 μl of 6X loading dye to PCR products and heated to 65°C for 5 min. Samples were then run on a 2% agarose gel containing SYBRsafe (Invitrogen, Cat# S33102 at a concentration of 1 μl/100 mL in TBE) at 140 V for 1 h. Gels were visualized using a blue light box.
Genetic Inducible Fate Mapping
GIFM was performed as previously described (Ellisor et al., 2009; Brown et al., 2009; Ellisor and Zervas, 2010). Briefly, a 20 mg/mL stock solution of tamoxifen (T-5648, Sigma) was prepared in corn oil and administered as shown previously (a detailed protocol can be found in Brown et al., 2009). GIFM experiments were performed by crossing Wnt1-CreERT;TaumGFP male mice (approximately 3–6 months old) with Swiss Webster female mice (SW, wildtype; purchased from Taconic Farms, approximately 5 weeks old). The morning (0900) of the day a vaginal plug was detected was designated as 0.5 days post-coitus. A single dose of tamoxifen (4 mg in 200 μl of corn oil) was administered to timed-pregnant SW females by oral gavage at 0900 on embryonic day (E)7.5, E8.5, E9.5, E10.5, E11.5, E12.5, or E13.5. Following tamoxifen administration, the offspring of timed-pregnant mice were allowed to develop to an adult stage (four to five weeks of age) and were sacrificed for analysis.
Tissue processing
Embryos used for the molecular characterization of MbDA neuron progenitors were dissected from pregnant females and processed as previously described (Ellisor et al., 2009). Briefly, embryos were harvested at 0900 on the designated day of dissection. Embryos were fixed overnight in 4% paraformaldehyde (PFA), cryoprotected in 15% and then 30% sucrose and embedded in optimal temperature cutting media (OCT). Frozen OCT blocks were cryosectioned at 12 μm in the sagittal plane and collected on ProbeOn Plus slides. Adult mice were deeply anesthetized with a lethal dose of sodium pentobarbital (Nembutal, 50 mg/kg) delivered by intraperitoneal injection. Following anesthesia, a midline incision was made over the thoracic region to perform an intra-cardiac perfusion of ice cold phosphate-buffered saline (PBS, pH 7.4) and then PFA. Following perfusion of the animal, post-mortem brains were collected rapidly into 4% PFA (for method, see Brown et al., 2009). Fate mapped brains from Wnt1-CreERT;TaumGFP mice were postfixed for several days and and cut in the horizontal plane (40 μm) with a vibrating microtome (Leica VT1000S). Sections were collected into ice-cold PBS and used for immunohistochemical analysis.
Immunohistochemistry
Cryosections mounted on slides (embryonic tissue) or free-floating sections (adult tissue) were rinsed in PBS for five minutes and fixed in 4% PFA in PBS for five minutes. Sections were rinsed three times in 0.2% TritonX-100 (Fisher Scientific; Waltham, MA) in PBS (PBT) for five minutes each and blocked in 10% normal donkey serum (NDS) in PBT for two hours at room temperature. All primary antibodies were prepared in a solution of 10% NDS in PBT. Primary antibodies were used on sections at the concentrations indicated in Table 1. All sections were incubated in 400μl of primary antibody solution at 4°C overnight in a humid chamber; slides were covered with a parafilm cover slip to prevent dehydration. Sections were allowed to come to room temperature and washed five times with PBT for ten minutes each. Alexa 555 secondary antibodies (Molecular Probes; Cat#A-31570; donkey anti-mouse; Cat#A-31572 donkey anti-rabbit; or Cat#A-21437; goat anti-chick), Alexa 488 secondary antibodies (Molecular Probes; Cat#A-21206; donkey anti-rabbit or Cat#A-11055; donkey anti-goat), Dylight 549-conjugated secondary antibody (Jackson ImmunoResearch, Cat#706-505-148; donkey anti-guinea pig) and Coumarin AMCA (Jackson ImmunoResearch, Cat#703-155-155; donkey anti-chick) were prepared at a concentration of 1:500 in 1% donkey serum in PBT. Sections were incubated in 400μl of solution with the appropriate combination of secondary antibodies for two hours at room temperature in a light resistant humid chamber. Sections were then washed with PBT five times for ten minutes each and counterstained (if Coumarin AMCA was not used) with 0.01% Hoechst 33342 (Molecular Probes; Cat#H-3570) in PBS for five minutes in the dark. Sections were washed with PBS, mounted onto slides (for free floating), and coverslipped. Nissl staining was done on mounted sections by first incubating mounted sections in ninety percent ethanol for thirty minutes and then staining in cresyl violet until the desired color and extent of labeling was achieved. Sections were immediately dehydrated in ninety and then one hundred percent ethanol followed by xylenes and coverslipped with Permount. Microscopy is described below.
Table 1. Primary Antibodies Used in the Study.
Description of the primary antibodies used in this study. Detailed information for each of the primary antibodies is provided. Further information on the antibodies can be found in the antibodies characterization section in the Materials and Methods.
| Antigen | Immunogen | Manufacturer | Dilution used |
|---|---|---|---|
| βgal | Full length native protein purified from E. coli | Abcam (Cambridge, MA) chicken polyclonal (IgY) Cat# ab9361; | 1/500 |
| Tyrosine hydroxylase (mouse) | Tyrosine Hydroxylase purified from PC12 cells, 59–63 kDa | Millipore (Billerica, MA) mouse monoclonal (IgG) Cat# MAB318 | 1/2000 |
| Tyrosine hydroxylase (rabbit) | Denatured tyrosine hydroxylase from rat pheochromocytoma | Millipore-Chemicon (Billerica, MA) rabbit polyclonal (IgG) Cat# AB152 | 1/500 |
| Calbindin | recombinant rat calbindin D-28k protein | Swant (Bellinzona, Switzerland) rabbit polyclonal Cat#CB38a | 1/5000 |
| Calretinin | rat calretinin protein | Chemicon (Billerica, MA) goat polyclonal Cat#AB1550 | 1/5000 |
| GIRK2 | synthetic peptide corresponding to the 374–414 residues of mouse GIRK2 protein (Saenz del Burgo et al., 2008) | Alomone Labs (Jerusalem, Israel) rabbit polyclonal, Cat#APC-006 | 1/80 |
| GFP | full-length GFP protein with a histidine-tag at the N-terminal end (Horie et al., 2008) | Nacalai Tesque (Kyoto, Japan) rat monoclonal (IgG2a) (GF090R) Cat#04404-84 | 1/600 |
| OTX2 | synthetic peptide conjugated to KLH derived from exactly amino acids 277–289 of human Otx2 | Abcam (Cambridge, MA) rabbit polyclonal (IgG) Cat#ab21990 | 1/250 |
| LMX1a | GST-tagged recombinant protein corresponding to the C-terminus (amino acids 299–378) of hamster LMX-1 | Gift from Dr. Michael German, University of California San Francisco; rabbit polyclonal (IgG) | 1/1000 |
| Phosphohistone H3 (Ser10) | Linear peptide corresponding to amino acids 7–20 of human Histone H3. | Millipore (Temecula, CA) rabbit polyclonal (IgG) Cat# 06-57 | 1/500 |
| BRN3a | fusion protein containing amino acids 185–255 of Brn3a, which are N- terminal to the POU-specific domain and specific to Brn3a and not other members of the mouse Brn3 (POU4) gene class | Gift from Dr. Eric Turner, Seattle Children’s Research Institute; guinea pig polyclonal | 1/500 |
Antibody characterization
The primary antibodies and dilutions used in this study are listed in Table 1.
anti-β-galactosidase (β-gal) recognizes the β-gal protein (manufacturer's information). The β-gal antibody labels fate mapped neurons in this study consistent with previous reports (Ellisor et al. 2009, Brown et al., 2009, Ellisor et al., 2010). The application of β-gal antibody to sections obtained from wildtype mouse brain results in no labeling (data not shown) In addition, regions not derived from Wnt1-expressing progenitors were unlabeled and served as an internal control for all experiments. No signal is detected when anti-β-gal antibody is applied to brains that are devoid of β-gal expression (Harrison et al., 2008).
anti-tyrosine hydroxylase (mouse) recognizes an epitope on the N-terminus of the tyrosine hydroxylase (TH) protein. The anti-TH antibody (mouse) recognizes a protein of approximately 59–61 kDa by Western blot, and does not react with the following on Western Blots: dopamine-beta-hydroxylase, phenylalanine hydroxylase, tryptophan hydroxylase, dehydropteridine reductase, sepiapterin reductase or phenethanolamine-N-methyl transferase (manufacturer's information). This antibody stains a pattern of TH immunoreactive cells in a manner consistent with previous reports (Fetissov et al., 2009; Gale et al., 2008; Gautron et al., 2010; Morona and Gonzalez, 2009; Myohanen et al., 2008; Northcutt et al., 2007; Person et al., 2008; Villar-Cervino et al., 2006; Zervas et al., 2004, Ellisor et al., 2009).
anti-TH (rabbit) recognizes the tyrosine hydroxylase protein and specifically labels a single band at approximately 62 kDa in western blots (manufacturer’s information). This antibody stains a pattern of TH immunoreactive cells in a manner consistent with previous reports (Fetissov et al., 2009; Gale et al., 2008; Gautron et al., 2010; Morona and Gonzalez, 2009; Myohanen et al., 2008; Northcutt et al., 2007; Person et al., 2008; Villar-Cervino et al., 2006). In addition, mutant mice that are deficient in subsets of MbDA neurons have an absence of labeling concordant with MbDA neuron loss (data not shown).
anti-Calbindin has been verified in western blots and recognizes a single band of approximately 27–28 kDa. The anti-Calbindin antibody labels a subpopulation of MbDA neurons in the ventral tegmental area and dorsal/lateral substantia nigra pars compacta in a manner consistent with previous reports (McRitchie et al., 1996; Nemoto et al., 1999; Thompson et al., 2005) in wild-type mouse brain. Anti-calbindin does not label the brain of calbindin D-28k knock-out mice (manufacturer’s information).
anti-Calretinin recognizes a 30 kDa band on Western blots of rat brain extracts (Puthussery et al., 2010). This antibody labels calretinin-expressing MbDA neurons in a pattern that is similar with previous reports (McRitchie et al., 1996; Nemoto et al., 1999).
anti-GIRK2 (also known as Kir3.2, Kcnj6, or G-protein regulated inward-rectifier K+ channel) recognizes the intracellular, C-terminus of the GIRK2 protein (Saenz del Burgo et al., 2008). The anti-GIRK2 antibody recognizes a single band of approximately 45–50 kDa in western blot and no band is detected after preadsorption with the original antigen (manufacturer’s information). This antibody labels GIRK-2 expressing MbDA neurons in a pattern that is similar with previous reports (Thompson et al., 2005).
anti-GFP specificity of immunostaining has been demonstrated by the absence of signal when anti-GFP primary antibody is applied to Ciona intestinalis larvae electroporated with GFP constructs containing inactivated promoters (Horie et al., 2008). This antibody labels GFP-expressing cells in mouse lines genotyped positive for GFP alleles, but not in wildtype littermates (data not shown).
anti-OTX2 recognizes a band of approximately 37 kDa in western blot and no band is detected after preadsorption with purified OTX2 peptide (manufacturer’s information). This antibody labels OTX2-expressing MbDA progenitors in a pattern that is similar with previous reports (Ang et al., 2006).
anti-LMX1a was a gift from Dr. Michael German. The anti-LMX1a antibody is also commercially available from Millipore (Temecula, CA; Cat # AB10533). This antibody recognizes the C-terminus of the LMX1a protein. Anti-LMX1a recognizes a band of approximately 50 kDa in western blots of mouse testis tissue lysate. (manufacturer’s information). Anti-LMX1a antibody stains developing MbDA neuron progenitors in the vMes of embryonic mouse tissue in a similar manner to previous reports (Andersson et al., 2006).
anti-Phospho-histone H3 (Ser10) (pHH3) is produced against KLH-(ARK[pS]TGGKAPRKQLC) peptide (residues 7–20 of human histone H3). This antibody labels a single band of 17 kDa corresponding to phospho-histone H3 on Western blots of acid-extracted proteins from colcemid-arrested HeLa cells and gives positive chromosome immunostaining in mitotic HeLa cells (manufacturer's information). Specific immunostaining of mitotic cells has also been confirmed by quantitative analysis of mitotic figures in human and macaque endometrium (Brenner et al., 2003). This antibody labels mitotic neurons in the developing embryo consistent with previous reports (Ellisor et al., 2009).
Anti-BRN3a was a gift from Dr. Eric Turner and is prepared against a fusion protein containing amino acid sequences N-terminal to the POU-specific domain that are specific to BRN3a and not other members of the mouse BRN3 (POU4) gene class, and all BRN3-family antisera were antigen-affinity purified before use (Quina et al., 2005). This antibody stains a pattern of BRN3a-immunoreactive cells in a manner similar to previous reports (Quina et al., 2009; Sun et al., 2008).
Microscopy
Images of YFP fluorescence in whole mount embryos were obtained with a Leica MZ16F fluorescence stereomicroscope and an Optronics Macrofire camera using Picture Frame from Optronics imaging. Images of sections were obtained on a Leica DM6000B epifluorescence microscope with a motorized stage using the following objectives: HCX FL PLAN 2.5x/0.07 and HC PLAN APO 20x/0.70 0.17/C 0.59. We used a HCX PL APO 40x/0.85 CORR, 0.11–0.23 objective to collect 1μm optical sections (in the z-axis with a motorized stage). Data was acquired with a QImaging Retiga SRV camera and Volocity 5.2 imaging acquisition palette. All images were pseudo colored live as part of the acquisition palettes. Imaging data sets were exported to Adobe Photoshop CS3 or Adobe Illustrator CS3 where montages of representative data were generated.
Cell counting and quantitative assessment
The entire population of MbDA neurons was sampled by collecting sections at 40 μm in the horizontal plane (approximately 40 sections contain all MbDA neurons). Of these 40 sections, five were analyzed to sample distinct MbDA clusters along the dorsal-ventral axis. These sections were located at −3.96 mm, −3.76 mm, −4.12 mm, −4.56 mm, and −4.88 mm (most dorsal to most ventral using Bregma as a reference, (Franklin and Paxinos, 2007)) (Fig. 9A–B). We determined the density of fate mapped cells that expressed TH using a predetermined sampling system and rigorous counting frame rules (Fig. 9). In each section, counting frames were placed over anatomically distinct MbDA neuron populations that were also verified with distinct coordinates in reference to clear anatomical landmarks (Fig. 9). The exact counting frame coordinates varied to accommodate the placement of counting frames over the pre-determined structures. Subtle variations were due to natural variation of anatomical differences across animals, which we verified by measuring the distances between internal landmarks. The reproducibility of the counting frame rules (and each cohort of MbDA neurons analyzed) was confirmed by evaluating the coordinates of the upper right corner of each frame both across animals in a marking series and in relation to clearly identified anatomical reference landmarks within each section. The location of the counting frames was highly reproducible as evident by low standard deviations and acceptable differences in the dimensionless coefficient of variation (COV, expressed as a percent) between counting frames and landmarks. The counting frame coordinates are expressed as the distance (micrometers, μm) from the rostral (third ventricle, 3V) and caudal (ventral tegmental nucleus, VTg; rostral linear nucleus, Rli; caudal linear nucleus of the raphe, Cli; median raphe nucleus, RphN; interpenducular nucleus, IPN) landmarks as follows: Dorsal-most (dor-most) counting frames in reference to 3V and VTg were (1333μm,1410μm)dor-most,frame1 and (1854μm,1451μm)dor-most,frame2 (Fig. 9C); Dorsal (dor) counting frames in reference to 3V and Rli were (1284μm,492μm)dor,frame1, (1739μm,1205μm)dor,frame2, (1941μm,1524μm)dor,frame3, (1852μm,1674μm)dor,frame4 (Fig. 9D); Intermediate (int) counting frames in reference to 3V and Cli were (1205μm,307μm)int,frame1, (1056μm, 586μm)int,frame2, (920μm, 859μm)int,frame3, (1585μm,971μm)int,frame4, (1958μm,1433μm)int,frame5, (1645μm,1387μm)int,frame6, (1711μm,1778μm)int,frame7 (Fig. 9E); Ventral (ven) counting frames in reference to 3V and RphN were (1961μm,1373μm)ven,frame1, (1389μm,825μm)ven,frame2, 1116μm,699μm)ven,frame3, (984μm, 997μm )ven,frame4, (1386μm,1226μm)ven,frame5, (1206μm,1440μm)ven,frame6, (1440μm,1608μm)ven,frame7, (1642μm,1925μm)ven,frame8 (Fig. 9F); Ventral-most (ven-most) counting frames in reference to 3V and IPN were (1355μm,701μm)ven-most,frame1, (1208μm,849μm)ven-most,frame2 (Fig. 9G). To determine the density of fate-mapped cells that expressed TH, a 40x z-series stack was collected for each counting frame (See Fig. 10). In each 40x z-series stack, the number of TH+/β-gal+/marker+ neurons were counted as they came into focus, starting from the top of the section and focusing through the bottom z-plane in the 40x z-series. Because there is some variability in the extent of marking between litters (Ellisor and Zervas, 2010) we counted the MbDA neurons derived from the Wnt1 lineage from three adult animals marked by a single dose of tamoxifen administered at E7.5, E8.5, E9.5, E10.5, E11.5, E12.5, or E13.5 as described above. Therefore, twenty-one animals were included for quantitative and statistical analysis. We pooled together the number of Wnt1-derived cells in counting frames representing the total population of MbDA neurons. We then compared this data across cohorts of animals given tamoxifen at different embryonic stages (Fig. 11). We subsequently pooled together the number of Wnt1-derived cells in counting frames in VTA, RRF, and SNc (medial to lateral) domains, and rostral, intermediate, and caudal (rostral to caudal) domains as well as dorsal, intermediate, and ventral (dorsal to ventral) domains. The counting frames were divided into the following groups for analysis. VTA MbDA neurons were from H1, I1, J1–3, K2–4; RRF MbDA neurons from H2, I2; SNc MbDA neurons from I3–4, J4–7, K1, K5–8, L1–2 (Figs. 9,12). Rostral MbDA neurons were from H1–2, I4, J3, J7, K4, K6–8, L1–2; Intermediate (along rostral to caudal axis) MbDA neurons were from I1, J2, J6, K3, K5; Caudal MbDA neurons were from I2–3, J1, J4–5, K1–2 (Figs. 9,13). Dorsal MbDA neurons were from all counting frames in H and I; Intermediate MbDA neurons (along the dorsal to ventral axis) were from all counting frames in J; Ventral MbDA neurons were from all counting frames in K–L (Figs. 9,14).
Figure 9.

Anatomical levels used for quantitative GIFM analysis of the Wnt1 lineage contribution to adult MbDA neurons. A: Mid-sagittal schematic of an adult brain showing the relative locations of the five horizontal planes used for analysis. B: Three-dimensional reconstruction of MbDA neuron distribution plotted along the dorsal-ventral axis and showing planes analyzed: dorsal-most (C), dorsal (D), intermediate (E), ventral (F), and ventral-most (G) C–G: Illustrations of MbDA neuron populations (dark gray shading) in context of their projections to the target striatum (gray). The domain encompassing MbDA neurons is smaller in the most dorsal planes (C,D) compared to intermediate (E) and ventral (F) horizontal sections. In the intermediate horizontal section (E), and the ventral horizontal section (F), both the lateral SNc and the medial VTA are prominent. In the ventral-most horizontal section (G), the lateral SNc is a relatively small domain and the medial VTA is absent. Note that retrorubral field (RRF) MbDA neurons are present in the dorsal sections (C,D), but is absent in more ventral sections (E–G). H–L: Images of MbDA neuron populations in the most dorsal (H), dorsal(I), intermediate (J), ventral (K), and most ventral (L) are shown below their respective illustrations. The numbered boxes indicate where counting frames were placed to sample the relative contribution of the Wnt1 lineage to distinct MbDA subdomains in dorsal-ventral planes shown. The counting frames were organized in the following manner to analyze specific domains. Medial to lateral MbDA neurons (analyzed in Fig. 12): medial (H1, I1, J1–3, K2–4); intermediate (H2, I2), lateral (I3–4, J4–7, K1, K5–8, L1–2). Rostral to caudal MbDA neurons (analyzed in Fig. 13 ): rostral (H1–2, I4, J3, J7, K4, K6–8, L1–2), intermediate (I1, J2, J6, K3, K5), caudal (I2–3, J1, J4–5, K1–2). Dorsal to ventral MbDA neurons (analyzed in Fig. 14 ): dorsal (all counting frames in H and I); intermediate (all counting frames in J), ventral (all counting frames in K–L).
Figure 11.
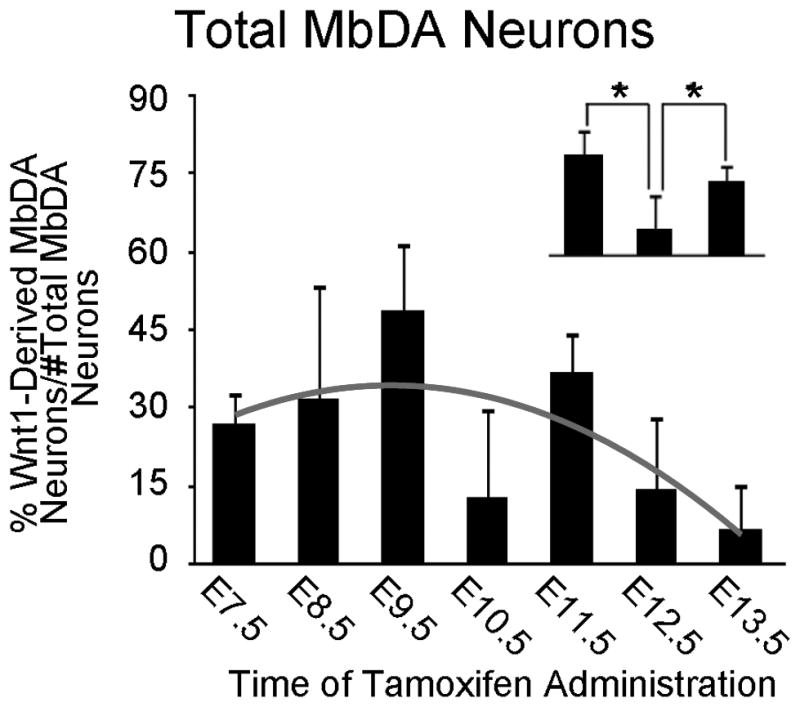
Quantitative analysis of the Wnt1 lineage contribution to total MbDA neurons. The data shows the percentage of MbDA neurons marked by GIFM at indicated tamoxifen administration time points from E7.5–E13.5 from three adult brains sampled as described in Figs. 9 and 10. The contribution of Wnt1-expressing cells compared to the total number of MbDA neurons counted. The Wnt1 lineage gives rise to a relatively moderate level of MbDA neurons early (E7.5–E8.5). Overall, the E9.5 marking period resulted in the largest contribution to MbDA neurons. From E9.5 to E12.5, there is a significant decrease in Wnt1 lineage contribution. E13.5 represents the cessation of the Wnt1 lineage contribution to MbDA neurons. Statistical analysis showed the data fit a positive linear regression from E7.5 to 9.5, followed by a negative quadratic regression from E9.5 to E13.5. (p<0.0001 for each component). A trend line representing this regression is shown in gray. The contribution of the Wnt1 lineage marked at E10.5 appeared less than when marked at E9.5 and E11.5. A, inset: The comparison between E9.5, E10.5, and E11.5 was evaluated in a statistical model using orthogonal linear contrasts, which showed that the lineage contribution at E10.5 was significantly less than at E9.5 or E11.5 (p<0.0001, each time point) indicating that there was a significant decrease in Wnt1 lineage contribution from E9.5 to E10.5 and a significant increase from E10.5 to E11.5.
Figure 12.

The relative contribution of Wnt1-expressing cells to VTA, RRF, and SNc MbDA neurons. A–C: The percentage of MbDA neurons marked by GIFM compared to the total number of MbDA neurons counted in the VTA (A), RRF (B), and SNc (C) when tamoxifen was administered between E7.5–E13.5. The counting frames that were used for group analysis are shown in Fig. 9 and were applied in the following manner: The VTA (medial) MbDA neurons are from Fig. 9H1, I1, J1–3, K2–4; The RRF (intermediate) MbDA neurons from Fig. 9H2, I2; The SNc (lateral) MbDA neurons from Fig. 9 I3–4, J4–7, K1, K5–8; L1–2. The contribution of the Wnt1 lineage to VTA, RRF, and SNc follows a regression model (black trend line) similar to the model for the contribution of the Wnt1 lineage to MbDA neurons as a whole. A–C, insets. Orthogonal linear contrast models showing that the Wnt1 lineage contribution to the VTA, RRF, and SNc at E10.5 was significantly less than at E9.5 or E11.5; * indicates p<0.0001.
Figure 13.

The relative contribution of Wnt1-expressing cells to rostral, intermediate, and caudal MbDA neurons. A–C: The percentage of MbDA neurons in the rostral (A), intermediate (B), and caudal (C) spatial domains marked by GIFM with tamoxifen administration between E7.5–E13.5. The counting frames that were used for group analysis are shown in Fig. 9 and were applied in the following manner: (rostral: Fig. 9H1–2, I4, J3, J7, K4, K6–8, L1–2; intermediate: Fig. 9I1, J2, J6, K3, K5; caudal: Fig. 9I2-3, J1, J4–5, K1–2). The contribution of the Wnt1 lineage to rostral, intermediate, and caudal MbDA neurons follows a regression model (black trend line) similar to the model for the contribution of the Wnt1 lineage to MbDA neurons as a whole. A–C, insets. Orthogonal linear contrast models showing that the Wnt1 lineage contribution to the rostral, intermediate, and caudal MbDA neurons at E10.5 was significantly less than at E9.5 or E11.5; * indicates p<0.0001.
Statistical methods
SAS version 9.2 (SAS Institute Inc., Cary, NC) was used for all statistical analyses. Several generalized estimating equations for binomial distributed data were used to model the proportion of MbDA neurons (trials) derived from progenitors expressing Wnt1 (events) as a function of structure (VTA, RRF, and SNc) and/or gestational day on which tamoxifen was administered. Residual variances were estimated within animal for all models (variance components). The denominator degrees of freedom were determined using the Kenward-Rogers method. The proportions were taken as an indication of the degree to which mature MbDA neurons from each structure originated from the pool of Wnt1-expressing progenitor cells at the time of Wnt1 marking. The higher the proportion of MbDA neuron progenitors expressing Wnt1, the greater the relative contribution from the progenitor pool at that gestational day. However, it should be noted that this paradigm cannot determine mechanism, whether that mechanism is related to (1) a larger number of cells migrating, (2) differences in the proportion of neurons surviving or higher rate of proliferation, which would mask any effects of differential migration.
RESULTS
Molecularly distinct Wnt1-expressing progenitors at early, intermediate, and late stages of MbDA neuron development
To characterize the Wnt1 expression domain in the vMes during the period when MbDA neurons were developing, we utilized a transgenic mouse line that expresses YFP under the control of the Wnt1 regulatory elements (Wnt1-Venus, Figs. 1–4). This line reliably mimicked the expression of endogenous Wnt1 transcripts (Fig. 1B–E). We used this line to ascertain the spatial distribution of the Wnt1-expressing cells in the vMes at early, intermediate, and late stages of MbDA neuron development. In this study, domains with fluorescent labeling in whole mount Wnt1-Venus embryos were referred to as Wnt1(YFP)+ to indicate endogenous YFP fluorescence from the transgene, which was detected without antibody labeling (Figs. 2A–B,3A,4A). In contrast, we operationally defined Wnt1-expressing cells in immunolabeled sections as Wnt1(GFP)+ because the YFP signal was detected with an anti-GFP primary antibody (Figs. 2C–J, 3H–M, 4B–E, 4G–J). We characterized Wnt1(GFP)+ cells at E8.5 (Fig. 2), E10.5 (Fig. 3), and E12.5 (Fig. 4) in relation to transcription factors involved in MbDA neuron development (LMX1a and OTX2) and to TH, which indicated differentiated MbDA neurons (Fig. 4). At E8.5, an early stage, when the neural tube was still open, Wnt1(GFP)+ progenitors were distributed uniformly in the mes (Fig. 2A–B). We analyzed medial and lateral sections from E8.5 embryos and observed Wnt1(GFP)+/pHH3+ cells exclusively located at the surface of the neuroepithelium (superficial margin) of the mes, which indicated the location of mitotic cells (Fig. 2C,G). We also assayed for the presence of LMX1a, which is a MbDA neuron determinant (Andersson et al., 2006), and OTX2, which is important in the acquisition of mes identity and is involved in MbDA specification (Ang, 2006). At E8.5, lateral Wnt1(GFP)+ mes cells did not express LMX1a, but were co-localized with OTX2 (Fig. 2D–E). In contrast, a small amount of medial progenitors were Wnt1(GFP)+/LMX1a+ and a larger proportion were Wnt1(GFP)+/OTX2+ (Fig. 2H,I). Finally, because Wnt1 is a secreted signaling molecule, we determined whether Wnt1(GFP)+ cells also responded to canonical WNT signaling by breeding Wnt1-Venus with TOPGAL reporter mice, which express LacZ in response to canonical WNT signaling (DasGupta and Fuchs, 1999). In Wnt1-Venus;TOPGAL embryos, we observed a mixed population of progenitors: Wnt1(GFP)+/β-gal+ (cells expressing Wnt1(GFP) and responding to WNT signaling), the vast majority that were Wnt1(GFP)+/β-gal− (cells expressing Wnt1(GFP) but not responding to canonical WNT signaling), and Wnt1(GFP)−/β-gal+ (cells responding to WNT signaling but not expressing Wnt1(GFP) (Fig. 2F,J).
Figure 3.

Molecular identity of Wnt1-expressing progenitors in vMes at an intermediate developmental stage. A: An E10.5 whole mount embryo indicates the location of vMes, which was dissected for clarity; the plane of sagittal sections are shown. B: Illustration shows transverse plane of analysis. C–E: Coronal sections at rostral (C) and intermediate (D,E) levels analyzed for Lmx1a and Wnt1 expression. F–G: Transverse sections at intermediate (F) and caudal (G) levels analyzed for Otx2 and Wnt1 expression. Brackets show medial (1) and off-midline (2) domains. H–J: Sagittal sections at medial and off-midline planes showing Wnt1(GFP)+ progenitors (green) in the vMes and the indicated markers (red); hoechst staining (blue) shows tissue morphology. Black and white insets show single channel of each marker. K–M: Sections from E10.5 Wnt1-Venus;TOPGAL embryo showing Wnt1(GFP)+ progenitors (green) in the mes and the indicated markers (magenta). K: Rostral Wnt1(GFP)+ progenitors were largely not mitotic (PHH3 negative), expressed LMX1a, and overlapped with OTX2. L: Intermediate Wnt1(GFP)+ progenitors were also largely not mitotic, did not express LMX1a, and overlapped with OTX2. M: Caudal Wnt1(GFP)+ progenitors were also largely not mitotic, expressed LMX1a, and overlapped with OTX2. Scale bar = 16μm (B–J).
Whole mount embryos at E10.5 had a Wnt1(YFP) expression domain that underwent restriction and appeared identical to the well-described Wnt1 gene expression domain (Fig. 3A) (Ellisor et al., 2009; Zervas et al., 2004). We micro-dissected the vMes domain to more clearly discern this morphologically complex domain which contained two curved bi-lateral strips of Wnt1(YFP) expressing cells (Fig. 3A). Analysis of coronal, transverse, and sagittal sections revealed highly complex domains (Fig. 3B–M). The Lmx1a domain in the rostral coronal plane of the vMes was broader (in the medial lateral axis) and longer (anterior posterior) versus the intermediate Lmx1a domain, which was more confined to the midline (compare Fig. 3C,D). At the intermediate coronal level, Lmx1a was expressed in a medial domain (Fig. 3D) while Wnt1 was present in two bilateral stripes that apparently overlap with Lmx1a; notably the most midline domain was Wnt1-/Lmx1a+ (Fig. 3D,E). In transverse sections at the intermediate level at E10.5, Wnt1 was confined to two bi-lateral angled strips that overlapped with Otx2 (Fig. 3F, arrow 1). In the intermediate transverse plane, just off the midline, only a small corner of Wnt1 expression was detected (Fig. 3F, intersection of 1 and 2). In contrast, the off-midline ventral domain had robust Otx2 expression although there was a ventral tier furthest from the ventricle that was devoid of Otx2 (Fig. 3F, arrow 2). The caudal region of the vMes had a broad domain of Wnt1 that substantially overlapped with Otx2; this domain was twice as wide compared to intermediate regions (Fig. 3G). The complexity of the expression domains were confirmed in medial and off-midline sagittal sections analyzed by double immunocytochemistry for Wnt1(GFP), and Otx2, Lmx1a, or pHH3 (Fig. 3H–J). For example, the medial domain was characterized as Wnt1(GFP)+/Otx2+/Lmx1a+ with mitotic cells primarily adjacent to the ventricle (Fig. 3H–J, medial). In contrast, the off-midline domain could be divided into three regions: rostral, intermediate, and caudal based on marker expression (Fig. 3H–J, off-midline). The rostral domain contained only a rare Wnt1(GFP)+ progenitor that was mitotic (pHH3+) and nearly all rostral Wnt1(GFP)+ progenitors expressed LMX1a and OTX2 (Fig. 3H,K). The intermediate portion of the vMes could be partitioned into a upper and a lower tier based on the molecular identity of progenitors (Fig. 3I, off-midline). The upper tier (closest to the ventricle) was typically devoid of, or only sparsely contained, Wnt1(GFP)+ progenitors (Fig. 3I,L). The upper tier contained pHH3+ mitotic cells that largely did not express Wnt1(GFP) or LMX1a (Fig. 3L). OTX2+ cells were detected in the upper and lower tiers but did not substantially overlap with Wnt1(GFP)-expressing progenitors in the intermediate region (Fig. 3H,L). The lower tier (furthest from the ventricle) of off-midline vMes cells were non-mitotic (Wnt1(GFP)+/pHH3−) and did not express Lmx1a (Wnt1(GFP)+/LMX1a−) (Fig. 3H,L). In contrast, the caudal domain did not appear as two molecularly distinct tiers, contained very few Wnt1(GFP)+ progenitors that were mitotic (pHH3+), and had many Wnt1(GFP)+ progenitors that co-expressed both LMX1a and OTX2 (Fig. 3J,M).
At E12.5, the vMes Wnt1(GFP)+ domain was readily detectable in whole mount embryos (Fig. 4A). We also characterized expression at the cellular level on medial and off-midline sagittal sections (Fig. 4B–E). In the medial plane, the vMes cells positioned at rostral, intermediate, and caudal locations were Wnt1(GFP)+ and also expressed LMX1a+ and OTX2+ (Fig. 4B,C). At this stage, differentiating MbDA neurons (TH+) were centered at the caudal vMes flexure and tapered off both rostrally and caudally (Fig. 4D). Thus, vMes cells consisted of a mixed populations of Wnt1(GFP)+/Otx2+/Lmx1a+/TH+ MbDA neurons and Wnt1(GFP)+/Otx2+/Lmx1a+/TH− progenitors. Mitotic cells (pHH3+) cells were detected primarily in the upper tier of the vMes, closest to the ventricle (Fig. 4E) and had an identity of Wnt1(GFP)+/Otx2+/Lmx1a+/pHH3+/TH−. Just lateral to the medial domain (off-midline), the expression domains were discontinuous, similar to the off-midline domains at E10.5. At the off-midline plane, caudal Wnt1(GFP) expression was more restricted than at E10.5 and consisted of a sharp wedge at the midbrain-hindbrain boundary (Fig. 4B,C,D arrowheads and 3H). At the intermediate level, the Wnt1(GFP)+ cells located closest to the flexure were confined to a small strip that was LMX1a+/Otx2−/pHH32− (Fig. 4B–E, off-midline). In contrast, cells closest to the ventricle were Wnt1(GFP) 2−/LMX1a2−/Otx2+/pHH3+. The rostral Wnt1(GFP)+ cells had largely not yet begun to differentiate and fewer cells coexpressed TH than at the intermediate and caudal domains (Fig. 4D). Analysis of transverse sections at the vMes flexure revealed that at the rostral end of the flexure, cells located directly at the midline were Wnt1(GFP) 2−/Otx2+/Lmx1a+/TH+ and those located adjacent to the midline (medial plane) were Wnt1(GFP)+/Otx2+/Lmx1a+/TH+ (Fig. 4H–K, transverse, r). At intermediate transverse levels, the Wnt1(GFP)+ progenitors were divided into an upper Otx2+/Lmx1a+/TH-domain consistent with MbDA progenitors and a lower tier of Wnt1(GFP)+/Otx2−/Lmx1a−/TH+ differentiating MbDA neurons. Just lateral to this domain, only a ventral tier of Wnt1(GFP)+/Otx2−/Lmx1a−/TH+ cells were present (Fig. 4H–K, transverse, i; *). Finally, at the caudal vMes flexure, two bilateral stripes of Wnt1(GFP)+/Otx2+/Lmx1a+ cells flanked a midline domain of Wnt1(GFP)−/Otx2+/Lmx1a+/TH+ cells (Fig. 4H–K, transverse, c). We confirmed the complex arrangement of Otx2 and Lmx1a in horizontal sections, which showed both overlapping and mutually exclusive patterns of expression (Fig. 4L–N). In summary, the molecular identity of vMes Wnt1(GFP)+ cells was dynamic and existed in a complex pattern that changed dynamically between E8.5 and E12.5.
Wnt1 lineage-derived MbDA neurons marked from E7.5–E13.5
We previously used GIFM to demonstrate that Wnt1 and Gli1 lineages derived from progenitors within the vMes give rise to MbDA neurons (Zervas et al., 2004). In our current study, we expanded upon and provided depth to previously published findings to test the hypothesis that genetic lineage and the timing of gene expression in a pool of progenitors differentially defines the diverse array of adult MbDA neuron subpopulations (Fig. 5). Specifically, we asked whether Wnt1-expressing MbDA neuron progenitors gave rise to spatially or biochemically distinct subtypes of MbDA neurons depending on when they expressed Wnt1. Because of the nature of the TaumGFP reporter, we could clearly identify the TH+ MbDA neurons derived from the Wnt1 lineage by coincident nuclear β-gal immunolabeling (Brown et al., 2009; Ellisor et al., 2009). We first addressed in a broad qualitative survey whether MbDA neuron progenitors marked at discrete time points gave rise to unique or multiple functional domains (VTA, RRF, SNc). The Wnt1 lineage contributed to VTA (Fig. 6A–G), RRF (Fig. 6H–N), and SNc (Fig. 6O–U) MbDA neurons from all marking time points (tamoxifen administration at E7.5–E13.5). We then used triple immunofluorescent labeling to ascertain whether molecularly distinct MbDA neurons were uniquely derived from the Wnt1 lineage marked at specific time points. The Wnt1 lineage gave rise to calbindin (Fig. 7A–G), GIRK2 (Fig. 7H–N), and calretinin (Fig. 7O–U) expressing MbDA neurons at all marking stages.
Figure 5.

The distribution of MbDA neurons in adult mouse. A: Each individual MbDA neuron was analyzed in forty horizontal sections that contain all adult MbDA neurons. On each 40 μm thick section, a dot was placed on immunolabeled (TH+) MbDA neuron and reconstructed in three dimensions using Volocity 3D module to show the full distribution of MbDA neurons; the VTA and SNc are indicated. B–D: Adjacent sections were immunolabeled for TH (green) and the indicated marker (red) to label MbDA neuron subtypes. E: The three dimensional distribution of MbDA neuron subtypes. Scale bar = 32μm (B–D).
Figure 7.

Biochemically distinct MbDA neuron subtypes were derived from progenitors expressing Wnt1 over a prolonged time period. MbDA neurons in adult Wnt1-CreERT;TaumGFP mice were marked by tamoxifen administration at distinct 24 hour time points between E7.5–E13.5. A–G: Wnt1-derived MbDA neurons from VTA that expressed calbindin. H–N: Wnt1-derived MbDA neurons from SNc that expressed GIRK2. O–V: Wnt1-derived MbDA neurons that expressed calretinin. The panels show a single optical plane (1μm thick) after iterative restoration using Volocity software to deconvolve collected Z-series image stacks. MbDA neurons (TH+, green), the Wnt1 lineage (β-gal+, blue), and the expression of distinct molecular markers (calbindin, GIRK2, or calretinin as indicated, green). Arrows show examples of triple immunolabeled neurons that expressed TH, β-gal, and molecular markers in the XY plane. The XZ and YZ planes are shown to further confirm the overlap of the three markers. Scale Bar = 32μm.
Because of the strong contribution of the Wnt1 lineage to MbDA neuron subtypes and domains across a broad epoch of marking, we performed a comparative analysis of the relative contribution of the Wnt1 lineage to MbDA neuron groups and nearby anatomically distinct non-MbDA neuron containing domains (Fig. 8). We identified distinct Mb structures on Nissl stained sections (Fig. 8A,B) and on adjacent sections immunolabeled for β-gal and counterstained with hoechst nuclear stain. The structures analyzed were the subthalamic nucleus (STh), interfascicular nucleus (IFN), posterior hypothalamic area (PHA), the substantia nigra pars reticulata (SNr), the red nucleus (RN), and the Edinger-Westphal (EW) nucleus (Fig. 8C,D). Representative examples of marking at E9.5 in both a dorsal and intermediate section are shown in Fig. 8C, D. Finally, we used calbindin, GIRK-2, calretinin, and BRN3a to further identify the VTA, SNc, RRF, and EW and RN nuclei, respectively (Figs. 8E,F and Fig. 7). Wnt1-expressing progenitors marked at E9.5 showed a biased contribution to the VTA, RRF, and SNc (Fig. 8C,D). In contrast, there were relatively fewer marked cells in six comparative ventral Mb structures at all marking stages; for example, the Wnt1 lineage contributed to fewer BRN3a+ neurons in the EW nucleus and rarely to BRN3a+ neurons in the RN compared (Fig. 8C,D). We tabulated the distribution across all marking periods (n=3 mice per time point), which uncovered that the Wnt1 lineage predominantly contributed to MbDA neuron domains compared to other ventral Mb structures, although the contribution to other structures occurred to different degrees at different time points (Fig. 8G). At E7.5, the Wnt1 lineage contribution to MbDA neurons and to neurons in the IFN, PHA, and RN was similar (Fig. 8G). Marking at E7.5 did not result in contribution to neurons of the STh and SNr and provided only a minor contribution to the EW nucleus (Fig. 8G). Marking at E8.5 and E9.5 was the only time period that the Wnt1 lineage contributed to neurons in the STh and SNr (Fig. 8G). The peak contribution to the RN occurred with marking at E7.5 and E8.5 while the peak contribution to the EW was at E9.5 (Fig. 8G). Wnt1-expressing cells marked at E10.5 no longer contributed to the STh, SNr, RN, or EW nucleus and marking at E10.5 appeared to be a time point where the lineage contribution to non-MbDA nuclei was at the lowest level (Fig. 8G). From E11.5–E13.5, the Wnt1 lineage contribution to the IFN, PHA, and RN declined rapidly. At E13.5, there was very little to no contribution to most vMb structures although contribution to VTA, RRF, and SNc persisted (Fig. 8G). Interestingly, there was a progressive restriction of the Wnt1 lineage to vMb structures with the apparent exception of MbDA neuron domains (Fig. 8H).
Quantitative contribution of Wnt1-expressing progenitors to adult MbDA neurons
Our initial qualitative analysis of the Wnt1 lineage marked from E7.5–E13.5 revealed changes in how Wnt1-expressing progenitors contributed to MbDA domains, although a overt binary or purely selective contribution was not observed. We therefore quantitatively determined the lineage contribution to adult MbDA neurons in horizontal sections and assessed the contribution in the medial-lateral, dorsal-ventral, and rostral-caudal orientations. The primary goal of this study was to test the hypothesis that Wnt1-expressing progenitors had restricted competence and that the Wnt1 lineage contribution to MbDA neurons was progressively restricted over time. To perform this analysis we double immunolabeled five horizontal sections with antibodies that recognize TH and β-gal (Table 1, Figs. 9,10) to identify Wnt1-derived MbDA neurons marked at specific time points. This allowed us to represent the entire extent of MbDA neuron distribution (Fig. 9). Counting frames were applied to reproducibly identify distinct subdomains of MbDA neurons (Figs. 9,10; See Methods for details) and to determine the density of fate mapped MbDA neurons in the adult brain (Figs. 11–14).
There was a significant change in the contribution of Wnt1-expressing cells to the entire MbDA neuron population as a whole and as a function of gestational day of marking (Fig. 11A, Table 2). The Wnt1 lineage contribution was significantly explained by a linear plus quadratic function (p<0.0001 for both terms) (Fig. 11A, black trend line, Table 2). More specifically, Wnt1-expressing progenitors from E7.5–E9.5 gave rise to increasingly more MbDA neurons in a linear manner, reached a peak level of contribution at approximately E9.5, and decreased over subsequent days (Fig. 11A). Wnt1-expressing progenitors from E10.5–E13.5 gave rise to progressively less MbDA neurons in a pattern that was best fit by a negative quadratic regression (Fig. 11A). While the linear plus quadratic equation was a statistically significant predictor of the pattern of contribution over gestational days E7.5–13.5, we observed that the Wnt1 lineage appeared to give rise to a lower than predicted proportion of MbDA neurons at E10.5. We therefore compared the time points immediately preceding and following E10.5 using orthogonal linear contrasts in a second model where gestational day was again treated as a categorical measure (Fig. 11A, inset). This analysis showed that the lineage contribution at E10.5 was, indeed, significantly less than at E9.5 or E11.5 (p<0.0001, each time point), whereas the linear plus quadratic equation would predict E10.5 would have been less than E9.5 and greater than E11.5. In other words, there was a decrease in contribution from E9.5 to E10.5 and an increase in contribution from E10.5 to E11.5. The contribution of the Wnt1 lineage to VTA, RRF, and SNc (Fig. 12, Table 2) also followed a regression model similar to the model for the contribution of the Wnt1 lineage to MbDA neurons as a whole (red trend lines). The contribution of the Wnt1 lineage to RRF, VTA, and SNc, also showed a decrease in contribution from E9.5–E10.5 and an increase in contribution from E10.5–11.5 (Fig. 12A–C, insets). Finally, we tested how the Wnt1 lineage contributed to rostral-caudal (Fig. 13, Table 2) or dorsal-ventral MbDA neurons (Fig. 14, Table 2). We observed that, similar to the Wnt1 lineage contribution described above for total, VTA, RRF, and SNc MbDA neurons, the proportion of lineage derived MbDA neurons was best fit by a linear plus quadratic function (Figs. 13, 14). The exception to this pattern was the Wnt1 lineage contribution to ventral MbDA neurons (Fig. 14C). The earliest marking period (tamoxifen at E7.5) yielded the greatest contribution to ventral MbDA neurons while later time points showed a similar pattern to other domains (Fig. 14C). Finally, we performed more nuanced comparisons of the lineage contribution: 1. RRF and rostral VTA and rostral SNc because of their similar location along the rostral caudal axis (See Fig. 9), 2. rostral versus caudal VTA and rostral versus caudal SNc. The distribution of the Wnt1 lineage was not different when comparing these domains (data not shown).
Table 2. Raw data: the relative contribution of Wnt1-expressing progenitors marked at distinct developmental timepoints to MbDA Neurons.
Raw Quantitative Data describing the relative contribution of Wnt1-expressing progenitors marked at distinct developmental time points to MbDA neurons. The data indicate 1) the average percentage ± the standard deviation (SD) of Wnt1-derived MbDA neurons (βgal+/TH+) when compared to total MbDA neurons (βgal+/TH+ and βgal−/TH+ neurons) 2) the average number ± SD of Wnt1-derived MbDA neurons (βgal+/TH+) and 3) the average number of total MbDA neurons (βgal+/TH+ and βgal−/TH+ neurons) in a given region.
| Time of Tamoxifen Administration | E7.5 | E8.5 | E9.5 | E10.5 | E11.5 | E12.5 | E13.5 |
|---|---|---|---|---|---|---|---|
| Wnt1-Derived MbDA Neurons (percentage ± SD) | 26 ± 6% | 32 ± 22% | 49 ± 13% | 13 ± 17% | 36 ± 8% | 14 ± 14% | 7 ± 9% |
| Wnt1-Derived MbDA Neurons (count ± SD) | 172 ± 43 | 181 ± 101 | 315 ± 75 | 83 ± 114 | 220 ± 52 | 97 ± 97 | 37 ± 48 |
| MbDA Neurons (count ± SD) | 637 ± 59 | 600 ± 71 | 652 ± 63 | 623 ± 34 | 596 ± 52 | 656 ± 38 | 543 ± 33 |
| Wnt1-Derived VTA MbDA Neurons (percentage ± SD) | 26 ± 8% | 37 ± 26% | 51 ± 9% | 15 ± 21% | 32 ± 9% | 19 ± 12% | 10 ± 11% |
| Wnt1-Derived VTA MbDA Neurons (count ± SD) | 64 ± 19 | 71 ± 32 | 128 ± 10 | 34 ± 49 | 73 ± 20 | 50 ± 36 | 20 ± 21 |
| VTA MbDA Neurons (count ± SD) | 252 ± 44 | 212 ± 46 | 254 ± 20 | 233 ± 11 | 231 ± 17 | 247 ± 34 | 204 ± 11 |
| Wnt1-Derived RRF MbDA Neurons (percentage ± SD) | 28 ± 10% | 34 ± 14% | 50 ± 31% | 13 ± 23% | 37 ± 15% | 9 ± 14% | 2 ± 3% |
| Wnt1-Derived RRF MbDA Neurons (count ± SD) | 9 ± 3 | 9 ± 5 | 13 ± 8 | 4 ± 6 | 8 ± 3 | 2 ± 3 | 0 ± 1 |
| RRF MbDA Neurons (count ± SD) | 34 ± 4 | 26 ± 8 | 29 ± 6 | 26 ± 7 | 24 ± 10 | 29 ± 10 | 27 ± 5 |
| Wnt1-Derived SNc MbDA Neurons (percentage ± SD) | 28 ± 6% | 29 ± 21% | 47 ± 14% | 12 ± 15% | 39 ± 8% | 12 ± 15% | 5 ± 8% |
| Wnt1-Derived SNc MbDA Neurons (count ± SD) | 99 ± 24 | 101 ± 65 | 174 ± 59 | 45 ± 58 | 134 ± 34 | 45 ± 59 | 17 ± 26 |
| SNc MbDA Neurons (count ± SD) | 351 ± 17 | 362 ± 29 | 370 ± 59 | 364 ± 45 | 341 ± 31 | 379 ± 15 | 313 ± 30 |
| Wnt1-Derived Rostral MbDA Neurons (percentage ± SD) | 26 ± 6% | 30 ± 21% | 48 ± 9% | 14 ± 18% | 40 ± 10% | 13 ± 14% | 6 ± 11% |
| Wnt1-Derived Rostral MbDA Neurons (count ± SD) | 73± 11 | 79 ± 48 | 132 ± 38 | 38 ± 51 | 101 ± 27 | 37 ± 40 | 15 ± 26 |
| Rostral MbDA Neurons (count ± SD) | 284 ± 24 | 272 ± 23 | 279 ± 52 | 268 ± 30 | 253 ± 29 | 283 ± 8 | 218 ± 13 |
| Wnt1-Derived Intermediate MbDA Neurons (percentage ± SD) | 28 ± 9% | 32 ± 25% | 52 ± 16% | 14 ± 20% | 35 ± 8% | 17 ± 14% | 7 ± 6% |
| Wnt1-Derived Intermediate MbDA Neurons (count ± SD) | 44 ± 18 | 41 ± 24 | 77 ± 15 | 28 ± 23 | 49 ± 10 | 31 ± 29 | 10 ± 10 |
| Intermediate MbDA Neurons (count ± SD) | 151 ± 29 | 139 ± 24 | 154 ± 23 | 143 ± 22 | 138 ± 3 | 167 ± 27 | 135 ± 14 |
| Wnt1-Derived Caudal MbDA Neurons (percentage ± SD) | 27 ± 5% | 34 ± 21% | 49 ± 16% | 12 ± 16% | 32 ± 8% | 14 ± 14% | 7 ± 7% |
| Wnt1-Derived Caudal MbDA Neurons (count ± SD) | 55 ± 16% | 61 ± 29 | 105 ± 29 | 28 ± 40 | 66 ± 15 | 29 ± 28 | 12 ± 12 |
| Caudal MbDA Neurons (count ± SD) | 202 ± 37 | 188 ± 25 | 219 ± 22 | 212 ± 32 | 205 ± 26 | 206 ± 26 | 190 ± 35 |
| Wnt1-Derived Dorsal MbDA Neurons (percentage ± SD) | 27 ± 5% | 28 ± 11% | 53 ± 15% | 13 ± 20% | 29 ± 3% | 11 ± 11% | 5 ± 6% |
| Wnt1-Derived Dorsal MbDA Neurons (count ± SD) | 34 ± 4 | 31 ± 7 | 73 ± 25 | 18 ± 28 | 38 ± 4 | 13 ± 14 | 6 ± 6 |
| Dorsal MbDA Neurons (count ± SD) | 127 ± 6 | 115 ± 17 | 138 ± 12 | 142 ± 24 | 132 ± 23 | 119 ± 4 | 110 ± 5 |
| Wnt1-Derived Intermediate MbDA Neurons (percentage ± SD) | 26 ± 5% | 36 ± 30% | 46 ± 13% | 12 ± 17% | 35 ± 11% | 14 ± 13% | 7 ± 6% |
| Wnt1-Derived intermediate MbDA Neurons (count ± SD) | 52 ± 21 | 60 ± 42 | 90 ± 23 | 24 ± 35 | 55 ± 12 | 30 ± 31 | 10 ± 8 |
| Intermediate MbDA Neurons (count ± SD) | 202 ± 63 | 179 ± 23 | 198 ± 4 | 174 ± 21 | 159 ± 23 | 198 ± 33 | 148 ± 42 |
| Wnt1-Derived Ventral MbDA Neurons (percentage ± SD) | 54 ± 40% | 31 ± 21% | 49 ± 14% | 13 ± 16% | 40 ± 9% | 16 ± 16% | 7 ± 10% |
| Wnt1-Derived Ventral MbDA Neurons (count ± SD) | 86 ± 25 | 90 ± 52 | 152 ± 52 | 41 ± 51 | 122 ± 40 | 54 ± 53 | 21 ± 33 |
| Ventral MbDA Neurons (count ± SD) | 233 ± 152 | 306 ± 43 | 317 ± 70 | 307 ± 41 | 304 ± 34 | 339 ± 13 | 285 ± 25 |
DISCUSSION
In this study, we characterize the molecular identity of MbDA neuron progenitors expressing Wnt1 at early, intermediate, and late stages of MbDA neuron development. Our analysis of Wnt1-expressing MbDA progenitors, using Wnt1-Venus transgenic embryos, shows that Wnt1-expressing progenitors dynamically change from E8.5 to E12.5, which is a critical developmental window for MbDA neurons (Ang, 2006). Our analysis defines E8.5 as an early phase in shaping the molecular identity of the vMes. In addition, our analysis reveals a complex spatial arrangement of molecularly defined vMes progenitors and specifically Wnt1(GFP) expressing progenitors at E10.5 and E12.5. These findings enhance existing studies describing Otx2 and Lmx1a expression domains (Andersson et al., 2006; Omodei et al., 2008; Ono et al., 2007; Saarimäki-Vire et al., 2007). We also show that there is a temporal relationship between the Wnt1 lineage, derived from Wnt1-expressing MbDA progenitors, and the lineage contribution to the total population of MbDA neurons as well as to the VTA, RRF, and SNc subregions. First, we show that Wnt1-expressing progenitors contribute to MbDA neurons when marked from E7.5 to E13.5 and that they give rise to a physiologically diverse array of MbDA neurons as evident by their expression of calbindin, calretinin, and GIRK2 (McRitchie et al., 1996; Neuhoff et al., 2002; Thompson et al., 2005). Thus, we have definitively identified an important MbDA neuron progenitor pool in vivo and delineated the temporal window that defines MbDA neuron progenitors.
Interestingly, while the Wnt1 lineage does give rise to other vMb structures to varying degrees at specific time points, the contribution of the Wnt1 lineage to MbDA neurons is always much more extensive than the contribution to non-MbDA neuron vMb structures at all time points examined. This finding is important in the context of cell fate and lineage decisions. Cell lineages often follow a progressive restriction model whereby a lineage loses its competence to generate cell types over time. This mechanism is used in drosophila neuroblasts, vertebrate retina, and cerebral cortex to generate specific classes of neurons (Batista-Brito and Fishell, 2009; Livesey and Cepko, 2001; Okano and Temple, 2009; Pearson and Doe, 2004). We ascertained whether lineage restriction applies to the Wnt1 lineage contribution to the vMb. Because the Wnt1 gene expression domain is initially broad (E8.5) and becomes restricted to a ring at the posterior vMes and two midline stripes by E9.5 (Wilkinson et al., 1987, Ellisor et al., 2009) an appropriate analysis is to compare the Wnt1 lineage marked from E9.5–E12.5 when Wnt1 expression domain is fixed. Interestingly, the E9.5 marking resulted in similar contribution to vMb structures as when marked a day earlier. However, we observed a qualitative restriction of the Wnt1 lineage contribution to vMb structures over time (Fig. 8G,H). Therefore, the vMb structures are established using a similar restricted competence model as the aforementioned systems.
The high degree of specificity of the Wnt1 lineage contribution to MbDA neurons is strong evidence that the Wnt1-expressing progenitors in the vMes are an essential pool of MbDA progenitors in vivo. Given that we observe a general progressive lineage restriction in how Wnt1-derived vMb structures are established and the biased contribution to MbDA neurons, we asked whether progressive lineage restriction applies to the establishment of MbDA neuron subtypes. The specific hypothesis that we tested using quantitative GIFM is that MbDA neurons of the VTA, RRF, and SNc are generated by progressive lineage restriction within the MbDA progenitor pool. Implicit in our hypothesis was that MbDA structures would change differentially with regards to their relative contribution from the Wnt1 progenitor pool over the times at which their Wnt1-expressing progenitors were marked. For example, one might expect SNc proportions to be highest from earlier times and decline for later time points, while a different pattern would be true for RRF or VTA. This hypothesis was tested in two different models. The first was represented as the interaction terms for (structure) X (gestational day) and (structure) X (gestational day)2 in a model containing these effects as well as the main effects for structure, gestational day, and gestational day2, with gestational day treated as a continuous measure. The second was represented as the interaction terms for (structure) X (gestational day) in a model containing these effects as well as the main effects for structure and gestational day, with gestational day treated as a categorical term. None of the interaction terms were statistically significant (model 1: p=0.6460 and p=0.5726, respectively; Model 2: p=0.2754) indicating that there is not a unique Wnt1 lineage contribution to distinct MbDA subtypes at different times. This result implies that MbDA neuron heterogeneity is not due to progressive lineage restriction within the pool of Wnt1-expressing progenitors. Rather, we have shown that lineage and timing are related to global MbDA neuron distribution over time. This is also true of MbDA neurons in the VTA, RRF, and SNc, although no unique domain of contribution was observed based on tamoxifen administration. Therefore, in contrast to lineage restriction seen in neuroblasts, retina, and cortex, the Wnt1-expressing progenitor pool does not initially contribute to a broad population of MbDA neuron subtypes (encompassing the VTA, RRF, and SNc) and then become restricted to generate only a subset of MbDA neurons later in development. It should be noted that given the limitations of the statistical model we used to determine the mechanism of the contribution, it remains possible that progressive lineage restriction occurs but is masked by differential survival or proliferation. However, these effects would have to be roughly inversely proportional to any differences in migration in order to cancel them out such that no differences would be observed. There is currently no evidence for such control and this outcome would seem a less parsimonious explanation than simply acknowledging a failure to detect evidence of progressive lineage restriction.
Interestingly, with GIFM we uncovered that the Wnt1 lineage contribution is more complex than a model of limiting competency and is best explained by a second order polynomial function (significance: p<0.0001). The first part of the polynomial function indicates that Wnt1-expressing progenitors from E7.5–E9.5 give rise to increasingly more MbDA neurons linearly that reaches a peak level of contribution at E9.5. This is interesting for two reasons. First, birth dating experiments in mouse showed that the peak of MbDA neuron differentiation occurs at E12–E13 (Bayer et al., 1995), and our findings indicate that MbDA neurons are specified at a much earlier stage than previously described. Indeed, Wnt1 expression at the 0–1 somite stage already demarcates the MbDA neuron progenitors and this progenitor pool is maintained for a prolonged time (seven days in the mouse). Also, MbDA neuron progenitors are expanding at the same stage (E7.5–E9.5) as when they are induced to become MbDA neurons by SHH and FGF8 signaling (Ye et al., 1998), which is two to three days prior to their differentiation (Ang, 2006). The second component in the polynomial indicates that the Wnt1 lineage undergoes an exponential decrease and thus gives rise to progressively fewer MbDA neurons from E10.5 to E13.5. This is important because we demonstrate that a MbDA neuron progenitor pool persists even as MbDA neurons begin to differentiate and express TH.
Finally, within the complex pattern of Wnt1 lineage contribution, we observed that the Wnt1 lineage gives rise to the least number of MbDA neurons at E10.5. To verify this pattern in contribution, we compared the time points immediately preceding and following E10.5 and showed that the lineage contribution at E10.5 was significantly less than at E9.5 or E11.5 (p<0.0001, each time point), indicating that there is a decrease in contribution from E9.5 to E10.5 and an increase in contribution from E10.5 to E11.5. This drop in contribution occurs during a transitional period where the regional specification of MbDA progenitors is complete and progenitors are beginning an early differentiation phase where immature MbDA neurons are generated (Ang, 2006). The transitional period is in good agreement with the changes in the molecular identity that we describe for Wnt1(GFP)+ MbDA neuron progenitors. One notable event that occurs at E10.5 (the trough of lineage contribution) is the refinement of molecularly distinct progenitor domains in the vMes. An interesting possibility that we are unable to test with our GIFM approach is that Wnt1(GFP)+ progenitors are further partitioned into a progenitor pool that could ultimately refine the distribution of adult MbDA neuron subtypes. In addition, the transition from E8.5 to E10.5 is accompanied by a dynamic shift in the cells that express and respond to SHH signaling. For example, at E8.5 Wnt1 is expressed in close proximity to and partially overlaps with other genes that are critical for MbDA development, including Shh and Gli1 (Zervas et al., 2004). In contrast, at E10.5 the Shh domain in the vMes broadens substantially and the vast majority of cells that respond to SHH signaling (Gli1 expressing) are transposed dorsal-laterally and located distal to the Wnt1 expressing domain (Zervas et al., 2004). Interestingly, a small population of progenitors located caudally express Shh and Gli1 in the same domain as Wnt1 at E10.5 (Hayes et al., 2011 accompanying manuscript). The relatively low contribution of Wnt1-expressing progenitors to MbDA neurons at E10.5 could result from Shh antagonizing the positive effects of WNT signaling on MbDA neurogenesis, which has been shown in vitro (Tang et al., 2010). Thus, if SHH signaling is more prevalent at E10.5 than at other time points, this may temporarily result in less contribution from Wnt1-expressing progenitors to MbDA neurons in the adult brain. It was previously proposed that SHH and WNT signaling is controlled in delicate balance (Tang et al., 2010) and this could explain the oscillation of Wnt1 lineage contribution that we observe, although this will require future experiments to confirm.
Interestingly, in addition to the Wnt1 lineage, the Shh and Gli1 lineages have also been shown to give rise to MbDA neurons (Joksimovic et al., 2009; Zervas et al., 2004). Although our GIFM approach is the first to use quantitative analysis to show lineage contribution to adult MbDA neuron subtypes, we were able to make some comparisons between the Wnt1 and Shh lineages (this study, Joksimovic et al., 2009, and Hayes et al., 2011 accompanying manuscript). Interestingly, Wnt1 and Shh genetic lineages give rise to MbDA neurons in different ways. The Wnt1 lineage marked at E7.5 contributes to VTA MbDA neurons while the Shh lineage contribution at this marking stage is extremely sparse compared to the Wnt1 lineage (this study and Joksimovic et al., 2009). In addition, the early pool of progenitors of the Wnt1 lineage, but not the Shh lineage marked by tamoxifen administration at E7.5, gives rise to the RRF and SNc MbDA neurons (compare this study, Joksimovic et al., (2009), and Hayes et al., 2011 accompanying manuscript). Marking a stage later (E8.5) results in continued Wnt1 lineage contribution to VTA, RRF, and SNc MbDA neurons while the Shh lineage just begins to contribute to the SNc domain (Joksimovic et al., (2009), and Hayes et al., 2011 accompanying manuscript). This pattern of lineage contribution continues with marking at E9.5. Finally, with later marking (tamoxifen at E11.5–E12.5) the Wnt1 lineage persists in contributing to VTA, RRF, and SNc MbDA neurons albeit less than at earlier stages while the Shh lineage gives rise to only VTA MbDA neurons (compare this study, Joksimovic et al., (2009), and Hayes et al., 2011 accompanying manuscript). We previously showed that the Gli1 lineage gives rise to MbDA neurons over a short time window (Zervas et al., 2004) while the Wnt1 lineage contribution persists for days after Gli1 contribution is extinguished. Although the temporal overlap of the Gli1 lineage contribution (E7.5–E9.5) is short compared to the time that Wnt1-expressing progenitors contribute to MbDA neurons (E7.5–E13.5) during that short overlap of marking, the Gli1 and Wnt1 lineages contribute to similar MbDA neuron domains. Interestingly, the caudal vMes progenitors expressing Shh and Gli1 during the E9.5 marking epoch contribute primarily to VTA (Hayes et al., 2011 accompanying manuscript). This finding in combination with our Wnt1(GFP) analysis, suggests that this cohort of progenitors has a Wnt1(GFP)+/LMX1a+/OTX2+/SHH+/GLI1+ molecular identity.
Together these studies and findings suggest that there are both overlapping and non-overlapping MbDA neuron progenitor pools that establish MbDA neuron subtypes based on genetic lineage. This correlates well with how DA neurons subtypes are established in other species. For example, C.elegans sensory ray fins contain DA neurons that are generated from distinct clonal lineages (Lints and Emmons, 1999; Sulston and Horvitz, 1977). This opens the possibility that multiple lineages including the Wnt1, Shh, and Gli1 lineages determines the allocation of MbDA neuron subtypes. Our findings indicate that spatial location, molecular identity, as well as the timing of gene expression may be critical for specifying distinct MbDA subtypes and, in combination with multiple genetic lineages, might be the driving force of generating MbDA neuron heterogeneity in vertebrates.
Acknowledgments
The authors would like to thank the members of the Zervas lab for critical reading of the manuscript and input on the experimental design of this study. We would also like to thank Dr. Sohyun Ahn for insightful comments and discussions about the manuscript and the role of lineages and MbDA neuron development.
This work was supported by the following funding sources: Startup Research Funds (MZ) and in part by the RI Hospital Center for Stem Cell Biology (701-1960) (MZ); Brown University Neuroscience Graduate Program NIH Advanced Predoctoral Training Grant (NS062443-02) and Brown Institute for Brain Science Kaplan Summer Graduate Award (AB).
LITERATURE CITED
- Altar A, Neve KA, Loughlin SE, Marshall JF, Fallon JH. The crossed mesostriatal projection: neurochemistry and developmental response to lesion. Brain Res. 1983;279(1–2):1–8. doi: 10.1016/0006-8993(83)90157-9. [DOI] [PubMed] [Google Scholar]
- Andersson E, Tryggvason U, Deng Q, Friling S, Alekseenko Z, Robert B, Perlmann T, Ericson J. Identification of intrinsic determinants of midbrain dopamine neurons. Cell. 2006;124(2):393–405. doi: 10.1016/j.cell.2005.10.037. [DOI] [PubMed] [Google Scholar]
- Ang SL. Transcriptional control of midbrain dopaminergic neuron development. Development. 2006;133(18):3499–3506. doi: 10.1242/dev.02501. [DOI] [PubMed] [Google Scholar]
- Batista-Brito R, Fishell G. The developmental integration of cortical interneurons into a functional network. Curr Top Dev Biol. 2009;87:81–118. doi: 10.1016/S0070-2153(09)01203-4. [DOI] [PMC free article] [PubMed] [Google Scholar]
- Bayer SA, Wills KV, Triarhou LC, Ghetti B. Time of neuron origin and gradients of neurogenesis in midbrain dopaminergic neurons in the mouse. Exp Brain Res. 1995;105(2):191–199. doi: 10.1007/BF00240955. [DOI] [PubMed] [Google Scholar]
- Brenner RM, Slayden OD, Rodgers WH, Critchley HO, Carroll R, Nie XJ, Mah K. Immunocytochemical assessment of mitotic activity with an antibody to phosphorylated histone H3 in the macaque and human endometrium. Hum Reprod. 2003;18(6):1185–1193. doi: 10.1093/humrep/deg255. [DOI] [PubMed] [Google Scholar]
- Brown A, Brown S, Ellisor D, Hagan N, Normand E, Zervas M. A practical approach to genetic inducible fate mapping: a visual guide to mark and track cells in vivo. J Vis Exp. 2009;(34) doi: 10.3791/1687. [DOI] [PMC free article] [PubMed] [Google Scholar]
- Buck K, Ferger B. L-DOPA-induced dyskinesia in Parkinson's disease: a drug discovery perspective. Drug Discov Today. 2010;15(19–20):867–875. doi: 10.1016/j.drudis.2010.08.014. [DOI] [PubMed] [Google Scholar]
- Calabresi P, Di Filippo M, Ghiglieri V, Tambasco N, Picconi B. Levodopa-induced dyskinesias in patients with Parkinson's disease: filling the bench-to-bedside gap. Lancet Neurol. 2010;9(11):1106–1117. doi: 10.1016/S1474-4422(10)70218-0. [DOI] [PubMed] [Google Scholar]
- Castelo-Branco G, Wagner J, Rodriguez FJ, Kele J, Sousa K, Rawal N, Pasolli HA, Fuchs E, Kitajewski J, Arenas E. Differential regulation of midbrain dopaminergic neuron development by Wnt-1, Wnt-3a, and Wnt-5a. Proc Natl Acad Sci U S A. 2003;100(22):12747–12752. doi: 10.1073/pnas.1534900100. [DOI] [PMC free article] [PubMed] [Google Scholar]
- Chung S, Leung A, Han BS, Chang MY, Moon JI, Kim CH, Hong S, Pruszak J, Isacson O, Kim KS. Wnt1-lmx1a forms a novel autoregulatory loop and controls midbrain dopaminergic differentiation synergistically with the SHH-FoxA2 pathway. Cell Stem Cell. 2009;5(6):646–658. doi: 10.1016/j.stem.2009.09.015. [DOI] [PMC free article] [PubMed] [Google Scholar]
- Damier P, Hirsch EC, Agid Y, Graybiel AM. The substantia nigra of the human brain. II. Patterns of loss of dopamine-containing neurons in Parkinson's disease. Brain. 1999;122 ( Pt 8):1437–1448. doi: 10.1093/brain/122.8.1437. [DOI] [PubMed] [Google Scholar]
- DasGupta R, Fuchs E. Multiple roles for activated LEF/TCF transcription complexes during hair follicle development and differentiation. Development. 1999;126(20):4557–4568. doi: 10.1242/dev.126.20.4557. [DOI] [PubMed] [Google Scholar]
- Deutch AY, Goldstein M, Baldino F, Jr, Roth RH. Telencephalic projections of the A8 dopamine cell group. Ann N Y Acad Sci. 1988;537:27–50. doi: 10.1111/j.1749-6632.1988.tb42095.x. [DOI] [PubMed] [Google Scholar]
- Echelard Y, Vassileva G, McMahon AP. Cis-acting regulatory sequences governing Wnt-1 expression in the developing mouse CNS. Development. 1994;120(8):2213–2224. doi: 10.1242/dev.120.8.2213. [DOI] [PubMed] [Google Scholar]
- Ellisor D, Koveal D, Hagan N, Brown A, Zervas M. Comparative analysis of conditional reporter alleles in the developing embryo and embryonic nervous system. Gene Expr Patterns. 2009;9(7):475–489. doi: 10.1016/j.gep.2009.07.007. [DOI] [PMC free article] [PubMed] [Google Scholar]
- Ellisor D, Zervas M. Tamoxifen dose response and conditional cell marking: is there control? Mol Cell Neurosci. 2010;45(2):132–138. doi: 10.1016/j.mcn.2010.06.004. [DOI] [PubMed] [Google Scholar]
- Fallon JH. Collateralization of monoamine neurons: mesotelencephalic dopamine projections to caudate, septum, and frontal cortex. J Neurosci. 1981;1(12):1361–1368. doi: 10.1523/JNEUROSCI.01-12-01361.1981. [DOI] [PMC free article] [PubMed] [Google Scholar]
- Fallon JH, Opole IO, Potkin SG. The neuroanatomy of schizophrenia: circuitry and neurotransmitter systems. Clinical Neuroscience Research. 2003;3:77–107. [Google Scholar]
- Feil R, Brocard J, Mascrez B, LeMeur M, Metzger D, Chambon P. Ligand-activated site-specific recombination in mice. Proc Natl Acad Sci U S A. 1996;93(20):10887–10890. doi: 10.1073/pnas.93.20.10887. [DOI] [PMC free article] [PubMed] [Google Scholar]
- Fetissov SO, Bensing S, Mulder J, Le Maitre E, Hulting AL, Harkany T, Ekwall O, Skoldberg F, Husebye ES, Perheentupa J, Rorsman F, Kampe O, Hokfelt T. Autoantibodies in autoimmune polyglandular syndrome type I patients react with major brain neurotransmitter systems. J Comp Neurol. 2009;513(1):1–20. doi: 10.1002/cne.21913. [DOI] [PubMed] [Google Scholar]
- Franklin K, Paxinos G. The Mouse Brain in Stereotaxic Coordinates. Academic Press; 2007. [Google Scholar]
- Gale SD, Person AL, Perkel DJ. A novel basal ganglia pathway forms a loop linking a vocal learning circuit with its dopaminergic input. J Comp Neurol. 2008;508(5):824–839. doi: 10.1002/cne.21700. [DOI] [PubMed] [Google Scholar]
- Gautron L, Lee C, Funahashi H, Friedman J, Lee S, Elmquist J. Melanocortin-4 receptor expression in a vago-vagal circuitry involved in postprandial functions. J Comp Neurol. 2010;518(1):6–24. doi: 10.1002/cne.22221. [DOI] [PMC free article] [PubMed] [Google Scholar]
- Harrison SJ, Parrish M, Monaghan AP. Sall3 is required for the terminal maturation of olfactory glomerular interneurons. J Comp Neurol. 2008;507(5):1780–1794. doi: 10.1002/cne.21650. [DOI] [PMC free article] [PubMed] [Google Scholar]
- Hippenmeyer S, Vrieseling E, Sigrist M, Portmann T, Laengle C, Ladle DR, Arber S. A developmental switch in the response of DRG neurons to ETS transcription factor signaling. PLoS Biol. 2005;3(5):e159. doi: 10.1371/journal.pbio.0030159. [DOI] [PMC free article] [PubMed] [Google Scholar]
- Horie T, Kusakabe T, Tsuda M. Glutamatergic networks in the Ciona intestinalis larva. J Comp Neurol. 2008;508:249–263. doi: 10.1002/cne.21678. [DOI] [PubMed] [Google Scholar]
- Ikemoto S. Dopamine reward circuitry: two projection systems from the ventral midbrain to the nucleus accumbens-olfactory tubercle complex. Brain Res Rev. 2007;56(1):27–78. doi: 10.1016/j.brainresrev.2007.05.004. [DOI] [PMC free article] [PubMed] [Google Scholar]
- Iverson L, Iverson S, Dunnett S, Bjorklund A. Dopamine Handbook. Oxford University Press; 2010. [Google Scholar]
- Joksimovic M, Anderegg A, Roy A, Campochiaro L, Yun B, Kittappa R, McKay R, Awatramani R. Spatiotemporally separable Shh domains in the midbrain define distinct dopaminergic progenitor pools. Proc Natl Acad Sci U S A. 2009;106(45):19185–19190. doi: 10.1073/pnas.0904285106. [DOI] [PMC free article] [PubMed] [Google Scholar]
- Kawano H, Ohyama K, Kawamura K, Nagatsu I. Migration of dopaminergic neurons in the embryonic mesencephalon of mice. Brain Res Dev Brain Res. 1995;86(1–2):101–113. doi: 10.1016/0165-3806(95)00018-9. [DOI] [PubMed] [Google Scholar]
- Kim JH, Auerbach JM, Rodriguez-Gomez JA, Velasco I, Gavin D, Lumelsky N, Lee SH, Nguyen J, Sanchez-Pernaute R, Bankiewicz K, McKay R. Dopamine neurons derived from embryonic stem cells function in an animal model of Parkinson's disease. Nature. 2002;418(6893):50–56. doi: 10.1038/nature00900. [DOI] [PubMed] [Google Scholar]
- Lee SH, Lumelsky N, Studer L, Auerbach JM, McKay RD. Efficient generation of midbrain and hindbrain neurons from mouse embryonic stem cells. Nat Biotechnol. 2000;18(6):675–679. doi: 10.1038/76536. [DOI] [PubMed] [Google Scholar]
- Lints R, Emmons SW. Patterning of dopaminergic neurotransmitter identity among Caenorhabditis elegans ray sensory neurons by a TGFbeta family signaling pathway and a Hox gene. Development. 1999;126(24):5819–5831. doi: 10.1242/dev.126.24.5819. [DOI] [PubMed] [Google Scholar]
- Livesey FJ, Cepko CL. Vertebrate neural cell-fate determination: lessons from the retina. Nat Rev Neurosci. 2001;2(2):109–118. doi: 10.1038/35053522. [DOI] [PubMed] [Google Scholar]
- Loughlin SE, Fallon JH. Mesostriatal projections from ventral tegmentum and dorsal raphe: cells project ipsilaterally or contralaterally but not bilaterally. Neurosci Lett. 1982;32(1):11–16. doi: 10.1016/0304-3940(82)90221-x. [DOI] [PubMed] [Google Scholar]
- McMahon AP, Bradley A. The Wnt-1 (int-1) proto-oncogene is required for development of a large region of the mouse brain. Cell. 1990;62(6):1073–1085. doi: 10.1016/0092-8674(90)90385-r. [DOI] [PubMed] [Google Scholar]
- McRitchie DA, Hardman CD, Halliday GM. Cytoarchitectural distribution of calcium binding proteins in midbrain dopaminergic regions of rats and humans. J Comp Neurol. 1996;364(1):121–150. doi: 10.1002/(SICI)1096-9861(19960101)364:1<121::AID-CNE11>3.0.CO;2-1. [DOI] [PubMed] [Google Scholar]
- Morona R, Gonzalez A. Immunohistochemical localization of calbindin-D28k and calretinin in the brainstem of anuran and urodele amphibians. J Comp Neurol. 2009;515(5):503–537. doi: 10.1002/cne.22060. [DOI] [PubMed] [Google Scholar]
- Myohanen TT, Venalainen JI, Garcia-Horsman JA, Piltonen M, Mannisto PT. Cellular and subcellular distribution of rat brain prolyl oligopeptidase and its association with specific neuronal neurotransmitters. J Comp Neurol. 2008;507(5):1694–1708. doi: 10.1002/cne.21642. [DOI] [PubMed] [Google Scholar]
- Nemoto C, Hida T, Arai R. Calretinin and calbindin-D28k in dopaminergic neurons of the rat midbrain: a triple-labeling immunohistochemical study. Brain Res. 1999;846(1):129–136. doi: 10.1016/s0006-8993(99)01950-2. [DOI] [PubMed] [Google Scholar]
- Neuhoff H, Neu A, Liss B, Roeper J. I(h) channels contribute to the different functional properties of identified dopaminergic subpopulations in the midbrain. J Neurosci. 2002;22(4):1290–1302. doi: 10.1523/JNEUROSCI.22-04-01290.2002. [DOI] [PMC free article] [PubMed] [Google Scholar]
- Northcutt KV, Wang Z, Lonstein JS. Sex and species differences in tyrosine hydroxylase-synthesizing cells of the rodent olfactory extended amygdala. J Comp Neurol. 2007;500(1):103–115. doi: 10.1002/cne.21148. [DOI] [PubMed] [Google Scholar]
- Okano H, Temple S. Cell types to order: temporal specification of CNS stem cells. Curr Opin Neurobiol. 2009;19(2):112–119. doi: 10.1016/j.conb.2009.04.003. [DOI] [PubMed] [Google Scholar]
- Omodei D, Acampora D, Mancuso P, Prakash N, Di Giovannantonio LG, Wurst W, Simeone A. Anterior-posterior graded response to Otx2 controls proliferation and differentiation of dopaminergic progenitors in the ventral mesencephalon. Development. 2008;135(20):3459–3470. doi: 10.1242/dev.027003. [DOI] [PubMed] [Google Scholar]
- Ono Y, Nakatani T, Sakamoto Y, Mizuhara E, Minaki Y, Kumai M, Hamaguchi A, Nishimura M, Inoue Y, Hayashi H, Takahashi J, Imai T. Differences in neurogenic potential in floor plate cells along an anteroposterior location: midbrain dopaminergic neurons originate from mesencephalic floor plate cells. Development. 2007;134(17):3213–3225. doi: 10.1242/dev.02879. [DOI] [PubMed] [Google Scholar]
- Panhuysen M, Vogt Weisenhorn DM, Blanquet V, Brodski C, Heinzmann U, Beisker W, Wurst W. Effects of Wnt1 signaling on proliferation in the developing mid-/hindbrain region. Mol Cell Neurosci. 2004;26(1):101–111. doi: 10.1016/j.mcn.2004.01.011. [DOI] [PubMed] [Google Scholar]
- Pearson BJ, Doe CQ. Specification of temporal identity in the developing nervous system. Annu Rev Cell Dev Biol. 2004;20:619–647. doi: 10.1146/annurev.cellbio.19.111301.115142. [DOI] [PubMed] [Google Scholar]
- Person AL, Gale SD, Farries MA, Perkel DJ. Organization of the songbird basal ganglia, including area X. J Comp Neurol. 2008;508(5):840–866. doi: 10.1002/cne.21699. [DOI] [PubMed] [Google Scholar]
- Prakash N, Brodski C, Naserke T, Puelles E, Gogoi R, Hall A, Panhuysen M, Echevarria D, Sussel L, Weisenhorn DM, Martinez S, Arenas E, Simeone A, Wurst W. A Wnt1-regulated genetic network controls the identity and fate of midbrain-dopaminergic progenitors in vivo. Development. 2006;133(1):89–98. doi: 10.1242/dev.02181. [DOI] [PubMed] [Google Scholar]
- Prakash N, Wurst W. A Wnt signal regulates stem cell fate and differentiation in vivo. Neurodegener Dis. 2007;4(4):333–338. doi: 10.1159/000101891. [DOI] [PubMed] [Google Scholar]
- Puthussery T, Gayet-Primo J, Taylor WR. Localization of the calcium-binding protein secretagogin in cone bipolar cells of the mammalian retina. J Comp Neurol. 2010;518(4):513–525. doi: 10.1002/cne.22234. [DOI] [PMC free article] [PubMed] [Google Scholar]
- Quina LA, Pak W, Lanier J, Banwait P, Gratwick K, Liu Y, Velasquez T, O'Leary DD, Goulding M, Turner EE. Brn3a-expressing retinal ganglion cells project specifically to thalamocortical and collicular visual pathways. J Neurosci. 2005;25(50):11595–11604. doi: 10.1523/JNEUROSCI.2837-05.2005. [DOI] [PMC free article] [PubMed] [Google Scholar]
- Quina LA, Wang S, Ng L, Turner EE. Brn3a and Nurr1 mediate a gene regulatory pathway for habenula development. J Neurosci. 2009;29(45):14309–14322. doi: 10.1523/JNEUROSCI.2430-09.2009. [DOI] [PMC free article] [PubMed] [Google Scholar]
- Saarimäki-Vire J, Peltopuro P, Lahti L, Naserke T, Blak AA, Vogt Weisenhorn DM, Yu K, Ornitz DM, Wurst W, Partanen J. Fibroblast growth factor receptors cooperate to regulate neural progenitor properties in the developing midbrain and hindbrain. J Neurosci. 2007;27(32):8581–8592. doi: 10.1523/JNEUROSCI.0192-07.2007. [DOI] [PMC free article] [PubMed] [Google Scholar]
- Saenz del Burgo L, Cortes R, Mengod G, Zarate J, Echevarria E, Salles J. Distribution and neurochemical characterization of neurons expressing GIRK channels in the rat brain. J Comp Neurol. 2008;510(6):581–606. doi: 10.1002/cne.21810. [DOI] [PubMed] [Google Scholar]
- Seifinejad A, Tabebordbar M, Baharvand H, Boyer LA, Salekdeh GH. Progress and promise towards safe induced pluripotent stem cells for therapy. Stem Cell Rev. 2010;6(2):297–306. doi: 10.1007/s12015-010-9121-x. [DOI] [PubMed] [Google Scholar]
- Soldner F, Hockemeyer D, Beard C, Gao Q, Bell GW, Cook EG, Hargus G, Blak A, Cooper O, Mitalipova M, Isacson O, Jaenisch R. Parkinson's disease patient-derived induced pluripotent stem cells free of viral reprogramming factors. Cell. 2009;136(5):964–977. doi: 10.1016/j.cell.2009.02.013. [DOI] [PMC free article] [PubMed] [Google Scholar]
- Sulston JE, Horvitz HR. Post-embryonic cell lineages of the nematode, Caenorhabditis elegans. Dev Biol. 1977;56(1):110–156. doi: 10.1016/0012-1606(77)90158-0. [DOI] [PubMed] [Google Scholar]
- Sun Y, Dykes IM, Liang X, Eng SR, Evans SM, Turner EE. A central role for Islet1 in sensory neuron development linking sensory and spinal gene regulatory programs. Nat Neurosci. 2008;11(11):1283–1293. doi: 10.1038/nn.2209. [DOI] [PMC free article] [PubMed] [Google Scholar]
- Tang M, Villaescusa JC, Luo SX, Guitarte C, Lei S, Miyamoto Y, Taketo MM, Arenas E, Huang EJ. Interactions of Wnt/beta-catenin signaling and sonic hedgehog regulate the neurogenesis of ventral midbrain dopamine neurons. J Neurosci. 2010;30(27):9280–9291. doi: 10.1523/JNEUROSCI.0860-10.2010. [DOI] [PMC free article] [PubMed] [Google Scholar]
- Thompson L, Barraud P, Andersson E, Kirik D, Bjorklund A. Identification of dopaminergic neurons of nigral and ventral tegmental area subtypes in grafts of fetal ventral mesencephalon based on cell morphology, protein expression, and efferent projections. J Neurosci. 2005;25(27):6467–6477. doi: 10.1523/JNEUROSCI.1676-05.2005. [DOI] [PMC free article] [PubMed] [Google Scholar]
- Villar-Cervino V, Abalo XM, Villar-Cheda B, Melendez-Ferro M, Perez-Costas E, Holstein GR, Martinelli GP, Rodicio MC, Anadon R. Presence of glutamate, glycine, and gamma-aminobutyric acid in the retina of the larval sea lamprey: comparative immunohistochemical study of classical neurotransmitters in larval and postmetamorphic retinas. J Comp Neurol. 2006;499(5):810–827. doi: 10.1002/cne.21136. [DOI] [PubMed] [Google Scholar]
- Wilkinson DG, Bailes JA, McMahon AP. Expression of the proto-oncogene int-1 is restricted to specific neural cells in the developing mouse embryo. Cell. 1987;50(1):79–88. doi: 10.1016/0092-8674(87)90664-7. [DOI] [PubMed] [Google Scholar]
- Ye W, Shimamura K, Rubenstein JL, Hynes MA, Rosenthal A. FGF and Shh signals control dopaminergic and serotonergic cell fate in the anterior neural plate. Cell. 1998;93(5):755–766. doi: 10.1016/s0092-8674(00)81437-3. [DOI] [PubMed] [Google Scholar]
- Zervas M, Millet S, Ahn S, Joyner AL. Cell behaviors and genetic lineages of the mesencephalon and rhombomere 1. Neuron. 2004;43(3):345–357. doi: 10.1016/j.neuron.2004.07.010. [DOI] [PubMed] [Google Scholar]