Abstract
Increased hepatic venous pressure can be observed in patients with advanced liver disease and congestive heart failure. This elevated portal pressure also leads to variation in acoustic radiation-force derived shear wave based liver stiffness estimates. These changes in stiffness metrics with hepatic interstitial pressure may confound stiffness-based predictions of liver fibrosis stage. The underlying mechanism for this observed stiffening behavior with pressurization is not well understood, and is not explained with commonly-used linear elastic mechanical models. An experiment was designed to determine whether the stiffness increase exhibited with hepatic pressurization results from a strain-dependent hyperelastic behavior. Six excised canine livers were subjected to variations in interstitial pressure through cannulation of the portal vein and closure of the hepatic artery and hepatic vein under constrained conditions (in which the liver was not free to expand) and unconstrained conditions. Radiation force derived shear wave speed estimates were obtained and correlated with pressure. Estimates of hepatic shear stiffness increased with changes in interstitial pressure over a physiologically relevant range of pressures (0–35mmHg) from 1.5 to 3.5 m/s. These increases were observed only under conditions in which the liver was free to expand while pressurized. This behavior is consistent with hyperelastic nonlinear material models that could be used in the future to explore methods for estimating hepatic interstitial pressure noninvasively.
Keywords: ultrasound, ARFI, shear wave, strain stiffening, hyperelastic, tissue nonlinear models, hepatic pressure
1. Introduction
Advanced chronic liver disease (cirrhosis) is the twelfth leading cause of death in the United States with an approximate incidence worldwide of 1 in every 1,000 subjects (Garcia-Tsao 2008). The progression of cirrhosis is marked by two important consequences: liver dysfunction, and portal hypertension (Garcia-Tsao 2008). Liver dysfunction is often characterized using a combination of serum testing and liver biopsy, while portal hypertension is usually measured by hepatic venous pressure gradient (HVPG). Ultrasound provides an opportunity to evaluate two aspects of clinical hepatic disease that are traditionally measured invasively: liver fibrosis and HVPG (Feldman et al. 2010). The first, liver fibrosis, has been extensively studied with relation to comparing biopsy-based fibrosis stage to quantitative estimates of liver stiffness (Palmeri et al. 2011, Friedrich-Rust et al. 2008, Yoneda et al. 2008, Boursier et al. 2008, Castera 2011, Bavu et al. 2011). Specifically, Transient Elastography (Sandrin et al. 2003), Magnetic Resonance Elastography (Huwart et al. 2006), and Acoustic Radiation Force Impulse (ARFI) (Wang et al. 2010, Palmeri et al. 2011, Kim et al. 2010, Rifai et al. 2011, Bavu et al. 2011) based quantitative estimation of tissue stiffness have been successful in distinguishing fibrosis stage noninvasively. Recent studies have suggested that ultrasound-based estimates of liver stiffness also increase with hepatic venous pressurization (Millonig et al. 2010, Vizzutti et al. 2008, Bureau et al. 2007, Robic et al. 2011), but the underlying mechanism for this observed stiffening is not understood.
HVPG measurement in liver disease is important for predicting disease progression, guiding treatment, and longitudinal monitoring (Garcia-Tsao 2008, Bosch et al. 2008). HVPG has been shown to be the most robust predictor of disease progression, or decompensation in patients with cirrhosis (Ripoll et al. 2007). Decompensated cirrhosis is associated with a 30% decrease in 1-year survival for patients with cirrhosis, and is characterized by variceal bleeding, encephalopathy, and jaundice (D’Amico, Garcia-Pagan & Pagliaro 2006). Specifically, increased HVPG above 10 mmHg (from 5 mmHg normal) predicts variceal bleeding, decompensation of cirrhosis, and hepatocellular carcinoma development (D’Amico, Garcia-Pagan, Luca & Bosch 2006, Bruix et al. 1996, Kim & Kamath 2008, Levy et al. 2007). In addition to its prognostic value, lowering HVPG pharmacologically in a cirrhotic patient to below 12 mmHg or 20% decrease from baseline significantly decreases risk of hemorrhage, ascites, encephalopathy, and death (D’Amico, Garcia-Pagan, Luca & Bosch 2006, Vorobioff et al. 1996). Finally, prediction of portal pressure can inform treatment, such as life expectancy prediction for liver transplant guidance (D’Amico, Garcia-Pagan & Pagliaro 2006) and outcome and safety estimates for antiretroviral therapy in patients with hepatitis C virus related cirrhosis (Reiberger et al. 2011). HVPG is useful at all stages of liver disease, for prognostication, longitudinal tracking, or treatment decision-making purposes (Merkel & Montagnese 2011).
Unfortunately, current methods of HVPG measurement involve portal vein catheterization, which is highly invasive, expensive, and can lead to complications such as infection (Merkel & Montagnese 2011, Reynolds et al. 1957). Clearly, a non-invasive metric for HVPG measurement would be highly beneficial to reduce these risks and improve liver disease treatment. The greatest current challenge to measuring HVPG noninvasively using elasticity metrics remains that the stiffening observed with advanced fibrosis cannot currently be distinguished from that which may be due to elevated HVPG (Robic et al. 2011). This study is aimed at exploring differences in the underlying tissue behavior for these two stiffening effects observed in advanced liver disease.
2. Background
Tissue stiffness can be quantified using shear wave imaging methods (Sarvazyan et al. 1998, Gao et al. 1996, Nightingale et al. 2003, Bercoff et al. 2004, Chen et al. 2004). Acoustic radiation force-based methods have yielded consistent and informative liver stiffnesses in clinical subjects with different stages of fibrosis, commonly relying on time-of-flight (TOF) calculation algorithms to identify the arrival time of the wave at various lateral locations (Bavu et al. 2011, Palmeri et al. 2011, Wang et al. 2010). Ultrasonically-tracked displacements through time at each lateral position are used to identify the arrival time for SWS approximation (Palmeri et al. 2008, Sandrin et al. 2002, McLaughlin & Renzi 2006). After determination of SWS, the relationship between the shear wave speed and underlying tissue mechanical properties can be inferred by choosing a specific tissue mechanical model. Often, material linearity, isotropy, incompressibility, and elasticity are assumed (Palmeri et al. 2011, Sandrin et al. 2003, Foucher et al. 2006, Muller et al. 2008). Under these conditions, the shear wave speed (cT) is related to shear modulus(μ) and density (ρ).
| (1) |
Shear wave speeds have been observed to increase with increasing pressure in excised porcine livers (Millonig et al. 2010) and in humans with elevated portal hepatic pressures (Vizzutti et al. 2008, Bureau et al. 2007, Robic et al. 2011). This result is inconsistent with the linear elastic assumptions expressed in equation 1. A change in estimates of liver stiffness with pressure implies a nonlinear relationship between stress and strain of a particular material (Lai et al. 1999, Ogden 1984). Nonlinear materials which display time-independent elastic behavior (such as rubbers, foams, and tissues) are classically described by hyperelastic theories (Bower 2010, Fung 1993, Ogden 1984). Hyperelasticity encompasses many possible nonlinear mechanical models of solids, all of which are described by an assumed strain energy function. The strain energy function can be used to derive strain-dependent stress-strain relationships under different boundary conditions. These models are relevant to the question of hepatic pressurization because there is evidence that increased hepatic pressure leads to a change in the underlying strain state of the liver. Hepatomegaly, an increase in liver size that would imply a change in underlying liver strain state, has also been reported in patients with increased portal pressure due to right-sided congestive heart failure (Kumar et al. 2010, Feldman et al. 2010). The question addressed in this work is whether deformation is necessary to observe increases in measured shear wave speeds with increased hepatic pressure. If the increase in stiffness metrics are associated with hepatic deformation, this result would imply that hyperelastic material models are necessary for describing this behavior.
Extensive theoretical work in nonlinear mechanics has been devoted to analytic predictions of wave speeds under different boundary conditions and material models for soft solids like tissue (Boulanger & Hayes 2001, Destrade & Saccomandi 2004, Destrade & Ogden 2010, Zabolotskaya et al. 2004). Acoustoelastic techniques take advantage of these analytic predictions by characterizing tissue using measured wave speeds in uniaxially compressed hyperelastic materials (Shams et al. 2011, Kobayashi & Vanderby 2006, Vanderby & Kobayashi 2006) and have been previously reported using shear wave speed metrics in tissue-mimicking materials (Catheline et al. 2003, Gennisson et al. 2007). In acoustoelastic testing methods, an underlying hyperelastic expression is assumed, and then the mechanical properties (or parameters of the constitutive model) are determined by measuring wave speed in a compressed material and fitting the experimental results to the material constants of the assumed material model (Kobayashi & Vanderby 2006). Hepatic pressurization does not lend itself to explicit characterization by acoustoelastic techniques because of its geometric complexity and because the appropriate hyperelastic model has not yet been determined. In particular, the hepatic pressurization condition does not correspond to that of uniaxial compression, which is examined using acoustoelastic techniques. The study presented herein was designed to test the hypothesis that liver material nonlinearity manifesting as finite strain deformation with hepatic pressurization leads to increased shear wave speeds.
3. Methods
3.1. Experimental Setup
Experimental Animals
All experiments were performed using freshly harvested canine livers. The canines were obtained through the Duke University Vivarium, and euthanasia was achieved through methods approved by the Duke Institutional Animal Care and Use Committee (IACUC). Three minutes prior to euthanasia, 3 mL of heparin was given to the animal to prevent clotting in the liver during the experiment. After euthanasia the canine liver was removed, with care taken to preserve the inflow and outflow tracts.
Constrained versus Unconstrained Data Acquisition
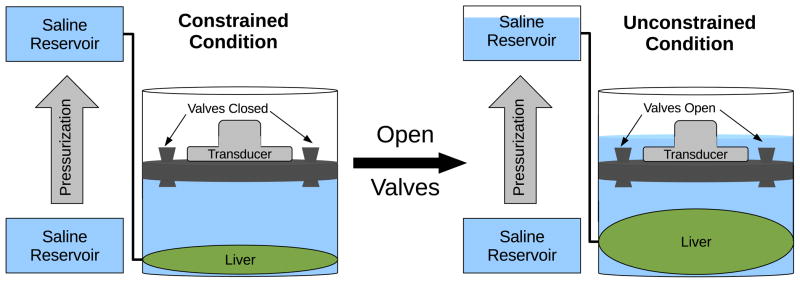
In order to evaluate the effect of strain on pressure-related observations of shear wave speed changes, a custom experimental setup (see figure 1) was constructed to evaluate SWS in the liver under first constrained and then unconstrained conditions. A variable height watertight cylinder was designed with a top transducer window, water release valves and side portal vein access port. The liver was placed within the cylinder, the hepatic artery and vein were closed, and the portal vein was connected to the exterior through an access port for pressurization and connection to a digital manometer (SPER Scientific, Ltd., resolution = 0.075 mmHg). The liver was surrounded with phosphate buffered saline (PBS), with a 4 cm PBS fluid path between the acoustic window and surface of the liver. Air was removed and all valves were closed. Datasets were acquired with pressurization with the valves closed (the constrained condition). Pressure was increased in 5 mmHg steps from 0–45 mmHg by raising the saline reservoir. Then, the reservoir was lowered to achieve 0 mmHg pressure and the valves were opened to allow saline to overflow as the liver expanded with pressurization. The pressurization and data acquisition protocol was repeated in this unconstrained scenario with the valves open. At each pressurization step, 6 SWS datasets were acquired in the same location with the speeds averaged together to provide a single SWS estimate for each pressurization step.
Figure 1.
Diagram of the experimental setup for comparison between excised canine livers that were or were not constrained from deformation throughout pressurization. The increase in hepatic pressure was accomplished by raising the saline reservoir from the level of the portal vein as shown above.
3.2. SWS Estimation Methods
Ultrasonic Parameters
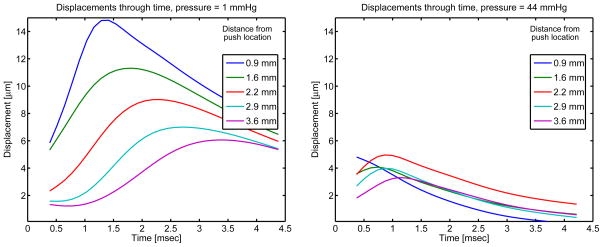
Shear waves were generated with focused acoustic radiation force in the ex-vivo livers using a Siemens ACUSON™S2000 scanner and a 4C-1 curvilinear array (Siemens Medical Systems, Ultrasound Group, Issaquah, WA, USA) focused at between 35 mm to 50 mm operating at 2.6 MHz (F/# 3.5). The system has been modified for user control of acoustic beam sequences and intensities, as well as allowing access to the radio-frequency in-phase and quadrature (IQ) data. Data acquisition was performed using a modified version of the Siemens Virtual Touch™tissue quantification tool, with custom processing as described below. The transmit power was increased from standard settings in all collected datasets and the corresponding acoustic output is shown in table 1. For each shear wave dataset, an 8 mm × 5 mm region of interest (ROI) was interrogated. For each radiation force excitation, or “push,” four parallel lateral positions were tracked for a duration of 10 msec, with pulse repetition frequency (PRF) varying from 7–10 kHz with deeper focii corresponding to a slower PRF. Twenty-eight lateral positions spaced 0.17 mm apart were tracked for each push location, requiring 7 pushes. This sequence was repeated once with a push on the left side of the ROI with tracking to the right and once with the push on the right side of the ROI with tracking to the left. The SWS estimates from each push location were then averaged to obtain one SWS estimate. This protocol was repeated 6 times without moving the ROI and the 6 SWS estimates were averaged to obtain one SWS estimate per pressurization condition from each of 6 excised canine livers. Figure 2 shows examples of individual datasets acquired in two different unconstrained pressurization conditions. Table 1 shows the ultrasound imaging parameters in detail.
Table 1.
Radiation Force Sequence Parameters
| Parameter | Value |
|---|---|
| Ultrasound Scanner | S-2000 |
| Probe | 4C-1 |
| Push Frequency | 2.67 MHz |
| Track Frequency | 3.08 MHz |
| Push Cycles | 400 |
| Push Duration | 180 μs |
| Push F# | 3.5 |
| Push Focal Depth (lateral) | 3.5–5.0 cm |
| Elevation Focus | 4.9 cm |
| Isppa (H20) | 1544 W/cm2 |
| Isppa (α = 0.3) | 626 W/cm2 |
| MI (0.3) | 1.9 |
Figure 2.
Two sample unconstrained experimental datasets. Average axial displacements over 4.4–5.1 cm in depth are shown at various lateral positions. The ARFI push occurs at lateral position = 0 mm and the displacement through time profiles as tracked ultrasonically and calculated by the Loupas estimation algorithm (Loupas et al. 1995) are shown. A 1000 Hz low-pass filter has been applied to the displacements in the time dimension. At increased pressure, the displacement amplitudes are observed to be smaller and the displacement peaks occur earlier in time, both of which correspond to faster shear wave speed propagation and increased material stiffness.
Dataset Processing
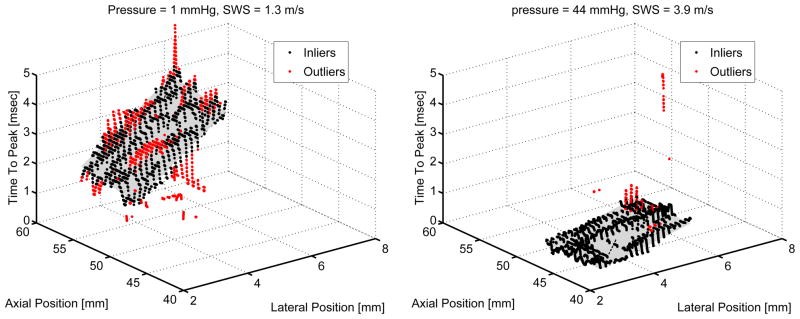
Datasets were processed offline using MATLAB (MathWorks™, Natick, MA). Local displacement estimates were calculated using the Loupas phase-shift estimator (Loupas et al. 1995, Pinton et al. 2006). Displacements from positions 1.4–8 mm lateral to the region of excitation were used to generate shear wave speed estimates using a RANSAC-based time-of-flight algorithm (Wang et al. 2010, Palmeri et al. 2008). The RANSAC-based SWS estimator uses an iterative removal of outliers method, which was exploited to eliminate datasets that had greater than 50% outliers. Then, the shear wave speed is found from the inverse slope of the time to peak displacement versus lateral position. Two example datasets are shown in figure 3 after the iterative removal of outliers procedure. This process was repeated for both the left and right side shear wave excitations for each of the 6 repeated data acquisitions in a given liver at each pressurization level to obtain a single SWS estimate. The mean SWS at each pressure for each of 6 canine livers were compiled and sorted into 11 equally-spaced bins between 2.25 and 45 mmHg to generate mean and standard deviation of SWS for each pressure bin across all six animals.
Figure 3.
The RANSAC-based iterative removal of outliers as implemented for SWS estimation (Wang et al. 2010) is shown for the two datasets examined in figure 2. A steeper time to peak displacement versus lateral position corresponds to a slower shear wave speed as shown for the figure on the left at 1 mmHg hepatic pressure as compared with the figure on the right at 44 mmHg pressure. Both datasets were collected in the unconstrained case for which the liver was allowed to expand with increased pressure.
3.3. Statistical Analysis
The SWS estimates at increasing pressures were compared between unconstrained and constrained pressurization cases. An analysis of variance (ANOVA) as implemented in MATLAB™was performed on the acquired datasets to compare the constrained and unconstrained datasets at each pressure state (DeGroot & Schervish 2002). In addition, a linear regression analysis between the average SWS and pressure in all six experimental animals for the unconstrained and constrained cases was used to identify the dependence of SWS on pressure for the two experimental conditions.
4. Results
4.1. Constrained and Unconstrained Comparison
A sample set of data collected for the constrained/unconstrained conditions in a single experimental liver is shown in figure 4.
Figure 4.
Comparison within one ex-vivo canine liver between a pressurized case limited in volume (constrained, shown with circles) to one allowed to expand (unconstrained, shown with boxes).
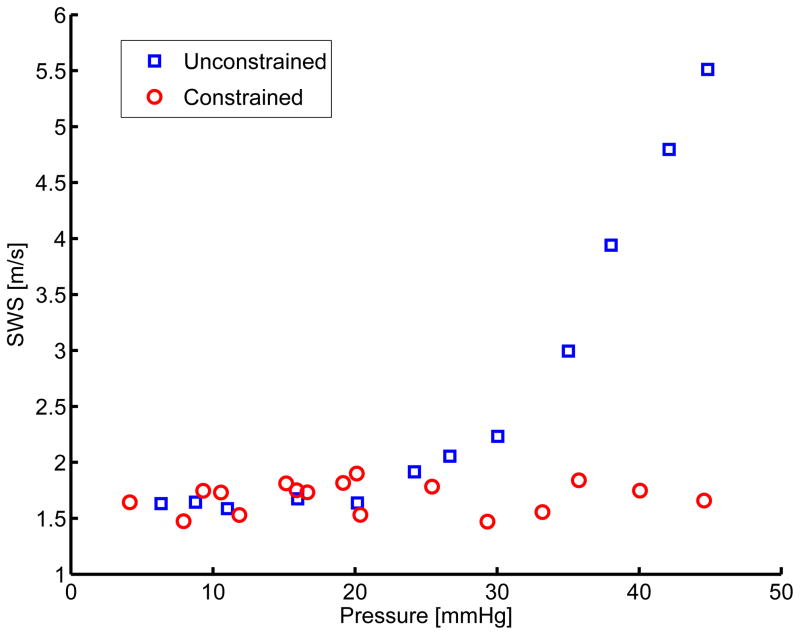
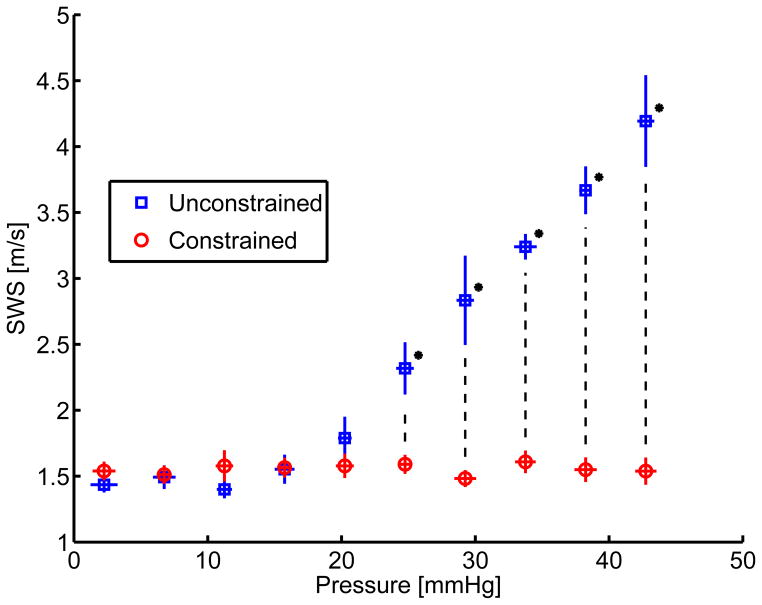
The compiled mean SWS binned into evenly spaced pressure bins across six experiments can be seen in figure 5. When the liver is constrained, shear wave speed does not vary with pressure (figures 4 and 5, red circles). When the liver is unconstrained, the SWS is observed to increase with pressure (figures 4 and 5, blue squares).
Figure 5.
Comparison between pressurization and SWS for constrained (shown with circles) and unconstrained (shown with boxes) cases from independent measures taken in six ex-vivo canine livers. Standard deviation between the experiments in pressure and SWS are shown as horizontal and vertical error bars respectively. The * represent groups for which the p-value was less than 0.01.
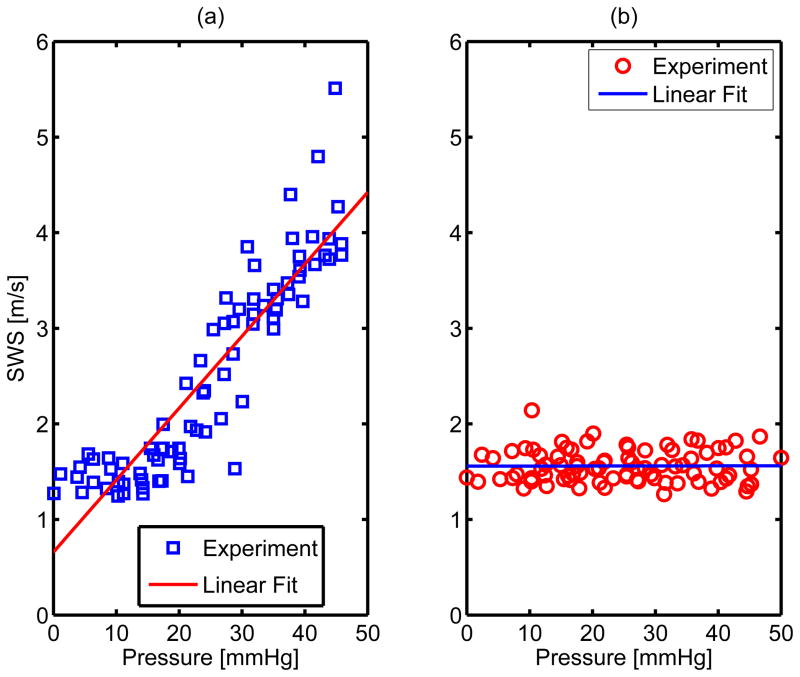
ANOVA were performed between unconstrained and constrained SWS across six animal experiments at each pressure. Statistically significant (p < 0.01) differences between the two groups were observed in the pressure bins with mean pressure greater than 20 mmHg. In order to determine the correlation between pressure and shear wave speed estimates for each experimental condition, a linear regression analysis was performed on the constrained and unconstrained datasets as shown in figure 6 and results from the linear fit are shown in table 2.
Figure 6.
Multiple linear regression results for the unconstrained (subfigure a) and constrained (subfigure b) SWS estimates across all six experimental animals. The p - values for the hypothesis that SWS does not change with pressure are 0 and .96 for the unconstrained and constrained cases respectively. More quantitative results for the linear fit are shown in table 2.
Table 2.
Linear regression comparing SWS and pressure for constrained and unconstrained conditions across six experiments. The non-zero slope, high R2 value, and low p - value of the SWS compared with pressure in the unconstrained case indicate a significant correlation between SWS and pressure when the pressurized liver is free to deform. In the constrained case, the high p - value and low R2 value indicate that there was no correlation between SWS and pressure increase observed when the liver is not free to deform while pressurized.
| Experimental Condition | y-intercept [m/s] | R2 | p - value | ||
|---|---|---|---|---|---|
| Unconstrained | .66 | .08 | .82 | < .01 | |
| Constrained | 1.56 | 0.001 | 2.7E-5 | .96 |
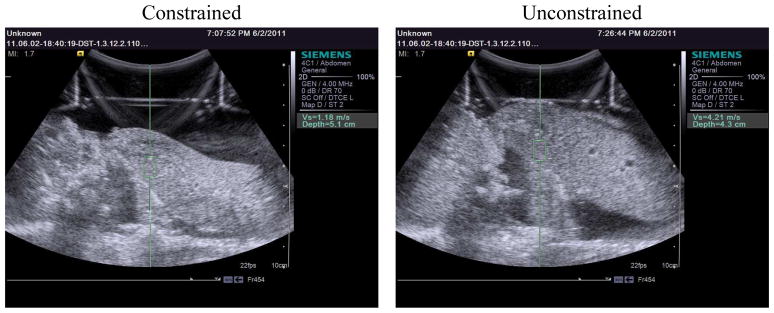
Ex-vivo livers were also visually observed to expand in the unconstrained case but not in the constrained case. These qualitative observations are shown in a comparison between constrained and unconstrained B-mode screenshots at 45 mmHg in figure 7.
Figure 7.
Screen images from the ultrasound scanner comparing constrained and uconstrained canine livers at 45 mmHg. The green boxes shown above represent the region of interest interrogated using shear wave speed metrics for each case. As shown, the depth of the radiation force excitation varied from 3.5 cm to 5.1 cm in depth from the transducer face. Regions of interest were selected for distance from edges of the liver and relative homogeneity based on B-mode examination. Six shear wave speed datasets were acquired for each pressure at one location of radiation force excitation.
5. Discussion
HVPG measurement has an important role in the clinical management of hepatic disease. Quantitative liver stiffness measurements have been shown to increase with HVPG (Millonig et al. 2010, Robic et al. 2011, Vizzutti et al. 2008). The value of the increase in SWS with pressure is comparable to that observed with fibrosis (Wang et al. 2010, Palmeri et al. 2011, Sandrin et al. 2003, Yoneda et al. 2008, Friedrich-Rust et al. 2008, Schlosser et al. 2009, Bavu et al. 2011). Thus, with patients suffering from advanced cirrhosis, it would be difficult to estimate HVPG from SWS estimates alone. The stiffening observed with advanced stages of fibrosis has been suggested to occur due to increased fibrin and collagen deposition in the tissue (Kumar et al. 2010, Yoneda et al. 2008, Friedrich-Rust et al. 2008). The work described herein investigates a different mechanism that may underlie stiffening observed with pressurization in order to provide the basis for methods that could be used to differentiate the two effects.
In the unconstrained livers at pressure = 2 mmHg and constrained livers across all pressures, the average SWS are 1.4±0.1 m/s and 1.6±0.2 m/s respectively. These were not significantly different groups (p = 0.63) and are consistent with the 1–1.7 m/s range reported in surveys of healthy human livers (Cobbold & Taylor-Robinson 2008, Berzuini et al. 2009, Roulot et al. 2008). The similarity between the canine livers described herein and the normal and pressurized results reported in the literature suggest that the strain-dependent mechanisms elucidated can inform clinical applications of elastography-based technologies. At the highest clinically relevant physiologic pressures of 20–30 mmHg, the SWS estimates have increased from 1.4 m/s to 3 m/s in the unconstrained case as shown in figure 5. These results are similar to the ~1.6 m/s at 5 mmHg to ~4 m/s at 30 mmHg reported in patients with Hepatitis C Virus (HCV)-related chronic liver disease (Vizzutti et al. 2008). These results are also comparable to the SWS of 2.5–3.5 m/s reported for fibrosis stage 4 using radiation force-based methods (Wang et al. 2010, Palmeri et al. 2011). Because fibrosis is related to an underlying change in collagen content of the tissue (Cotran et al. 1999) while pressurization does not alter fundamental tissue material properties, the strain-based stiffening behavior of pressurized liver observed in this work may provide an opportunity to distinguish fibrotic stiffening from stiffening occurring secondary to pressurization.
The observed increase in volume with increased portal venous pressure (see figure 7), suggests that the liver is expanded during hepatic pressurization. This increase in liver size suggests a deformation-dependent increase in shear wave speed that is not consistent geometrically with compression-direction-dependent acoustoelasticity theory. While the underlying theoretical basis of both SWS increases with hepatic pressurization and changes in SWS predicted with acoustoelastic uniaxial compression both rely on hyperelastic material properties, the relationship between the applied stress and corresponding SWS will be different and likely depend on many factors including underlying liver geometry. The liver was qualitatively observed to increase in size with pressurization only in the unconstrained case (see figure 7), but it was not possible to evaluate quantitative volume change with this experimental setup. This result supports the hypothesis that increases in liver stiffness with pressurization arise from an increase in underlying strain condition, and can therefore be attributed to tissue nonlinearity. Limitations of this experiment relate to the differences between the experimental setup and in-vivo conditions such as the lack of perfusion or active physiologic response, and the difference in temperature between the infusate (~23 degrees Celsius) and normal physiology (~37 degrees Celsius). The good agreement between experimental results and reports from clinical human literature suggest that these effects are likely to be small. The general increase in SWS errorbar size with increasing SWS noted in figure 5 is an expected result related to limitations in temporal and spatial sampling (Wang et al. 2010).
Table 2 shows the results from a linear regression analysis comparing SWS and increase in pressure for the constrained and unconstrained liver pressurization experiments. There was a high correlation between increasing pressure and SWS when the liver was free to expand (R2 = .81, p < .01, ). In the constrained case, the SWS were not observed to change significantly with pressure (R2< .001, p = .96, ). These results show a statistically significant relationship between SWS and increasing hepatic pressure only when the liver is free to deform and no relationship when the liver is constrained from expansion. The necessity of deformation to observe increase in SWS suggests that the stiffening effect of pressurization on the liver may be similar to strain-stiffening reported in collagen, kidney, prostate, and other biologic tissues (Erkamp, Skovoroda, Emelianov & O’Donnel 2004, Fung 1993, Krouskop et al. 1998). These similarities may amplify understanding of liver pressurization and provide the basis for using nonlinear strain-stiffening models to quantitate liver pressure in vivo.
Hyperelastic behaviors have been previously reported in tissues (Erkamp, Emelianov, Skovoroda & O’Donnel 2004, Krouskop et al. 1998, Fung 1993, Varghese et al. 2000). Additionally, nonlinear parameter fitting from compression or indentation testing has been studied in liver tissue (Bummo & Kim 2010, Chui et al. 1997, Jordan et al. 2009, Gao et al. 2010), but in-situ testing of nonlinear mechanical properties has not been previously reported. The experiments reported herein provide the basis for exploring nonlinear hyperelastic behavior of the liver in-situ or in-vivo using radiation force-based methods. The deformation observed with hepatic pressurization may be useful for both elucidating the appropriate mechanical models for liver and modeling the deformation observed with hepatic pressurization. Determining the deformation state of the liver noninvasively using stiffness metrics may provide a noninvasive hepatic pressure measurement tool in the future.
6. Conclusions
This work demonstrates that hepatic stiffening with increased pressure requires an underlying tissue deformation indicating that a hyperelastic nonlinear model would be reasonable to adopt for studying shear wave speed increases with hepatic pressurization. Because the mechanism of stiffening from fibrosis stage and pressurization are different, this may provide the basis for distinguishing the two stiffening behaviors, resolving differences between different studies, and for longitudinal tracking of HVPG for prognostic and treatment purposes.
Acknowledgments
This work was supported by NIH grants R01 CA-142824, R01 EB-002132, and MSTP training grant T32 GM007171. Special thanks to Siemens Medical Solutions USA, Inc., Ultrasound Division for their technical assistance. Thanks also to Pamela Anderson, Samantha Lipman, Ellen Dixon-Tulloch, Dr. Paul Yoo, and Dr. Patrick Wolf for their assistance with canine liver extraction.
References
- Bavu E, Gennisson J, Couade M, Bercoff J, Mallet V, Fink M, Badel A, Vallet-Pichard A, Nalpas B, Tanter M, Pol S. Ultrasound Med Biol. 2011;37:9. doi: 10.1016/j.ultrasmedbio.2011.05.016. [DOI] [PubMed] [Google Scholar]
- Bercoff J, Tanter M, Fink M. IEEE Trans Ultras Ferroelec Freq Control. 2004;51(4):396–409. doi: 10.1109/tuffc.2004.1295425. [DOI] [PubMed] [Google Scholar]
- Berzuini A, Colli A, Gerosa A, Raffaele L, Guarnori I, Foglieni B, Spreafico M, Duca P, Bonino F, Pratti D. Digestive and Liver Disease. 2009;41(A1–A45):A12–A13. [Google Scholar]
- Bosch J, Berzigotti A, Garcia-Pagan J, Abraldes J. Journal of Hepatology. 2008;48(S1):S68–S92. doi: 10.1016/j.jhep.2008.01.021. [DOI] [PubMed] [Google Scholar]
- Boulanger P, Hayes M. In: Topics in Finite Elasticity. Hayes M, Saccomandi G, editors. SpringerWien; New York: 2001. [Google Scholar]
- Boursier J, Konate A, Gorea G, Reaud S, Quemener E, Oberti F, Hubert-Fouchard I, Calès Clinical Gastroenterology and Hepatology. 2008;6(11):1263–1269. doi: 10.1016/j.cgh.2008.07.006. [DOI] [PubMed] [Google Scholar]
- Bower A. Applied Mechanics of Solids. CRC Press; Boca Raton, FL: 2010. [Google Scholar]
- Bruix J, Castells A, Bosch J, Feu F, Fuster J, Garcia-Pagan J, Visa J, Bru C, Rodes J. Gastroenterology. 1996;111(4):1018–1022. doi: 10.1016/s0016-5085(96)70070-7. [DOI] [PubMed] [Google Scholar]
- Bummo A, Kim J. Medical Image Analysis. 2010;14:138–148. doi: 10.1016/j.media.2009.10.006. [DOI] [PubMed] [Google Scholar]
- Bureau C, Métivier S, Peron J, Robic M, Roquet O, Dupuis E. Journal of Hepatology. 2007;46(S1):S34–S35. [Google Scholar]
- Castera L. Best Practice & Research Clinical Gastroenterology. 2011;25(2):291–303. doi: 10.1016/j.bpg.2011.02.003. [DOI] [PubMed] [Google Scholar]
- Catheline S, Gennisson JL, Fink M. Journal of the Acoustical Society of America. 2003;114(6):3087–3091. doi: 10.1121/1.1610457. [DOI] [PubMed] [Google Scholar]
- Chen S, Fatemi M, Greenleaf J. Journal of the Acoustical Society of America. 2004;115(6):2781–2785. doi: 10.1121/1.1739480. [DOI] [PubMed] [Google Scholar]
- Chui C, Kobayashi E, Chen X, Hisada T, Sakuma I. IEEE Trans Ultras Ferroelec Freq Control. 1997;44(1):125–139. [Google Scholar]
- Cobbold J, Taylor-Robinson S. Journal of Hepatology. 2008;48:529–531. doi: 10.1016/j.jhep.2008.01.005. [DOI] [PubMed] [Google Scholar]
- Cotran R, Kumar V, Collins T. Robbins Pathologic Basis of Disease. W.B. Saunders Company The Curtis Center; Independence square west, Philadelphia, Pennsylvania 19106: 1999. [Google Scholar]
- D’Amico G, Garcia-Pagan J, Luca A, Bosch J. Gastroenterology. 2006;131(5):1611–1624. doi: 10.1053/j.gastro.2006.09.013. [DOI] [PubMed] [Google Scholar]
- D’Amico G, Garcia-Pagan J, Pagliaro L. Journal of Hepatology. 2006;44(1):217–231. doi: 10.1016/j.jhep.2005.10.013. [DOI] [PubMed] [Google Scholar]
- DeGroot M, Schervish M. Probability and Statistics. 3. Addison-Wesley; New Jersey: 2002. [Google Scholar]
- Destrade M, Ogden R. Journal of the Acoustical Society of America. 2010;128(6):3334–3344. doi: 10.1121/1.3505102. [DOI] [PubMed] [Google Scholar]
- Destrade M, Saccomandi G. Wave Motion. 2004;40:251–262. [Google Scholar]
- Erkamp R, Emelianov S, Skovoroda A, O’Donnel M. IEEE Transactions on Ultrasonics, Ferroelectrics, and Frequency Control. 2004;51(5):532–539. [PubMed] [Google Scholar]
- Erkamp R, Skovoroda A, Emelianov S, O’Donnel M. IEEE Transactions on Ultrasonics, Ferroelectrics, and Frequency Control. 2004;51(4):410–418. doi: 10.1109/tuffc.2004.1295426. [DOI] [PubMed] [Google Scholar]
- Feldman M, Friedman L, Brandt L. Feldman: Sleisenger and Fordtran’s Gastrointestinal Liver Disease. 9. Saunders, An Imprint of Elsevier; St. Louis, MO 63136: 2010. [Google Scholar]
- Foucher J, Chanteloup E, Vergniol J, Castera L, LeBail B, Adhoute X, Bertet J, Couzigou P, deLedinghen V. Gut. 2006;55(1):403–408. doi: 10.1136/gut.2005.069153. [DOI] [PMC free article] [PubMed] [Google Scholar]
- Friedrich-Rust M, Ong M, Martens S, Sarrazin C, Bojunga J, Zeuzem S, Herrmann E. Gastroenterology. 2008;134(3) doi: 10.1053/j.gastro.2008.01.034. [DOI] [PubMed] [Google Scholar]
- Fung Y. Biomechanics: Mechanical Properties of Living Tissues. Springer; New York: 1993. [Google Scholar]
- Gao L, Parker K, Lerner R, Levinson S. Ultrasound in Medicine and Biology. 1996;22(8):959–977. doi: 10.1016/s0301-5629(96)00120-2. [DOI] [PubMed] [Google Scholar]
- Gao Z, Lister K, Desai J. Annals of Biomedical Engineering. 2010;38(2):505–516. doi: 10.1007/s10439-009-9812-0. [DOI] [PMC free article] [PubMed] [Google Scholar]
- Garcia-Tsao G. In: Cecil Medicine. 23. Goldman L, Ausiello D, editors. Saunders Elsevier; Philadelphia, PA: 2008. [Google Scholar]
- Gennisson JL, Rénier M, Catheline S, Barrière C, Bercoff J, Tanter M, Fink M. Journal of the Acoustical Society of America. 2007;122(6):3211–3219. doi: 10.1121/1.2793605. [DOI] [PubMed] [Google Scholar]
- Huwart L, Peeters F, Sinkus R, Annet L, Salameh N, ter Beek L, Horsmans Y, Van Beers B. NMR in Biomedicine. 2006;19:173–179. doi: 10.1002/nbm.1030. [DOI] [PubMed] [Google Scholar]
- Jordan P, Socrate S, Zickler T, Howe R. Journal of the Mechanical Behavior of Biomedical Materials. 2009;2:192–201. doi: 10.1016/j.jmbbm.2008.08.006. [DOI] [PMC free article] [PubMed] [Google Scholar]
- Kim J, Lee J, Kim Y, Yoon J, Kim S, Lee J, Han J, Choi B. Ultrasound in Medicine and Biology. 2010;36(10):1637–1643. doi: 10.1016/j.ultrasmedbio.2010.07.016. [DOI] [PubMed] [Google Scholar]
- Kim W, Kamath P. Gastroenterology. 2008;134(2):641–641. doi: 10.1053/j.gastro.2007.12.003. [DOI] [PubMed] [Google Scholar]
- Kobayashi H, Vanderby R. Journal of the Acoustical Society of America. 2006;121(2):879–887. doi: 10.1121/1.2427112. [DOI] [PubMed] [Google Scholar]
- Krouskop T, Wheeler T, Kallel F, Garra B, Hall T. Ultrasonic Imaging. 1998;20:260–274. doi: 10.1177/016173469802000403. [DOI] [PubMed] [Google Scholar]
- Kumar V, Abbas A, Fausto N, Aster J. Kumar: Robbins and Cotran Pathologic Basis of Disease, Professional Edition. 8. Saunders, an imprint of Elsevier Inc; Philadelphia, PA 19103: 2010. [Google Scholar]
- Lai W, Rubin DEK. Introduction to Continuum Mechanics. Butterworth-Heinmann; Woburn, MA: 1999. [Google Scholar]
- Levy C, Zein C, Gomez J, Soldevilla-Pico C, Firpi R, Morelli G, Nelson D. Clinical Gastroenterology and Hepatology. 2007;5(7):803–808. doi: 10.1016/j.cgh.2007.02.031. [DOI] [PubMed] [Google Scholar]
- Loupas T, Peterson R, Gill R. IEEE Trans Ultras Ferroelec Freq Control. 1995;42:689–699. [Google Scholar]
- McLaughlin J, Renzi D. Inverse Problems. 2006;22:681–706. [Google Scholar]
- Merkel C, Montagnese S. Digestive and Liver Disease. 2011. In Press. [DOI] [PubMed] [Google Scholar]
- Millonig G, Friedrich S, Adolf S, Fonouni H, Golriz M, Mehrabi A, Stiefel P, Poschl G, Buchler M, Seitz H, Mueller S. Journal of Hepatology. 2010;52:206–210. doi: 10.1016/j.jhep.2009.11.018. [DOI] [PubMed] [Google Scholar]
- Muller M, Gennisson JL, Deffieux T, Tanter M, Fink M. Ultrasound in Medicine and Biology. 2008;35(2):219–229. doi: 10.1016/j.ultrasmedbio.2008.08.018. [DOI] [PubMed] [Google Scholar]
- Nightingale K, McAleavey S, Trahey G. Ultrasound in Medicine and Biology. 2003;29(12):1715–1723. doi: 10.1016/j.ultrasmedbio.2003.08.008. [DOI] [PubMed] [Google Scholar]
- Ogden R. Non-Linear Elastic Deformations. Dover Mineola; New York: 1984. [Google Scholar]
- Palmeri M, Wang M, Dahl J, Frinkley K, Nightingale K. Ultrasound in Medicine and Biology. 2008;34(4):546–558. doi: 10.1016/j.ultrasmedbio.2007.10.009. [DOI] [PMC free article] [PubMed] [Google Scholar]
- Palmeri M, Wang M, Rouze N, Abdelmalek M, Guy C, Moser B, Diehl A, KRN Journal of Hepatology. 2011;55 (3):666–72. doi: 10.1016/j.jhep.2010.12.019. [DOI] [PMC free article] [PubMed] [Google Scholar]
- Pinton G, Dahl J, Trahey G. IEEE Trans Ultrason Ferroelec Freq Control. 2006;53(6):1103–1117. doi: 10.1109/tuffc.2006.1642509. [DOI] [PubMed] [Google Scholar]
- Reiberger T, Rutter K, Ferlitsch A, Payer B, Hofer H, Beinhardt S, Kundi M, Ferenci P, Gangl A, Trauner M, Peck-Radosavljevic M. Clinical Gastroenterology and Hepatology. 2011. In Press. [DOI] [PubMed] [Google Scholar]
- Reynolds T, Redeker A, Geller H. The American Journal of Medicine. 1957:341–350. doi: 10.1016/0002-9343(57)90090-6. [DOI] [PubMed] [Google Scholar]
- Rifai K, Cornberg J, Mederacke I, Bahr M, Wedemeyer H, Malinski P, Bantel H, Boozari B, Potthoff A, Manns M, Gebel M. Digestive and Liver disease. 2011. [DOI] [PubMed] [Google Scholar]
- Ripoll C, Groszmann R, Garcia-Tsao G, Grace N, Burroughs A, Planas R, Escorsell A, Garcia-Pagan J, Makuch R, Patch D, Matloff D, Bosch J. Gastroenterology. 2007;133:481–488. doi: 10.1053/j.gastro.2007.05.024. [DOI] [PubMed] [Google Scholar]
- Robic M, Procopet B, Métivier S, Péron J, Selves J, Vinel J, Bureau C. Journal of Hepatology. 2011 doi: 10.1016/j.jhep.2011.01.051. Article in Press. [DOI] [PubMed] [Google Scholar]
- Roulot D, Czernichow S, Clésiau H, Costes J, Vergnaud A, Beaugrand M. Journal of Hepatology. 2008;48:606–613. doi: 10.1016/j.jhep.2007.11.020. [DOI] [PubMed] [Google Scholar]
- Sandrin L, Fourquet B, Hasquenoph J, Yon S, Fournier C, Mal F, Christidis C, Ziol M, Poulet B, Kazemi F, Beaugrand M, Palau R. Ultrasound in Medicine and Biology. 2003;29(12):1705–1713. doi: 10.1016/j.ultrasmedbio.2003.07.001. [DOI] [PubMed] [Google Scholar]
- Sandrin L, Tanter M, Catheline S, Fink M. IEEE Trans Ultras Ferroelec Freq Control. 2002;49(4):426–435. doi: 10.1109/58.996560. [DOI] [PubMed] [Google Scholar]
- Sarvazyan A, Rudenko O, Swanson S, Fowlkes J, Emelianov S. Ultrasound Med Biol. 1998;24(9):1419–1435. doi: 10.1016/s0301-5629(98)00110-0. [DOI] [PubMed] [Google Scholar]
- Schlosser B, Biermer M, Fulop B, Schott E, Asbach P, Sack I, Berg T. 2009;50(4):919. [Google Scholar]
- Shams M, Destrade M, Ogden R. Wave Motion. 2011;48:552–567. [Google Scholar]
- Vanderby R, Kobayashi H. Journal of Biomechanics. 2006;39:S64–65. [Google Scholar]
- Varghese T, Ophir J, Krouskop A. Ultrasound in Medicine and Biology. 2000;26(5):839–851. doi: 10.1016/s0301-5629(00)00199-x. [DOI] [PubMed] [Google Scholar]
- Vizzutti F, Arena U, Rega L, Pinzani M. Gastroentérol Clin Bio. 2008;32:80–87. doi: 10.1016/S0399-8320(08)73997-6. [DOI] [PubMed] [Google Scholar]
- Vorobioff J, Groszmann R, Picabea E, Gamen M, Villavicencio R, Bordato J, Morel I, Audano M, Tanno H, Lerner E, Passamonti M. Gastroenterology. 1996;111:701–709. doi: 10.1053/gast.1996.v111.pm8780575. [DOI] [PubMed] [Google Scholar]
- Wang M, Palmeri M, Rotemberg V, Rouze N, Nightingale K. Ultrasound in Medicine and Biology. 2010;36(5):802–813. doi: 10.1016/j.ultrasmedbio.2010.02.007. [DOI] [PMC free article] [PubMed] [Google Scholar]
- Yoneda M, Yoneda M, Mawatari H, Fujita K, Endo H, Lida H, Nozaki Y, Yonemitsu K, Higurashi T, Takahashi H, Kobayashi N, Kirikoshi H, Abe Y, Inamori M, Kubota K, Saito S, Tamano M, HIraishi H, Maeyama S, Yamaguchi N, Togo S, Nakajima A. Digestive and Liver Disease. 2008;40(5):371–378. doi: 10.1016/j.dld.2007.10.019. [DOI] [PubMed] [Google Scholar]
- Zabolotskaya E, Hamilton M, Ilinskii Y, Meegan G. Journal of the Acoustical Society of America. 2004;116(5):2807–2813. [Google Scholar]


