Abstract
Background and Aims
Coordination of sugar transport and metabolism between developing seeds and their enclosing fruit tissues is little understood. In this study the physiological mechanism is examined using two genotypes of asparagus bean (Vigna unguiculata ssp. sesquipedialis) differing in pod wall and seed growth rates. Pod growth dominates over seed growth in genotype ‘Zhijiang 121’ but not in ‘Zhijiang 282’ in which a ‘bulging pod’ phenotype is apparent from 8 d post-anthesis (dpa) onward.
Methods
Seed and pod wall growth rates and degree of pod-bulging were measured in the two genotypes together with assays of activities of sucrose-degrading enzymes and sugar content in pod wall and seed and evaluation of cellular pathways of phloem unloading in seed coat using a symplasmic fluorescent dye, 5(6)-carboxyfluorescein (CF).
Key Results
Activities of cell wall, cytoplasmic and vacuolar invertases (CWIN, CIN and VIN) were significantly smaller in pod walls of ‘282’ than in ‘121’ at 10 dpa onwards. Low INV activities were associated with weak pod wall growth of ‘282’. In seed coats, CF was confined within the vasculature in ‘282’ but moved beyond the vasculature in ‘121’, indicating apoplasmic and symplasmic phloem unloading, respectively. Higher CWIN activity in ‘282’ seed coats at 6–8 dpa correlated with high hexose concentration in embryos and enhanced early seed growth. However, CWIN activity in ‘282’ decreased significantly compared with ‘121’ from 10 dpa onwards, coinciding with earlier commencement of nuclei endoreduplication in their embryos.
Conclusions
The study shows genotypic differences between ‘bulging pod’ and ‘non-bulging’ phenotypes of asparagus bean in sucrose metabolism in relation to the pathway of phloem unloading in developing seed coats, and to pod and seed growth. Low INV activity in pod wall corresponds to its shortened and weak growth period; by contrast, the apoplasmic path in the seed coat is associated with high CWIN activity and strong early seed growth.
Keywords: Asparagus bean, Vigna unguiculata ssp. sesquipedialis, fruit, invertase, phloem unloading, seed, sucrose metabolism
INTRODUCTION
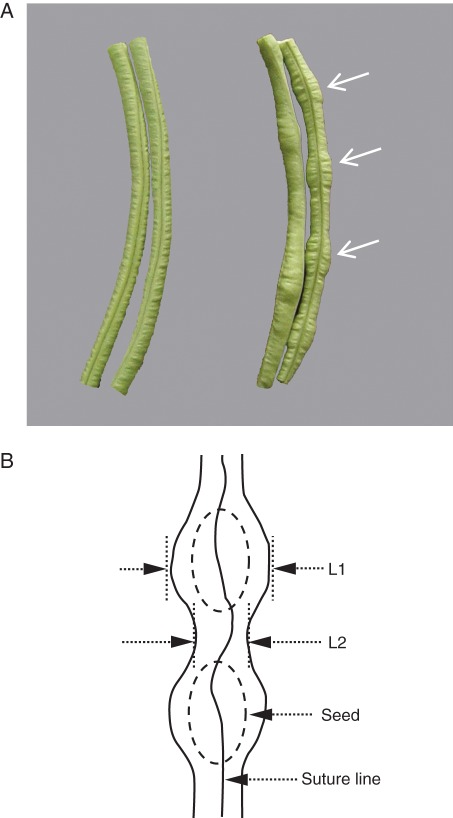
Asparagus bean (Vigna unguiculata ssp. sesquipedialis) is a type of cowpea and a major legume crop. The tender pods are harvested when immature and may become 50–100 cm in length at maturity. The desirable quality trait of asparagus bean is an evenly formed, thick and hydrated pod wall containing small seeds. A major problem in the asparagus bean industry is a large-seeded phenotype resulting in bulging pods which are agronomically undesirable (Fig. 1), with the phenotype becoming more pronounced under abiotic stress such as drought and heat. The underlying physiology responsible for this phenotype is not known.
Fig. 1.
Genotypic differences between pods of asparagus bean. (A) Line ‘282’, with bulging seed pockets indicated by arrows (right) in comparison with the fleshy, non-bulging pod of line ‘121’ (left). Both pods were harvested at 10 dpa. (B) A schematic diagram of bulging seed pocket genotype. L1, pod diameter in the region where seeds are located; L2, pod diameter in the region between seeds.
Development of heterotrophic sink tissues, such as fruit and seed, depends upon phloem-imported photoassimilates (Weber et al., 2005; Ruan et al., 2010). In most herbaceous eudicots, including cowpea (Peoples et al., 1985), sucrose is the predominant form in which photoassimilates are transported in the phloem from photosynthetic leaves (sources) to seeds (sinks) with pod photosynthesis contributing less than 3 % of the imported photoassimilates. Similar findings are reported in chickpea (Ma et al., 2001). After unloading from the phloem into sinks, sucrose must be degraded into hexoses or their derivates to become metabolically available (Weber et al., 2005). Degradation of sucrose is catalysed by invertase (INV, EC 3·2·1·26), which hydrolyses sucrose to glucose and fructose, or by sucrose synthase (Sus, EC 2·4·1·13), which cleaves sucrose in the presence of UDP to UDP-glucose and fructose (Wang et al., 2010). INVs may be located in the cell wall, cytoplasm or vacuole (CWIN, CIN and VIN, respectively). Sucrose synthase functions in the cytoplasm or in association with plasma membranes (see Ruan et al., 2010) providing C skeletons for cell expansion (Ruan et al., 2005; Xu et al., 2012) and biosynthesis of starch and cellulose (Chourey et al., 1998; Pugh et al., 2010). INV, particularly CWIN, plays diverse roles in plant development and in response to stresses through regulating carbon partitioning and sugar signalling (Roitsch and González, 2004; Weber et al., 2005; Ruan et al., 2010; Li et al., 2012).
Previous studies on sucrose metabolism in legume crops (soybean, faba bean, pea) have focused mainly on seed development, especially on seed size and dry matter accumulation (Gifford and Thorne, 1985; Heim et al., 1993; Neubohn et al., 2000; Déjardin et al., 2008). Studies on Vicia faba (Weber et al., 1996) and Vicia narbonensis (Weber et al., 1998) have shown that seed development is controlled by carbohydrate status, with hexose signals inducing cell division in embryos and sucrose activating cell expansion and storage functions (Weber et al., 2005). The hexose to sucrose ratio is controlled by CWIN activity in seed coats (Weber et al., 1996). However, it is unclear how import and metabolism of sucrose are coordinated to control seed and pod development.
We tested whether INV and Sus activities are linked to cellular pathways of phloem unloading and how this linkage may contribute to coordinating pod and seed development using two genotypes of asparagus bean exhibiting different rates and extents of seed and pod wall development. The analyses revealed that the bulging pod phenotype is linked to: (1) high CWIN activities in seed coat, which may underpin accelerated early seed growth, and low INV activity in pod walls, which may contribute to an earlier termination of their growth; and (2) an apoplasmic route in seed coats with the non-bulging line exhibiting the opposite symplasmic pathway. Overall, the data represent a set of novel observations on the genotypic differences in INV activities in seed and fruit that are matched by corresponding changes in their growth rates and cellular pathway of phloem unloading in seed coat. The findings provide a physiological explanation for the bulging pod phenotype.
MATERIALS AND METHODS
Plant material and growing conditions
Two genotypes of asparagus bean (Vigna unguiculata ssp. sesquipedialis L. Verdc.) that display a large difference in the bulging pod phenotype were used: ‘Zhijiang 282’ has bulging-pods in contrast to ‘Zhijiang ‘121’, which does not. Plants were grown under field conditions in Hangzhou, China, in April and May 2009. To determine the development stage of pods, inflorescences in the mid-region of each plant (4th–9th node) were tagged. To ensure an adequate supply of nutrients to developing pods only the tagged basal two flowers of each inflorescence were kept for study, while the remaining flowers were removed. Pods were harvested at 6, 8, 10, 12, 14, 16, 18 and 23 d post-anthesis (dpa), unless otherwise specified, separated, on ice, into seed coats, embryos and pod walls, and stored at –20 °C for enzyme and sugar assays.
Measurement of pod bulging
The level of pod bulging was measured on fresh pods of both lines at 8, 10 and 12 dpa using the following relationship:
Degree of pod bulging 
where L1 is pod diameter in regions where seeds are located and L2 is pod diameter in regions between seeds (see Fig. 1).
Loading of CF and fluorescent microscopy
As described by Ruan et al. (2001), the membrane-permeable, non-fluorescent dye 5(6)-carboxyfluorescein diacetate (CFDA; Sigma, St Louis, MO, USA) was prepared as a 2·0 % (w/v) stock solution in acetone and stored at –20 °C. After excision, pod-bearing pedicels were immediately re-cut under water with or without 100 µg mL−1 CFDA and illuminated at a photon flux density of 150 µmol m−2 s−1 at 30–33 °C for 48 h. Upon entering cells, CFDA is cleaved by cytoplasmic esterases to produce the membrane-impermeant symplasmic fluorescent probe CF.
After loading, CF distribution in seed coats was imaged using a Nikon Eclipse TE2000-S fluorescence microscope. Prior to imaging, pods were cut into transverse sections (approx. 0·5 mm thick through the hilum connecting the seed). Sections were immersed immediately in 80 % (v/v) aqueous glycerol on glass slides. The CF tracing experiment was repeated three times with similar results. At each time point, two pods derived from two plants were used.
Histological procedures
Pod walls were fixed in FAA (38 % formalin 5 mL : glacial acetic acid 5 mL : 70 % alcohol 90 mL) for 24 h. After three 15-min washes with 100 mm phosphate buffer (pH 7·0), tissues were dehydrated in a graded ethanol series, and then embedded in Spurr's low-viscosity resin. Sections (200 nm) were cut and stained with methylene blue for 45–60 s at 40 °C and imaged using a Nikon Eclipse TE2000-S microscope.
Measurement of enzyme activities and carbohydrate content
INV and Sus activities were assayed according to Tomlinson et al. (2004). For measurement of sugars, approx. 0·2–0·5 g of tissue was ground to powder in liquid nitrogen and extracted with 1 mL of preheated 80 % ethanol for 5 min at 80 °C. After cooling, extracts were centrifuged at 12 000g for 10 min. Supernatants were collected and pellets re-suspended in 0·5 mL of 50 % ethanol and re-spun as described above. The resulting pellets were re-extracted with 0·5 mL of water and re-centrifuged. The collected supernatants were combined (total 2 mL) and mixed with equal volumes of chloroform and shaken vigorously. The aqueous phase was collected. Sucrose, glucose and fructose contents were measured enzymatically as described previously (Lunn and Hatch, 1995). The final pellet was used to measure starch as glucose equivalents after degradation with amyloglucosidase and α-amylase (Tomlinson et al., 2004).
Measurement of DNA endoreduplication and embryo cell number
Flow cytometric analysis was conducted as described by Bino et al. (1993) and Lemontey et al. (2000). Briefly, to release nuclei, embryos were diced with a razor blade in 2 mL of nuclei isolation buffer. The suspension was filtered through a 40-μm nylon mesh, and DAPI (4′,6-diamidino-2-phenylindole) was added to a final concentration of 1 µg mL−1. The suspension was incubated in the buffer for at least 1 min. DNA endoreduplication in the filtrate was measured immediately using flow cytometry (Partec, Nuremberg, Germany). Calibration was done using nuclei of expanded leaves of asparagus bean. For each replicate, at least 4000 nuclei from a mix of five embryos were analyzed. The Feulgen-staining method was employed to measure cell number in embryos as described by Weber et al. (1996).
Statistics
Statistical analysis was performed using the software SAS (version 8·1; SAS Institute Inc., Cary, NC, USA); the number of replicates is indicated in the figure captions.
RESULTS
Development of the bulging pod phenotype
The bulging pod phenotype appeared at about 8 dpa onwards (Fig. 1). To determine how this phenotype relates to pod wall and seed development, the degree of pod bulging and seed to pod biomass ratios were measured, focusing on the commercial harvesting period from 8 to 12 dpa. These parameters were significantly greater in line ‘282’ than in ‘121’ (Supplementary Data Fig. S1). The degree of pod bulging correlated positively with total seed to pod wall fresh weight ratio (R2 = 0·775, P < 0·01, Fig. S1). Some seeds were shrunken in the pod of non-bulging line ‘121’, mainly at the end of the pod distal to the pedicel (data not shown), contributing to its lower seed to pod ratio as compared with the bulging line ‘282’ (Fig. S1). These observations indicate that the bulging phenotype resulted from enhanced seed or depressed pod wall growth or a combination of both.
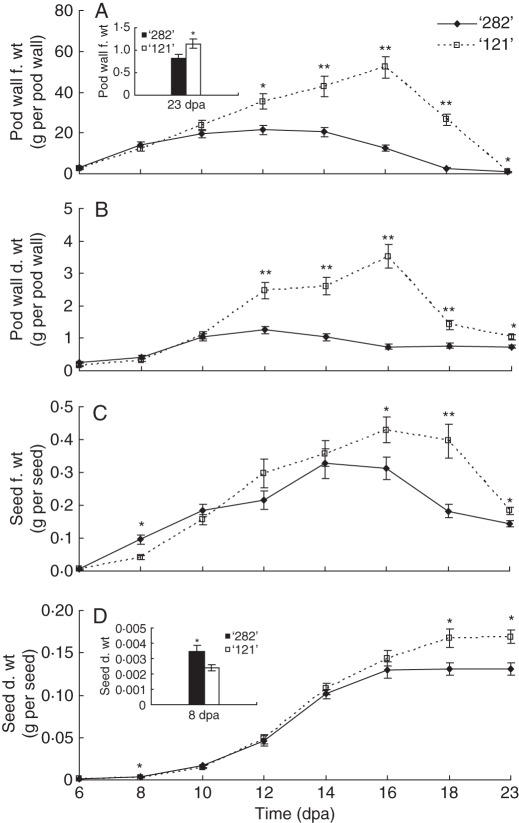
Pod walls of the bulging line ‘282’ and non-bulging line ‘121’ reached their maximal fresh and dry weights at 12 and 16 dpa, respectively (Fig. 2A, B), indicating a shorter growth period for ‘282’. Fresh and dry weights of pod walls of the two genotypes diverged significantly after 10 dpa, when pod walls of ‘282’ ceased growth but continued in ‘121’ (Fig. 2A, B).
Fig. 2.
Growth kinetics of pod wall (A, B) and seed (C, D) of bulging seed pocket line ‘282’ and fleshy-pod line'121' on a fresh (A, C) or dry (B, D) weight basis. Each value represents mean ± s.e. of three biological replicates. For pod wall weights, each replicate includes four pod walls harvested from two plants. For seed weights, each replicate includes 50 normal seeds (shrunken seeds excluded) from eight pods harvested from four plants. Asterisks indicate significant differences (Student's t-test, *P < 0·05; **P < 0·01) between the two genotypes at each time point.
Normal seeds of lines ‘282’ and ‘121’ reached their maximal average fresh weights at 14 and 16 dpa, respectively, and maximal dry weights at 16 and 18 dpa, respectively (Fig. 2C, D). This shows that seeds of bulging line ‘282’ had a shorter growth period than line ‘121’. Of note is the larger seed fresh and dry weights of line ‘282’ than those of line ‘121’ at 8 dpa (Fig. 2C, D inset), pointing to accelerated growth of the former. However, fresh and dry seeds weights of line ‘121’ gradually exceeded that of line ‘282’ from 16 dpa onwards (Fig. 2C, D).
During early growth at 8 dpa there was no difference in pod wall weights between the two genotypes (Fig. 2A, B). However, the degree of pod bulging and total seed to pod wall ratio of line ‘282’ were significantly greater than those of ‘121’ (Fig. S1). This results from the larger average seed fresh and dry weights (Fig. 2C, D) and that all seeds developed normally in the bulging line ‘282’, whereas some seeds became shrunken in the non-bulging line ‘121’. In contrast, at 12 dpa, this relationship reversed. There was no difference between seed dry or fresh weights. However, fresh and dry weights of line ‘282’ pod walls were lower than those of line ‘121’ (Fig. 2A, B). This accounts for the higher seed to pod ratio and bulging pods of line ‘282’ (Fig. S1). Therefore, rapid and strong seed development in early growth stages and slow pod wall development later are key factors responsible for the bulging pod phenotype of line ‘282’.
INV activities in pod wall differ between bulging and non-bulging pod lines
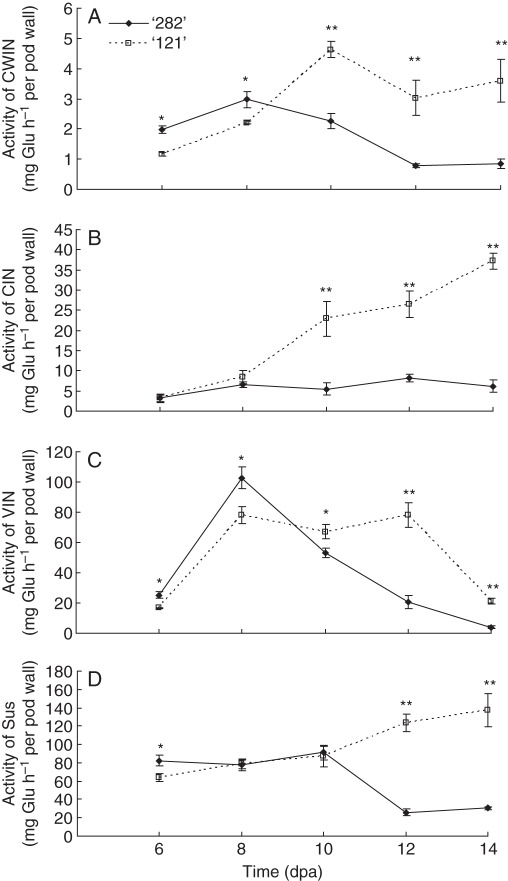
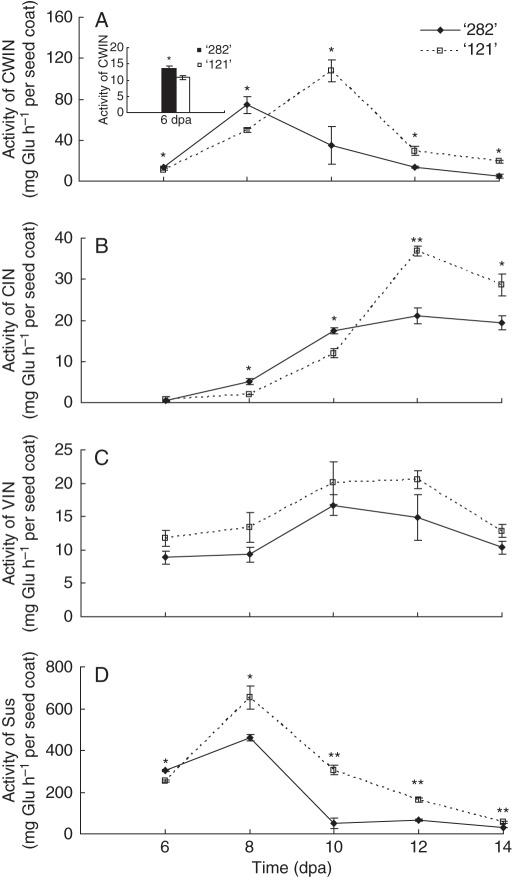
Enzyme assays revealed that in association with the sustained and strong pod wall growth in line ‘121’ from 10 dpa onwards (Fig. 2A, B), pod wall CWIN, CIN and VIN activities were significantly greater than that of line ‘282’ during this period (Fig. 3A–C). Interestingly, line ‘121’ exhibited lower CWIN and VIN activities early in development from 6 to 8 dpa (Fig. 3A, C).
Fig. 3.
Activities of CWIN (A), CIN (B), VIN (C) and Sus (D) in pod walls of line ‘282’ and line ‘121’. Each value represents means ± s.e. of three biological replicates. Each replicate includes two pod walls harvested from two plants. When not visible, s.e. bars are smaller than the symbol. Asterisks indicate significant differences (Student's t-test, *P < 0·05; **P < 0·01) between the two genotypes at each tested time point.
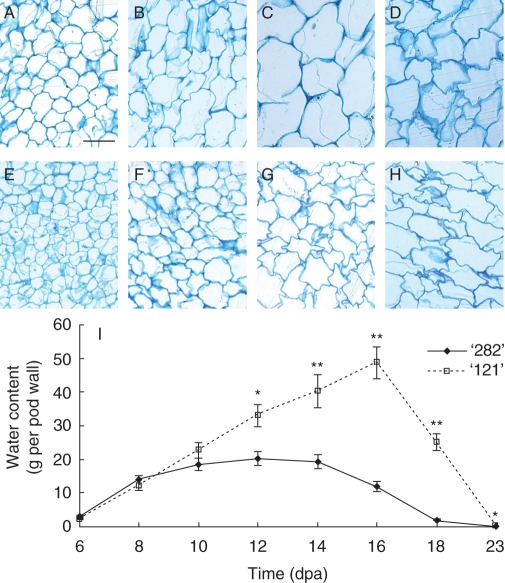
Histochemical staining revealed that thin-wall parenchyma cells of pod walls reached maximal size at 10 dpa for line ‘282’ (Fig. 4A–C versus Fig. 4D). By contrast, cells of line ‘121’ appeared to continue to expand up to and including 12 dpa (Fig. 4H versus Fig. 4G). This was verified by measuring pod wall water content, which revealed increases in cell volume. Water content increased up to 16 dpa in line ‘121’ but did not increase by 10 dpa in line ‘282’ (Fig. 4I). Water content decreased at 16 and 14 dpa in lines ‘121’ and ‘282’, respectively. These results indicate a shorter growth period and earlier senescence of pod walls in bulging line ‘282’.
Fig. 4.
Developmental progression of cell expansion in pod walls (A–H). Transverse sections of pod walls were stained with methylene blue to show cell structure of lines ‘282’ (A–D) and ‘121’ (E–H) at 6 (A, E), 8 (B, F), 10 (C, G) and 12 (D, H) dpa. Cells in the bulging line ‘282’ appeared to have reached maximal size at 10 dpa and collapsed by 12 dpa (C vs. D). By contrast, cells in line ‘121’ continued to expand from 10 to 12 dpa (G vs. H). This indicates that bulging genotype line ‘282’ terminates cell expansion in pod walls earlier than line ‘121’. Scale bar = 50 µm (A, applies to all images). (I) Water content in pod wall of lines ‘282’ and ‘121’. Each value in represents mean ± s.e. of three biological replicates. Each replicate includes three pod walls harvested from three plants. Asterisks indicate significant differences (Student's t-test, *P < 0·05; **P < 0·01) between the two genotypes at each time point.
Apoplasmic pathway of phloem unloading in seed coats of the bulging line ‘282’
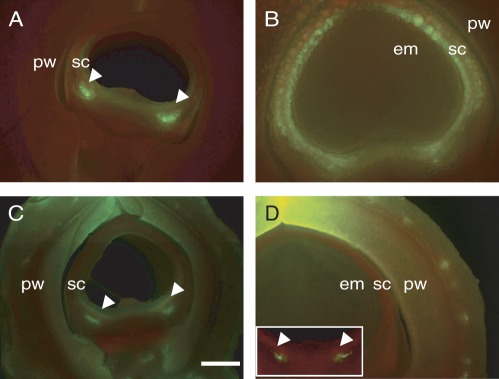
To establish an integrated view of assimilate movement from pod wall to seed, we examined CF transport in seed coats after delivery from the pod wall through their connecting funicular vascular traces. In this context, it is known that solutes move from pod wall to seed symplasmically, but not apoplasmically (Pate et al., 1985). Thus, CF must be transported from pod to seed coat through the phloem. Figure 5A and C show phloem unloading of CF from seed-coat vasculature to the surrounding region at 6 dpa in the two genotypes. By 8 dpa, the dye appeared to be confined in the seed coat vascular bundle in line ‘282’ (Fig. 5D, inset) but spread throughout the seed coat in line ‘121’ (Fig. 5B). As expected, CF did not move to the embryo (Fig. 5) due to the symplasmic discontinuity between seed coat and embryo.
Fig. 5.
Movement of symplasmic fluorescent dye, CF, in seed coats of non-bulging line ‘121’ (A, B) and a bulging line ‘282’ (C, D) at 6 (A, C) and 8 (B, D) dpa after 48 h dye feeding. Note, although CF appeared in seed coats of both genotypes at 6 dpa (A, C), particularly in the phloem unloading site at the chalazal end (arrowheads), a remarkable genotypic difference exists by 8 dpa (B vs. D): in line ‘282’ (D), CF was confined in seed coat phloem region (arrowheads in insert) and did not move to surrounding ground parenchyma cells. This contrasts with the extensive spread of CF throughout seed coats of line ‘121’ (B). pw, pod wall; sc, seed coat; em, embryo. Bar = 500 µm. Magnification of remaining images is the same as in (A).
The genotypic difference in cellular pathways of phloem unloading (Fig. 5) prompted us to examine the activities of sucrose-cleaving enzymes in seed coats (see Jin et al., 2009). At 6 and 8 dpa, seed coat CWIN activity was significantly higher in ‘282’ than ‘121’, whereas at later developmental stages (10, 12 and 14 dpa) the reverse was found (Fig. 6A). A similar pattern was found for CIN, but VIN activities were identical for both genotypes (Fig. 6B, C). Sus activity in ‘282’ seed coats was greater than in line ‘121’ at 6 dpa but decreased thereafter (Fig. 6D).
Fig. 6.
Activities of CWIN (A), CIN (B), VIN (C) and Sus (D) in seed coats of line ‘282’ and line ‘121’. Each value represents mean ± s.e. of three biological replicates. Each replicate includes four seed coats derived from two pods harvested from two plants. Asterisks indicate significant differences (Student's t-test, *P < 0·05; **P < 0·01) at each time point.
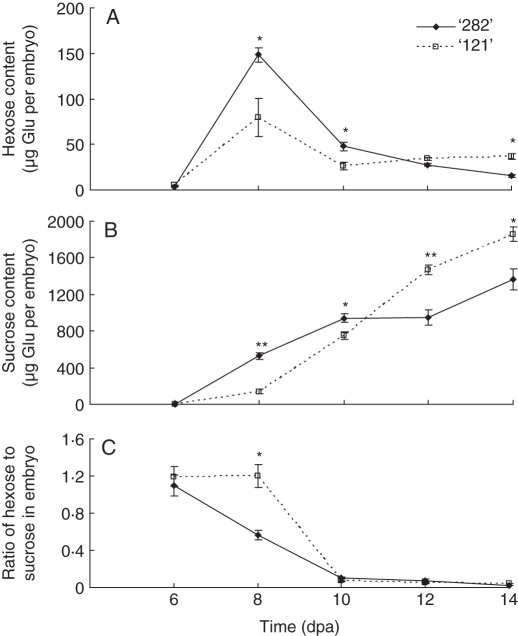
Activities of sucrose cleavage enzymes, in particular CWIN, play important roles in embryo development by controlling their carbohydrate status (Weber et al., 2005; Ruan et al., 2008). Therefore, sugar concentrations were assayed in developing embryos. Overall, for both genotypes as their seeds developed, hexoses (glucose and fructose) declined whereas sucrose increased (Fig. 7A, B) and correlated with decreases in CWIN in seed coats (Fig. 6A, D). Importantly, the hexose to sucrose ratio decreased rapidly from 6 dpa onwards in line ‘282’, whereas it remained high in line ‘121’ from 6 to 8 dpa before it dropping to low concentration at 10 dpa (Fig. 7C).
Fig. 7.
Hexoses (A) and sucrose (B) and the hexose to sucrose ratio in embryos of line ‘282’ and line ‘121’. Each value represents mean ± s.e. of three biological replicates. Each replicate includes two whole embryos derived from two pods harvested from two plants. Asterisks indicate significant differences (Student's t-test, *P < 0·05; **P < 0·01) between the two genotypes at each time point.
Starch contents of embryos increased during seed development and accounted for approx. 50 % of embryo dry weight by maturity. However, there was no significant difference in starch between the two genotypes (data not shown).
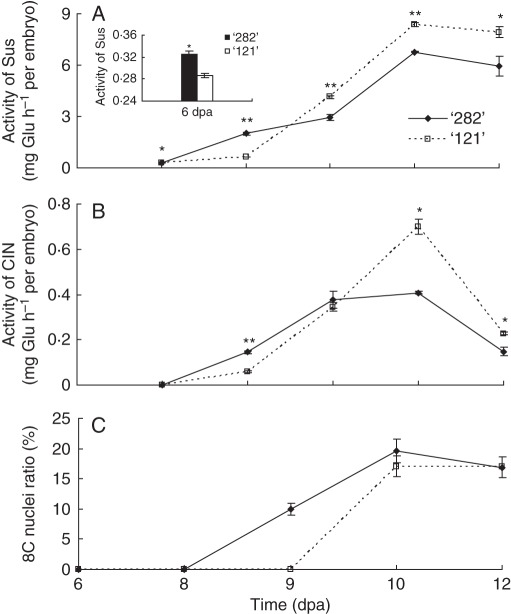
Carbohydrate status of embryos is affected not only by sugar metabolism in seed coats but also by that occurring within their tissues. Interestingly, CWIN and VIN activities were undetectable or at only trace values in developing embryos of both genotypes. By contrast, Sus activities in embryos of line ‘282’ were significantly greater than those of line ‘121’ during early stages of seed development (6 and 8 dpa) but thereafter were lower than in line ‘121’ (Fig. 8A). A similar trend was observed for CIN activity (Fig. 8B). Endoreduplication analysis revealed that cells with 8C DNA content appeared at 9 and 10 dpa for lines ‘282’ and ‘121’, respectively (Fig. 8C), indicating an earlier termination of embryo cell division in ‘282’ (see Bino et al., 1993; Lemontey et al., 2000).
Fig. 8.
Activities of Sus (A) and CIN (B) and endoreduplication (C) of embryonic cells in embryos of line ‘282’ and line ‘121’. Note earlier appearance of 8C nuclei in embryos of line ‘282’ than in those of line ‘121’. Each value represents mean ± s.e. of three biological replicates. Each replicate includes two whole embryos derived from two pods harvested from two plants. Asterisks indicate significant differences (Student's t-test, *P <0·05; **P < 0·01) between the two genotypes at each tested time point.
DISCUSSION
Low INV activity may contribute to depressed pod wall growth in the bulging pod phenotype
Analyses of growth established a significant positive correlation between seed to pod ratio and degree of pod bulging, which is attributable to faster growth of seeds early in development (8 dpa) and depressed growth of pod wall later in development from 10 dpa onwards in budging line ‘282’ compared with ‘121’ (Figs 1, 2, 4 and Supplementary Data Fig. S1).
Line ‘282’ terminated cell expansion and initiated senescence in pod walls at 10 dpa, while cells of line ‘121’ continued to expand (Fig. 4). Accordingly, pod wall fresh and dry weight reached maxima 4 d earlier in line ‘282’ than in line ‘121’ (Fig. 2). The underlying mechanism(s) for the shorter duration of pod wall development in line ‘282’ may relate to low CWIN, CIN and VIN activities from 10 dpa onwards (Fig. 3A–C), which corresponds to weak pod wall growth (Fig. 2A, B). There is now compelling evidence that CWIN plays a major role in promoting cell division by generating hexoses as positive signals (e.g. Weber et al., 1996; Vilhar et al., 2002). Thus, low CWIN activity in pod walls of line ‘282’ may lead to a low and shorter period of cell division and to earlier termination of cell expansion and onset of senescence (Fig. 4). However, the contribution of low VIN and CIN activities (Fig. 3) to the earlier arrest of pod wall growth in line ‘282’ (Figs 2 and 4) is equally possible, as demonstrated for expansion growth of cotton fibres and Arabidopsis roots (Wang et al., 2010), particularly when phloem unloading follows a symplasmic pathway (Wang and Ruan, 2010). Sus activity in pod wall of ‘282’ did not decrease until 12 dpa (Fig. 3D) when pod wall growth had already peaked (Fig. 2A, B) and cells collapsed (Fig. 4C, D). Thus, Sus is not a major contributing factor to the earlier termination of cell expansion and earlier onset of senescence observed in pod wall of line ‘282’ (Fig. 4).
Apoplasmic and symplasmic pathways in seed coats correlate with high and low CWIN activities and seed growth rate, respectively
It is of significance that the initial symplasmic path in the seed coats at 6 dpa appeared closed at 8 dpa in bulging line ‘282’ (Fig. 5C, D) and an apoplasmic phloem unloading pathway then prevailed. This contrasts with that in seed coats of line ‘121’ where CF moved throughout symplasmically (Fig. 5A, B). Linked with the apoplasmic unloading route in seed coats of line ‘282’ is higher CWIN activity at 6 to 8 dpa (Fig. 6A). High CWIN activity in seed coats could generate hexoses that are delivered to embryos to stimulate cell division. Consistent with this is that the number of embryo cells in line ‘282’ was twice that of line ‘121’ at 8 dpa (0·40 ± 0·05 vs. 0·19 ± 0·06 ×106 cells per embryo, respectively). The difference in the number of cells accounts for differences in their seed fresh or dry weight at this developmental stage (Fig. 2C, D). Stimulation of embryo cell division by CWIN-derived hexoses has been well documented in Vicia faba (Weber et al., 1996, 1998).
CWIN activity in seed coats of line ‘282’ decreased rapidly after 8 dpa, 2 d earlier than that of line ‘121’ (Fig. 6A). This may cause an earlier decline of hexose to sucrose ratio (Fig. 7C), which drives earlier onset of nuclei endoreduplication (Fig. 8C), a sign that cell division has stopped (Bino et al., 1993; Lemontey et al., 2000). Consistently, embryo Sus activity was found to be higher at 8 dpa in line ‘282’ than in line ‘121’ (Fig. 8A). High Sus activity could contribute to earlier initiation of the seed storage process in line ‘282’ by degrading sucrose for biosynthesis of starch and protein (see Weber et al., 2005; Ruan et al., 2008).
Finally, to address the issue that genotypic comparison made based on days post anthesis may not necessarily reflect that from the same developmental stage, we examined developmental changes of water content, an indicator of developmental stage, in pod wall and seed between the bulging line ‘282’ and the non-bulging line ‘121’. This revealed no difference in their water content from 6 to 12 dpa (Supplementary Data Fig. S2), when the bulging pod phenotype had developed (Figs 1 and 2 and Discussion above). This suggests overall similar developmental profiles between the two lines during this period. Thus, the observed genotypic differences in growth and enzyme activity measurements based on days post anthesis appear to reflect differences at the same or similar developmental stages between the genotypes during this period. Pod and seed water content, however, decreased much faster in line ‘282’ than in ‘121’ at 14 dpa onwards (Fig. S2), consistent with the finding that pod and seed of the former entered senescence earlier than the latter (Figs 2 and 4 and relevant sections in Results and Discussion above).
In conclusion, this study provides novel data showing genotypic differences in sucrose metabolism in relation to the cellular pathway of phloem unloading in developing seed coats and to pod and seed growth rates. Low INV activity in the pod wall corresponds to a shortened and weak growth period whereas the apoplasmic path in seed coat is associated with high CWIN activity and strong early seed growth. The findings provide a physiological explanation for the undesirable bulging pod phenotype in asparagus bean and a basis for further molecular studies to dissect the causality between changes of unloading pathway, INV activity and bulging pod phenotype.
SUPPLEMENTARY DATA
ACKNOWLEDGEMENTS
This work was supported by the Natural Science Foundation of Zhejiang Province (grant number Y3110595 to G.-J.L.) and Australia Research Council (DP110104931 to Y.-L.R.).
LITERATURE CITED
- Bino RJ, Lanter S, Verhoeven HA, Kraak HL. Flow cytometric determination of nuclear replication stages in seed tissues. Annals of Botany. 1993;72:181–187. [Google Scholar]
- Chourey PS, Taliercio EW, Carlson SJ, Ruan YL. Genetic evidence that the two isozymes of sucrose synthase present in developing maize endosperm are critical, one for cell wall integrity and the other for starch biosynthesis. Molecular & General Genetics. 1998;259:88–96. doi: 10.1007/s004380050792. [DOI] [PubMed] [Google Scholar]
- Déjardin A, Rochat C, Wuillème J, Boutin P. Contribution of sucrose synthase, ADP-glucose pyrophosphorylase and starch synthase to starch synthesis in developing pea seeds. Plant, Cell and Environment. 2008;20:1421–1430. [Google Scholar]
- Gifford RM, Thorne JH. Sucrose concentration at the apoplastic interface between seed coat and cotyledons of developing soybean seeds. Plant Physiology. 1985;77:863–868. doi: 10.1104/pp.77.4.863. [DOI] [PMC free article] [PubMed] [Google Scholar]
- Heim U, Weber H, Biiumlein H, Wobus U. A sucrose-synthase gene of Vicia faba L.: expression pattern in developing seeds in relation to starch synthesis and metabolic regulation. Planta. 1993;191:394–401. doi: 10.1007/BF00195698. [DOI] [PubMed] [Google Scholar]
- Jin Y, Ni DA, Ruan YL. Posttranslational elevation of cell wall invertase activity by silencing its inhibitor in tomato delays leaf senescence and increases seed weight and fruit hexose level. The Plant Cell. 2009;21:2072–2089. doi: 10.1105/tpc.108.063719. [DOI] [PMC free article] [PubMed] [Google Scholar]
- Lemontey C, Mousset-Déclas C, Munier-Jolain N, Boutin J. Maternal genotype influences pea seed size by controlling both mitotic activity during early embryogenesis and final endoreduplication level/cotyledon cell size in mature seed. Journal of Experimental Botany. 2000;51:167–175. doi: 10.1093/jexbot/51.343.167. [DOI] [PubMed] [Google Scholar]
- Li Z, Palmer WM, Martin AP, et al. High invertase activity in tomato reproductive organs correlates with enhanced sucrose import into, and heat tolerance of, young fruit. Journal of Experimental Botany. 2012;63:1155–1166. doi: 10.1093/jxb/err329. [DOI] [PMC free article] [PubMed] [Google Scholar]
- Lunn JE, Hatch MD. Primary partitioning and storage of photosynthate in sucrose and starch in leaves of C4 plants. Planta. 1995;197:385–391. [Google Scholar]
- Ma Q, Behboudian MH, Turner NC, Palta JA. Gas exchange by pods and subtending leaves and internal recycling of internal CO2 by pods of chickpea (Cicer arietinum L.) subjected to water deficits. Journal of Experimental Botany. 2001;52:123–131. [PubMed] [Google Scholar]
- Neubohn B, Gubatz S, Wobus U, Weber H. Sugar levels altered by ectopic expression of a yeast-derived invertase affect cellular differentiation of developing cotyledons of Vicia narbonensis L. Planta. 2000;211:325–334. doi: 10.1007/s004250000305. [DOI] [PubMed] [Google Scholar]
- Pate JS, Peoples MB, van Bel AJE, Kuo J, Craig A, Atkins CA. Diurnal water balance of the Cowpea fruit. Plant Physiology. 1985;77:148–156. doi: 10.1104/pp.77.1.148. [DOI] [PMC free article] [PubMed] [Google Scholar]
- Peoples MB, Pate JS, Atkins CA, Murray DR. Economy of water, carbon, and nitrogen in the developing cowpea fruit. Plant Physiology. 1985;77:142–147. doi: 10.1104/pp.77.1.142. [DOI] [PMC free article] [PubMed] [Google Scholar]
- Pugh DA, Offler CE, Talbot MJ, Ruan YL. Evidence for the role of transfer cells in the evolutionary increase of seed and fiber biomass yield in cotton. Molecular Plant. 2010;3:1075–1086. doi: 10.1093/mp/ssq054. [DOI] [PubMed] [Google Scholar]
- Roitsch T, González M-C. Function and regulation of plant invertases, sweet sensations. Trends in Plant Science. 2004;9:1360–1385. doi: 10.1016/j.tplants.2004.10.009. [DOI] [PubMed] [Google Scholar]
- Ruan Y-L, Llewellyn DJ, Furbank RT. The control of single-celled cotton fiber elongation by developmentally reversible gating of plasmodesmata and coordinated expression of sucrose and K+ transporters and expansin. Plant Cell. 2001;13:47–60. doi: 10.1105/tpc.13.1.47. [DOI] [PMC free article] [PubMed] [Google Scholar]
- Ruan Y-L, Llewellyn DJ, Furbank RT, Chourey PS. The delayed initiation and shortened elongation of fuzz-like short fibres in relation to altered patterns of sucrose synthase expression and plasmodesmata gating in a lintless mutant. Journal of Experimental Botany. 2005;56:977–984. doi: 10.1093/jxb/eri091. [DOI] [PubMed] [Google Scholar]
- Ruan Y-L, Llewellyn DJ, Liu Q, et al. Expression of sucrose synthase in the developing endosperm is essential for early seed development in cotton. Functional Plant Biology. 2008;35:382–393. doi: 10.1071/FP08017. [DOI] [PubMed] [Google Scholar]
- Ruan Y-L, Jin Y, Li GJ, Yang YJ, Boyer JS. Sugar input, metabolism and signaling mediated by invertase: roles in development, yield potential and response to drought and heat. Molecular Plant. 2010;3:942–955. doi: 10.1093/mp/ssq044. [DOI] [PubMed] [Google Scholar]
- Tomlinson KL, McHugh S, Labbe H, et al. Evidence that the hexose-to-sucrose ratio does not control the switch to storage product accumulation in oilseeds: analysis of tobacco seed development and effects of overexpressing apoplastic invertase. Journal of Experimental Botany. 2004;55:2291–2303. doi: 10.1093/jxb/erh251. [DOI] [PubMed] [Google Scholar]
- Vilhar B, Kladnik A, Blejec A, Chourey PS, Dermastia M. Cytometrical evidence that the loss of seed weight in the miniature1 seed mutant of maize is associated with reduced mitotic activity in the developing endosperm. Plant Physiology. 2002;129:23–30. doi: 10.1104/pp.001826. [DOI] [PMC free article] [PubMed] [Google Scholar]
- Wang L, Ruan Y-L. Unraveling mechanisms of cell expansion linking solute transport, metabolism, plasmodesmtal gating and cell wall dynamics. Plant Signalling & Behaviour. 2010;5:1–4. doi: 10.4161/psb.5.12.13568. [DOI] [PMC free article] [PubMed] [Google Scholar]
- Wang L, Li XR, Lian H, He YK, Chen XY, Ruan Y-L. Evidence that high activity of vacuolar invertase is required for cotton fiber and Arabidopsis root elongation through osmotic dependent and independent pathway, respectively. Plant Physiology. 2010;154:744–756. doi: 10.1104/pp.110.162487. [DOI] [PMC free article] [PubMed] [Google Scholar]
- Weber H, Borisjuk L, Wobus U. Controlling seed development and seed size in Vicia faba: a role for seed coat-associated invertases and carbohydrate state. The Plant Journal. 1996;10:823–834. [Google Scholar]
- Weber H, Heim U, Golombek S, Borisjuk L, Manteuffel R, Wobus U. Expression of a yeast-derived invertase in developing cotyledons of Vicia narbonensis alters the carbohydrate state and affects storage functions. The Plant Journal. 1998;16:163–172. doi: 10.1046/j.1365-313x.1998.00282.x. [DOI] [PubMed] [Google Scholar]
- Weber H, Borisjuk L, Wobus U. Molecular physiology of legume seed development. Annual Review of Plant Biology. 2005;56:253–279. doi: 10.1146/annurev.arplant.56.032604.144201. [DOI] [PubMed] [Google Scholar]
- Xu S-M, Brill E, Llewellyn DJ, Furbank RT, Ruan Y-L. Over-expression of a potato sucrose synthase gene in cotton accelerates leaf expansion, reduces seed abortion and enhances fiber production. Molecular Plant. 2012 doi: 10.1093/mp/ssr090. in press. http://dx.doi.org/10.1093/mp/ssr090 . [DOI] [PubMed] [Google Scholar]
Associated Data
This section collects any data citations, data availability statements, or supplementary materials included in this article.


