Abstract
While microarray experiments generate voluminous data, discerning trends that support an existing or alternative paradigm is challenging. To synergize hypothesis building and testing, we designed the Pathogen Associated Drosophila MicroArray (PADMA) Database for easy retrieval and comparison of microarray results from immunity-related experiments (www.padmadatabase.org). PADMA also allows biologists to upload their microarray-results and compare it with datasets housed within the database. We tested PADMA using a preliminary dataset from Ganaspis xanthopoda-infected fly larvae, and uncovered unexpected trends in gene expression, reshaping our hypothesis. Thus, the PADMA database will be a useful resource to fly researchers to evaluate, revise and refine hypotheses.
Key words: database, functional genomics, hypothesis building, immunity, microarray, pathogen, Toll-NFκB
Introduction
Microarray technology is now widely used to study gene expression.1 With close to 300 microarray experiments deposited in public repositories on Drosophila alone,2 data management is becoming an increasing challenge. Consequently, databases are continuously developed to mine information from experiments performed on the whole body, dissected tissues, or even from Drosophila cells in culture.2–5 However, there is paucity of simple, specialty databases with routine data integration and data retrieval capabilities that can also support hypothesis building. Such a database, where researchers can harness valuable information even from preliminary data to assess hypotheses, would be material for model organism-based research community, where high quality genomic sequence data and annotation are already in place. To provide a simple tool for everyday research, we developed the Pathogen Associated Drosophila MicroArray (PADMA) Database (www.padmadatabase.org).
PADMA is a web-based, specialty database, housing Drosophila immunity-related microarray datasets from processed data files in the public domain. PADMA was conceptualized with two key features: (1) ability to compare expression results across experiments; and (2) upload and analyze datasets by members of the research community. We tested both these features with a new dataset obtained from Drosophila larvae parasitized with Ganaspis xanthopoda,6 a parasitic wasp whose effect on the host gene expression has not yet been studied. A third consideration for PADMA was a simple design structure that can be adapted by others for a similar research approach.
In nature, Drosophila are attacked by microbial (viral, bacterial, fungal), and metazoan (parasitic wasps) pathogens.7,8 These infections elicit tissue- and cell-specific responses, perturbing normal homeostasis and development of the host. While pathogenic bacteria can be ingested with food,9 parasitic wasps inject their eggs directly into the hemocoel. Pathogen infection activates the conserved Toll-or IMD immune pathways, each of which engages transcription factors of the NFκB family. The JAK-STAT and pro-phenol oxidase cascades also play a significant role in host defense. The resulting systemic host immune responses originate primarily in blood cells and the fat body.8
Microbial and metazoan pathogens introduce virulence factors into their hosts. While transcriptomics of infected hosts have provided significant insights into the molecular underpinnings of host immunity, much less is known about the molecular basis of immune suppression.10,11 During oviposition, parasitic wasps also introduce venom factors produced in the wasp venom gland into the larval hemocoel, which alter the immune physiology and development of the host.12 The final outcome of the infection is thus driven by the unique host/pathogen interaction that can be understood at the molecular level.11,13 The venom factors of Drosophila wasps L. boulardi and L. heterotoma actively inhibit the encapsulation response in D. melanogaster larvae. However, while L. heteroma-14 venom kills host hemocytes, L. boulardi-17 does not. Furthermore, whereas L. heterotoma-14 barely perturbs host transcription, L. boulardi-17 infection modulates the expression of hundreds of host genes.11,14,15
Like L. heterotoma, venom factors from G. xanthopoda compromise the viability of larval blood cells and inhibit egg encapsulation (our unpublished results).16 Since both Leptopilina and Ganaspis are Figitids,17 we wondered if G. xanthopoda infection also restricts the activation of humoral immune genes that are typically induced by microbes and L. boulardi-17. We used the PADMA database to compare published data from Leptopilina-infected hosts with a dataset from hosts infected with G. xanthopoda. We found that even though G. xanthopoda virulence resembles that of L. heterotoma, its effects on global host transcription are distinct from either Leptopilina spp. This comparison predicts that virulence mechanisms of G. xanthopoda may be quite different.
Results
Padma design.
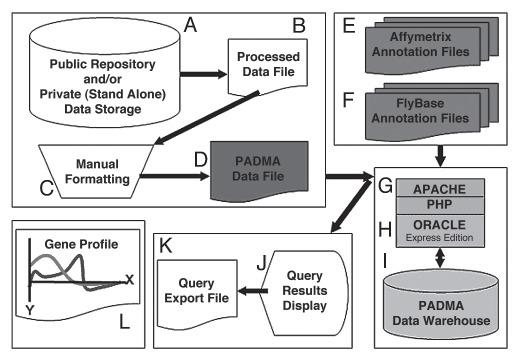
PADMA administrators access a publicly available repository like GEO or ArrayExpress (Fig. 1A) and retrieve processed data files (Fig. 1B). PADMA administrators then manually format the downloaded processed data files into PADMA Data Files (Fig. 1C and D). Formatting PADMA Data Files involves (1) taking the average signal value across replicates by probeset ID, and (2) calculating fold induction from such averages between experimental and control classes. These steps yield one file per time point. In datasets without time points, only a single file is generated. Because different filtering and normalization parameters could have been applied while processing raw images, direct comparison of absolute signal value between processed data files can be misleading.2,18 We, therefore, designed PADMA to simply compare trends of gene expression between experiments without directly comparing signal value.
Figure 1.
Database design. Schematic of flow of data, storage points, access points and interface processing (A–K). PADMA administrator retrieves processed data files (A and B) and manually formats them (C) into PADMA Data File (D). PADMA administrator downloads Affymetrix® (E) and FlyBase (F) annotation files to update PADMA metadata registry. PADMA Data File, along with Affymetrix® and FlyBase annotation files, are uploaded through Apache/PHP data loader (G) and processed within Oracle XE framework (H). PADMA users retrieve housed data (I) by specifying search criteria, and either view it on screen (J) or export as CSV files (K). Exported files can be opened in MS Excel® or other data processing applications for further analysis (L).
The microarray experiment-derived information in PADMA Data Files includes: category of experiment (Microbial or Parasitoid), experiment subject (Larvae or Hemocytes) and experiment name (a unique combination of fifteen characters that includes the author's name). The PADMA Data File contains a total of eight microarray experiment-derived variables and must be saved and uploaded as a Comma Separated Value file. PADMA also houses annotation metadata (such as Gene Name, CG number, FlyBase Number and GO Number). Like microarray data, the annotation metadata must be uploaded onto PADMA, and updated regularly by downloading contents from Affymetrix® and FlyBase (Fig. 1E and F). The combination of data contained in the PADMA Data File and annotation metadata results in 13 essential variables (Table 1) for querying and comparing microarray experiments. Users can currently query close to 50 datasets warehoused in PADMA from over 12 publications (please visit www.padmadatabase.org for a list of current datasets housed in PADMA) by selecting any of these variables as search criteria. We expect the PADMA data warehouse to expand as additional datasets become available in the public domain, and are incorporated into the data warehouse.
Table 1.
PADMA upload and retrieval criteria
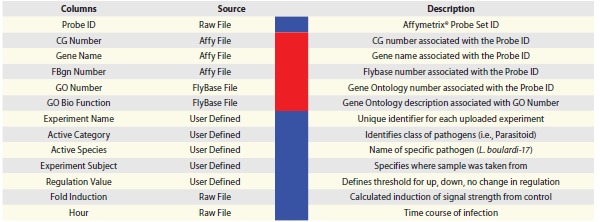 |
PADMA houses 13 variables, which are also known as query or search criteria. The sources of these variables are as follows: three are directly from processed files (with fold induction averaged and calculated), five are specified by the administrator or user (in user upload cases) to define the dataset, and five are metadata points obtained from Affymetrix® and FlyBase annotation files. When uploading data, eight of these variables (blue) are required in the PADMA Data File for successful upload (Fig. 1). The remaining five variables (red) are associated behind the scene during a query protocol, depending on the query tool used.
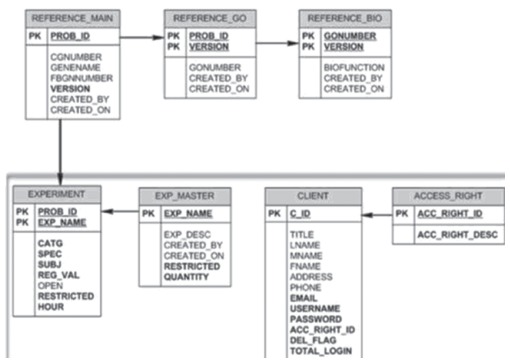
The PADMA Data File or annotation file is uploaded to PADMA through APACHE/PHP interface (Fig. 1G), associated in an object-relational framework through Oracle® XE (Fig. 1H), and stored in the Data Warehouse (Fig. 1I). Each variable is placed in respective tables, associated by primary keys in an object-relational scheme (Fig. 2). “Reference” pre-fixed tables relate to annotation metadata, and are noted as either “Affy File” or “FlyBase File” in Table 1. Because it is the predominantly used microarray, PADMA is designed to support Affymetrix® data format. “Experiment” prefixed tables relate to data from PADMA Data File. “Client” and “Access-Right” tables relate to user registration and security compliance, respectively. Users can upload their datasets by following the same procedure in generating and uploading PADMA Data File. One key difference is that user-uploaded datasets remain confidential. Thus unpublished, preliminary data can be used to compare against published datasets in the data warehouse, confidentially.
Figure 2.
PADMA data and metadata relational schema. The semantic association intrinsic to all files, experimental and metadata, uploaded to PADMA. The architecture is designed to link reference and experiment type data. All relations in the database are normalized using E.F. Codd's normal form to ensure against any insertion selection or deletion anomalies that can compromise the integrity of data.
Querying Padma.
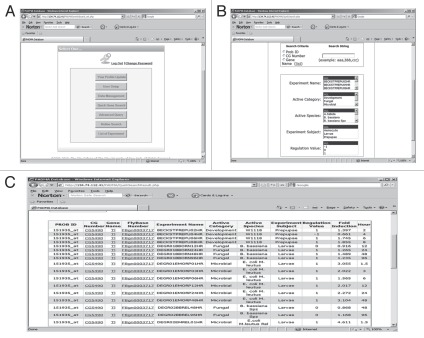
Users must register in order to access the database components of PADMA. While PADMA is an unrestricted database open to everyone, the registration process is intended to ensure security for users uploading confidential, unpublished results. Upon logging in, users can choose to query, upload datasets, or view a list of microarray publications currently in PADMA (Fig. 3A). PADMA offers three query options: (1) Quick Gene Search, (2) Advance Search and (3) Refine Search. Quick Gene Search allows users to search one or more genes or probeset IDs (Fig. 3B). Users can select all search options or any combination of criteria for a narrower, targeted search and also include their respective, unpublished datasets in these searches. Users, however, cannot query by GO Number or GO Biological description in Quick Gene Search option. Once query criteria are selected and submitted, PADMA displays query results (Figs. 1J and 3C). Each gene in the query result is hyperlinked to FlyBase (www.flybase.org).
Figure 3.
Quick Gene Search. Screenshots of PADMA functions menu (A), Quick Gene Search (B) and query result from Quick Gene Search (C).
Advance Search offers greater flexibility than Quick Gene Search. Whereas users are required to input a gene name, Probeset ID, or CG Number in Quick Gene Search, they can query any combination of criteria in an Advanced Search. Also, users can query by GO Number or GO Biological description in Advance Search. The key difference between the two search options is that the query result in Quick Gene Search is unique to a probeset ID, and therefore, returns one result per probeset ID. On the other hand, Advance Search result is unique to a GO Number, and thus, results may yield the same probeset ID more than once if the probeset ID is associated with multiple GO Numbers. Refine Search is a hybrid of Quick Gene Search and Advanced Search, offering users a third query option. Users can export all three types of query results in CSV format by clicking on the ‘Export File’ button (Fig. 1K). Data contained in the exported file can be plotted using an application like MS Excel® to compare expression profiles (Fig. 1L).
Proof-of-concept: Analysis of G. xanthopoda infection through PADMA.
To compare genome-wide host gene expression changes after G. xanthopoda infection with published data, we used PADMA to compare preliminary results from a 3-hour infection. We uploaded these files onto PADMA by converting processed files into PADMA Data Files. We then queried datasets from G. xanthopoda, L. boulardi-17 and L. heterotoma-14 infections using Advanced Search. We exported the query results and compiled them onto a MS Excel® spreadsheet. Using logic functions in MS Excel®, we compared differential regulation (<0.5- or >2-fold induction relative to respective, uninfected controls) of all the probesets among these datasets. We found that G. xanthopoda infection differentially regulates more host genes than either L. boulardi-17 or L. heterotoma-14 infections.
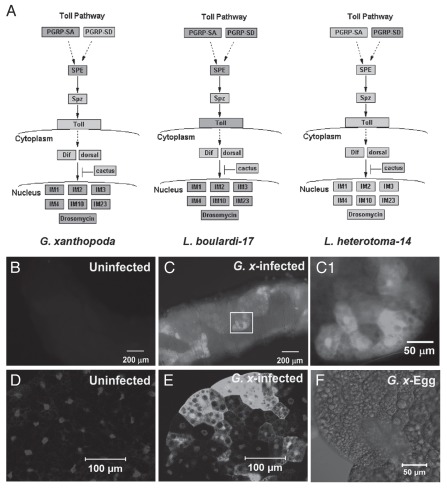
We modified PADMA export files and uploaded them onto GenMAPP19 (http://www.genmapp.org) to compare expression profiles of various immune (Toll and Imd) pathway genes. We found that like L. boulardi-17 and L. heterotoma-14,14 G. xanthopoda did not appear to activate components or targets of the Imd pathway, although this prediction needs to be confirmed in future experiments. However, like L. boulardi-17 infection, the expression of many components and targets of the Toll pathway is activated in hosts after G. xanthopoda infection (Fig. 4A). While L. heterotoma-14 infection appears to activate expression of PGRP-SD (a recognition molecule), none of the subsequent components or targets of the Toll pathway examined were activated.14 Interestingly, both G. xanthopoda and L. boulardi-17 infections elicited upregulation of SPE, the processing enzyme that cleaves pro-Spatzle to produce an activated form of Spatzle. The latter serves as the ligand for the Toll receptor.8 The activation of the Toll pathway in the fat body after G. xanthopoda infection was confirmed with expression of Toll pathway target drosomycin in larvae carrying transgenic drosomycin-GFP reporter20 (Fig. 4B–F).
Figure 4.
Gene expression changes after G. xanthopoda-infection. Gene expression of Toll pathway components and targets in host larvae after G. xanthopoda, L. boulardi-1714 and L. heterotoma-1414 infections are shown, respectively (A). Boxes represent genes, where dark grey indicates activation and light grey indicates no change. Solid arrows indicate direct up or downstream relationship. Drosomycin-GFP larva imaged directly without infection (B) or after infection (C, inset for higher magnification, C1). Fat body dissected from an uninfected (D) or infected (E) Drosomycin-GFP larva. GFP signal is in white. Parasite egg, imaged in phase, appears as a translucent semi-circular structure on the fat body(F). Samples in (D–F) are stained with Hoechst 33258 for DNA. The staining appears white in these images
Discussion
The rationale of the PADMA database was to organize gene expression data to facilitate developing new paradigms that can only arise with the totality of transcriptomic information in multiple experimental contexts. Despite the remarkable insights gleaned primarily from genetic/genomic studies, fundamental questions about natural host/pathogen interactions and evolution of virulence still remain. Depending on the frequency of infection, co-infection and type of pathogen, signaling pathways and genes are differentially expressed with specificity in space and time; their activities align with the developmental and immune physiology of the host. Moreover, the pathway components also interact with other molecules, forming a network of interactions. Microarray data have been used to build molecular networks for yeast, C. elegans and mammalian cells in culture.21 One motivation of developing the PADMA database is to bridge the gap between global transcription and immune physiology of insects. Such a network can reveal aspects of host biology that may not be directly related to immune response, but nevertheless contribute to the host's ability to fight or withstand infection.
Using PADMA as a guide in studying G. xanthopoda infection.
Using G. xanthopoda infection, we show that both goals in conceptualizing PADMA were realized. PADMA's metadata association to FlyBase and Gene Ontology enabled us to derive annotations inherent in these databases. Uploading query results from PADMA onto GenMAPP allowed rapid comparison of changes in Toll pathway genes. Our results suggest that although G. xanthopoda infection activates Toll signaling in a manner that is likely to be similar to microbial (fungal) and other metazoan (L. boulardi-17) pathogens,8,11 its virulence mechanism may be unique. Although the Ganaspis and Leptopilina genera are in the same Figitidae family, they are still phylogenetically quite distant, each belonging to a different subfamily.17 Even within the Leptopilina genus, stark differences in infection strategies have been reported.14 It is therefore not all that surprising that G. xanthopoda's effects on the host are different from Leptopilina's.
Relevance of the PADMA database to Drosophila and other insects.
Many biological events and their molecular underpinnings defined in Drosophila are shared in other insects. Proteins from other insects are often expressed in Drosophila to understand how their mis-expression affects the biology of Drosophila. One study found that in transgenic D. melanogaster with high levels of cell surface proteins of the Plasmodium sporozoites, the expression of immune related genes were affected, although the Toll pathway expression was repressed.22 The PADMA database can help understand such results more clearly in the context of Drosophila immunity against natural pathogens and the pathogen's ability to suppress or evade host defense.
Comparative transcriptomic studies of insects other than Drosophila via the PADMA database can facilitate functional genomics of other insects to interconnect ideas not easily possible through bench experiments alone. The scope and utility of the PADMA database, therefore, extends beyond the model organism, into the study of insects of agricultural importance and disease vectors. The database has also been successfully utilized as a module for instruction to Biology students at The City College of New York. Finally, the PADMA database design (Fig. 1) can be easily replicated with relative ease for similar specialty databases in an object-relational schema (Fig. 3). In fact, due to this object-relational platform design, PADMA can easily adapt to new transcriptome platforms, including deep sequencing, by simply adding new relationships onto the existing design schema. In principle, it should be possible to link such specialty databases that could enhance broad collaborative efforts.
Materials and Methods
Database implementation.
PADMA runs in a platform-independent environment (Fig. 3). Apache/PHP layer processes web access, allowing menu-based data upload and retrieval operations, and Oracle express edition (XE) realizes data storage in the backend (Fig. 1G–H). Oracle XE is a free version of the Oracle database system, subject to some restrictions (Oracle 2007). While the current PADMA implementation benefits from Oracle's object-relational capability, migration to a relational framework (e.g., MySQL and PostgreSQL, Microsoft SQL) is feasible with some adjustments. The server is installed in a secure network environment, and a log traces all access to accounts.
PADMA is augmented with a periodic loading of PADMA Data Files, followed by the complex assembly process. PADMA starts the loading operation by reading the input data to ensure that semantic constraints are met. The assembly operation then analyzes and builds the association between PADMA Data Files and the annotation metadata. These operations are implemented using PHP script that runs the entire processes as a single transaction. The PADMA administrator can execute the script. The load process can be re-run as many times as there are input files because the process will always rebuild linkages based on the database contents. After the relationship is established, uploaded data are available for query and export.
We conducted alpha testing with biology and non-biology student volunteers. The testing protocol was designed to ensure that the key functions of the database are tested, and test forms were formatted to maintain consistency throughout testing sessions. Feedback and comments were incorporated in the design of the beta version of PADMA, now available on the web. Comments from users will be incorporated in future releases.
Microarray experiment and validation.
From a 2-day egglay, 100 y w larvae were collected and divided equally into two Petri dishes containing standard fly food. Twenty G. xanthopoda females were allowed to infect these hosts for 3 hours. Immediately upon removal of the wasps, infected and control uninfected larvae were frozen in liquid nitrogen and ground in Trizol. RNA was extracted from the animals, checked by agarose gel-electrophoresis to ensure the integrity of the RNA. RNA samples were used by the Microarray Core Facility at Weill Cornell Medical College for cDNA preparation and hybridization to Affymetrix® GeneChip, Drosophila Genome v2.0 (Affymetrix, Santa Clara, CA). Results were deposited in Gene Expression Ombudsman (GEO), Accession GSE 25522.
To assess Drosomycin-GFP expression in the fat bodies, developmentally-synchronized third-instar y w; P{w+ Drosomycin-GFP} larvae were infected with G. xanthopoda. Success of infection was confirmed by dissecting a sample of infected larvae. GFP expression was monitored either without dissection through the larval cuticle or after dissection. Dissected fat bodies were fixed with 4% paraformaldehyde, prepared in 2% sucrose in PBS at pH 7.6. After three washes, samples were counterstained with nuclear dye Hoechst 33258 (Invitrogen Molecular Probes, Eugene, OR) and mounted in 50% glycerol in PBS. Images were obtained using a Zeiss LSM510 confocal microscope.
Acknowledgements
We are grateful to authors of the studies whose data are included in this database. We thank members of the Govind lab for their input at all stages of the project, especially during the alpha-testing phase. This project was supported by funding from the following sources: USDA (NRI/NIFA/USDA 2006-03817 and 2009-35302-05277), NIH (NIGMS S06 GM08168 and G12-RR03060, GM056833-10) and PSC-CUNY.
References
- 1.Schena M, Shalon D, Davis RW, Brown PO. Quantitative monitoring of gene expression patterns with a complementary DNA microarray. Science. 1995;270:467–470. doi: 10.1126/science.270.5235.467. [DOI] [PubMed] [Google Scholar]
- 2.Costello J, Cash AC, Dalkilic MM, Andrews J. Data pushing: a fly-centric guide to bioinformatics tools. Fly (Austin) 2008;2:1–18. doi: 10.4161/fly.5864. [DOI] [PubMed] [Google Scholar]
- 3.Chintapalli VR, Wang J, Dow JA. Using FlyAtlas to identify better Drosophila melanogaster models of human disease. Nat Genet. 2007;39:715–720. doi: 10.1038/ng2049. [DOI] [PubMed] [Google Scholar]
- 4.Kumar S, Jayaraman K, Panchanathan S, Gurunathan R, Marti-Subirana A, Newfeld SJ. BEST: a novel computational approach for comparing gene expression patterns from early stages of Drosophila melanogaster development. Genetics. 2002;162:2037–2047. doi: 10.1093/genetics/162.4.2037. [DOI] [PMC free article] [PubMed] [Google Scholar]
- 5.Sims D, Bursteinas B, Gao Q, Zvelebil M, Baum B. FLIGHT: database and tools for the integration and cross-correlation of large-scale RNAi phenotypic datasets. Nucleic Acids Res. 2006;34:479–483. doi: 10.1093/nar/gkj038. [DOI] [PMC free article] [PubMed] [Google Scholar]
- 6.Melk JP, Govind S. Developmental analysis of Ganaspis xanthopoda, a larval parasitoid of Drosophila melanogaster. J Exp Biol. 1999;202:1885–1896. doi: 10.1242/jeb.202.14.1885. [DOI] [PubMed] [Google Scholar]
- 7.Govind S. Innate immunity in Drosophila: Pathogens and pathways. Insect Sci. 2008;15:29–43. doi: 10.1111/j.1744-7917.2008.00185.x. [DOI] [PMC free article] [PubMed] [Google Scholar]
- 8.Lemaitre B, Hoffmann J. The host defense of Drosophila melanogaster. Annu Rev Immunol. 2007;25:697–743. doi: 10.1146/annurev.immunol.25.022106.141615. [DOI] [PubMed] [Google Scholar]
- 9.Buchon N, Broderick NA, Poidevin M, Pradervand S, Lemaitre B. Drosophila intestinal response to bacterial infection: activation of host defense and stem cell proliferation. Cell Host Microbe. 2009;5:200–211. doi: 10.1016/j.chom.2009.01.003. [DOI] [PubMed] [Google Scholar]
- 10.Apidianakis Y, Mindrinos MN, Xiao W, Lau GW, Baldini RL, Davis RW, et al. Profiling early infection responses: Pseudomonas aeruginosa eludes host defenses by suppressing antimicrobial peptide gene expression. Proc Natl Acad Sci USA. 2005;102:2573–2578. doi: 10.1073/pnas.0409588102. [DOI] [PMC free article] [PubMed] [Google Scholar]
- 11.Lee MJ, Kalamarz ME, Paddibhatla I, Small C, Rajwani R, Govind S. Virulence factors and strategies of Leptopilina spp.: selective responses in Drosophila hosts. Adv Parasitol. 2009;70:123–145. doi: 10.1016/S0065-308X(09)70005-3. [DOI] [PMC free article] [PubMed] [Google Scholar]
- 12.Ferrarese R, Morales J, Fimiarz D, Webb BA, Govind S. A supracellular system of actin-lined canals controls biogenesis and release of virulence factors in parasitoid venom glands. J Exp Biol. 2009;212:2261–2268. doi: 10.1242/jeb.025718. [DOI] [PMC free article] [PubMed] [Google Scholar]
- 13.Kraaijeveld AR, Godfray HC. Evolution of host resistance and parasitoid counter-resistance. Adv Parasitol. 2009;70:257–280. doi: 10.1016/S0065-308X(09)70010-7. [DOI] [PubMed] [Google Scholar]
- 14.Schlenke TA, Morales J, Govind S, Clark AG. Contrasting infection strategies in generalist and specialist wasp parasitoids of Drosophila melanogaster. PLoS Pathog. 2007;3:1486–1501. doi: 10.1371/journal.ppat.0030158. [DOI] [PMC free article] [PubMed] [Google Scholar]
- 15.Paddibhatla I, Lee MJ, Kalamarz ME, Ferrarese R, Govind S. Role for sumoylation in systemic inflammation and immune homeostasis in Drosophila larvae. PLoS Pathog. 2010;6:e1001234. doi: 10.1371/journal.ppat.1001234. [DOI] [PMC free article] [PubMed] [Google Scholar]
- 16.Sorrentino RP, Carton Y, Govind S. Cellular immune response to parasite infection in the Drosophila lymph gland is developmentally regulated. Dev Biol. 2002;243:65–80. doi: 10.1006/dbio.2001.0542. [DOI] [PubMed] [Google Scholar]
- 17.Buffington ML, Nylander JAA, Heraty JM. The phylogeny and evolution of Figitidae (Hymenoptera: Cynipoidea) Cladistics. 2007;23:403–431. [Google Scholar]
- 18.Gohlmann H, Talloen W. Gene expression studies using affymetrix microarrays. In: Louis J, Gross SL, editors. CRC Mathematical and Computational Biology Series. Boca Raton, FL: Chapman & Hall; 2009. pp. 1–359. [Google Scholar]
- 19.Dahlquist KD, Salomonis N, Vranizan K, Lawlor SC, Conklin BR. GenMAPP, a new tool for viewing and analyzing microarray data on biological pathways. Nat Genet. 2002;31:19–20. doi: 10.1038/ng0502-19. [DOI] [PubMed] [Google Scholar]
- 20.Ferrandon D, Jung AC, Criqui M, Lemaitre B, Uttenweiler-Joseph S, Michaut L, et al. A drosomycin-GFP reporter transgene reveals a local immune response in Drosophila that is not dependent on the Toll pathway. EMBO J. 1998;17:1217–1227. doi: 10.1093/emboj/17.5.1217. [DOI] [PMC free article] [PubMed] [Google Scholar]
- 21.Markowetz F, Troyanskaya OG. Computational identification of cellular networks and pathways. Mol Biosyst. 2007;3:478–482. doi: 10.1039/b617014p. [DOI] [PubMed] [Google Scholar]
- 22.Yan J, Yang X, Mortin MA, Shahabuddin M. Malaria sporozoite antigen-directed genome-wide response in transgenic Drosophila. Genesis. 2009;47:196–203. doi: 10.1002/dvg.20483. [DOI] [PubMed] [Google Scholar]


