

Abstract
A recent genome-wide analysis discovered an association between a haplotype (from rs317689/rs315135/rs7297610) on Chromosome 12q15 and blood pressure response to hydrochlorothiazide in African-Americans. Our aim was to replicate this association and investigate possible functional mechanisms. We observed similar associations between this haplotype and hydrochlorothiazide response in an independent sample of 746 Caucasians and African-Americans randomized to hydrochlorothiazide or atenolol treatment. The haplotype association was driven by variation at rs7297610, where C/C genotypes were associated with greater mean (systolic: 3.4mmHg, P=0.0275; diastolic: 2.5mmHg, P=0.0196) responses to hydrochlorothiazide vs. T-allele carriers. Such an association was absent in atenolol-treated participants, supporting this as hydrochlorothiazide-specific. Expression analyses in hydrochlorothiazide-treated African-Americans showed differential leukocyte YEATS4 expression between rs7297610 genotype groups at baseline (P=0.024), and reduced expression in C/C genotypes (P=0.009), but not in T-carriers. Our data confirm previous genome-wide findings at 12q15 and suggest differential YEATS4 expression could underpin rs7297610-associated HCTZ response variability, which may have future implications for guiding thiazide treatment.
Keywords: hydrochlorothiazide, hypertension, pharmacogenomics, blood pressure, YEATS4, diuretics
INTRODUCTION
Hydrochlorothiazide (HCTZ) is the most commonly prescribed antihypertensive in the United States, with nearly 118 million prescriptions dispensed in 2010, either alone or combined with another antihypertensive.1, 2 Current hypertension treatment guidelines also recommend thiazide diuretics as first-line treatment for most patients with uncomplicated essential hypertension, and strongly recommend these agents for all patients requiring two or greater antihypertensives for blood pressure control.3 Although thiazide and thiazide-like diuretics have been used in hypertension treatment for over 50 years, the mechanism by which they chronically lower blood pressure is incompletely understood.4, 5 In addition, patient response to thiazides varies widely, with differential responses between races.6, 7 However, even within race, variability of response exists.8 Due to the limited mechanistic understanding and wide variability of response, clinicians have difficulty predicting which patients will achieve satisfactory blood pressure response following thiazide treatment.
Recently, a genome-wide association study (GWAS) by Turner and colleagues showed an association between a locus at Chromosome 12q15 and blood pressure response to HCTZ in hypertensive African-Americans.9 A haplotype made up of three single nucleotide polymorphisms (SNPs), rs317689/rs315135/rs7297610 (Figure 1), was the most strongly associated, with the ATC haplotype correlating with good HCTZ response, and the ACT and ATT haplotypes correlating with a smaller blood pressure response.9 When single SNP analyses were done, the strongest single SNP association was with rs7297610.9
Figure 1.

Locus on Chromosome 12 containing SNPs with evidence of association with HCTZ blood pressure response in African-Americans. SNPs in bold composed a haplotype that associated in Turner, et. al.9 SNPs in italics associated with response in PEAR. Total region represented is approximately 260 kb.
Because this GWAS was the first to implicate 12q15 in thiazide response, and a plausible mechanistic association with blood pressure response was not readily apparent, replication is needed to confirm these associations before exploring their mechanistic underpinnings. Thus, our aim was to replicate these associations in a separate, but similar clinical population and explore the functional role of this variation.
METHODS
Study population
The Pharmacogenomic Evaluation of Antihypertensive Responses (PEAR) is a multi-center clinical trial examining the role of genetic variability on blood pressure response to HCTZ and/or atenolol (clinicaltrials.gov #NCT00246519).10 The study has been approved by the institutional review boards at each study site, and all subjects provided voluntary, written informed consent prior to screening. Hypertensive participants (clinic DBP from 90 mmHg to 110 mmHg) were enrolled from the University of Florida (Gainesville, FL, USA), Mayo Clinic (Rochester, MN, USA) and Emory University (Atlanta, GA, USA). Males and females of any race between the ages of 17 and 65 with essential hypertension were recruited to participate and randomized to either HCTZ or atenolol. After a four-week antihypertensive washout, participants were initially given HCTZ 12.5 mg daily or atenolol 50 mg daily, with most receiving a dose escalation to 25 mg and 100 mg, respectively for blood pressure greater than 120/70 mmHg after four weeks. After nine weeks, blood pressure response was assessed and, if blood pressure remained above 120/70 mmHg, the other study drug was added for another nine weeks. To assure a four-week washout sufficiently erased any blood pressure effects of previous antihypertensive treatments, we confirmed that post-washout blood pressure levels in participants who had previously received antihypertensives, were nearly identical to those who were had never received antihypertensive medication. Participants were not given sodium restrictions, but were counseled to maintain consistent dietary intakes. The primary response phenotype of PEAR was home blood pressure, which participants were required to take seated, in triplicate upon rising and before retiring with a provided blood pressure monitoring device (BP 3AC1-AP Monitor, Microlife USA, Dunedin, FL, USA) at least five of seven days prior to their blood pressure assessment visit. Blood was drawn before monotherapy, after monotherapy, and after treatment with both study drugs. The 746 Caucasian and African-American participants who completed at least the monotherapy stage of the study were included in this analysis.
Genotyping
Genomic DNA from the PEAR study was isolated from blood using the FlexiGene DNA Kit (QIAGEN Inc., Valencia, CA, USA) following the manufacturer’s protocol. Three SNPs (rs317689, rs315135, and rs7297610) composing the most strongly associated haplotype in the original GWAS9 were genotyped. Genotypes were determined by pyrosequencing using the PSQ HS 96 genotyping platform (Biotage AB, Uppsala Sweden). Approximately 40 ng of genomic DNA was used for polymerase chain reaction under the following conditions: a strand separation at 95°C for 15 min, then 40 cycles of denaturation at 95°C for 30 sec, annealing at 59°C for 30 sec, and extension at 72°C for 1 min, then one final extension at 72°C for 7 min. Genotypes were automatically called by PSQ HS 96 SNP software (Biotage AB, Uppsala, Sweden). Approximately 5% of participants were genotyped in duplicate to confirm call reliability, with an agreement of 98%. Genotypes for 48,539 other SNPs across Chromosome 12 were later determined in PEAR by HumanOmni1-Quad BeadChip (Illumina Inc., San Diego, CA, USA). Also to confirm call reliability, 0.7% of samples were run in on the BeadChip in duplicate, with a genome-wide agreement of greater than 99.9%.
Bioinformatics and linkage analysis
The UCSC Genome Browser (http://genome.ucsc.edu/) was used to visualize the chromosomal region around rs7297610 and view species conservation, as well as look for possible transcription factor binding sites or areas of histone acetylation sites that rs7297610 could disrupt. Further in silico functional predictions for rs7297610 were calculated using and the NIH SNPinfo Web Server (http://snpinfo.niehs.nih.gov/) and PupaSuite 2 (http://pupasuite.bioinfo.cipf.es/). Mechanisms explored involved effects on transcription factor binding sites, miRNA sequences, miRNA binding sites, conserved regions, and regulators of splicing. To measure linkage disequilibrium with rs7297610 in PEAR African-Americans, both r2 and D′ were calculated in 48,539 SNPs across Chromosome 12 using PLINK 1.07 (http://pngu.mgh.harvard.edu/purcell/plink/).11 SNPs with r2 ≥ 0.5 or D′ ≥ 0.5 were analyzed for association with HCTZ blood pressure response using PLINK.
Gene expression measurement
Expression of the nearest genes (LYZ, YEATS4 and FRS2) was measured in 24 PEAR African-American variant allele (T) carriers at rs7297610 and 24 race and sex-matched major allele (C) homozygotes. RNA was isolated from whole blood using the PAXgene Blood RNA Kit (PreAnalytiX GmbH, Hombrechtikon, Switzerland) and converted to cDNA. Measurement of gene expression was carried out via quantitative real-time RT-PCR using Taqman Gene Expression Assays and Taqman 7900HT Real Time PCR System (Applied Biosystems, Foster City, CA, USA). Expression levels were normalized using the housekeeping gene beta-2-microglobulin. Expression was calculated by the 2−ΔCt method.12
Statistical analysis
Hardy–Weinberg equilibrium was calculated separately by race using a chi-squared goodness-of-fit test with one degree of freedom. In PEAR, we replicated the method used by Turner and colleagues of comparing three-SNP haplotype frequencies in the 1/3 best and 1/3 worst Caucasian and 1/3 best and 1/3 worst African-American responders to HCTZ.9 Haplo.Stats (http://cran.r-project.org/web/packages/haplo.stats/) was used to estimate haplotype frequencies, as in the paper by Turner and colleagues.9 To be considered a replication, haplotype associations in PEAR were required to have a P ≤ 0.05 with effects in the same direction as those found previously.9 For single SNP analyses in PEAR, differences in systolic and diastolic blood pressure response across genotype were calculated separately by race using ANOVA, adjusting for baseline blood pressure, age, and gender. The eight SNPs from the BeadChip in linkage with rs7297610 were tested for association with HCTZ blood pressure response in PEAR African-Americans using linear regression, adjusting for baseline blood pressure, age, and gender. SNP associations with a Bonferroni-corrected P ≤ 0.00625 (for eight tests) were considered significant. In major allele homozygous African-Americans and variant carriers at rs7297610, a paired t-test was used to compare relative changes in LYZ, YEATS4 and FRS2 gene expression after HCTZ treatment, and an unpaired t-test was used to compare expression between genotype groups, both with P ≤ 0.05 considered significant. Statistical analyses in Chromosome 12 data from genome-wide arrays were conducted using PLINK 1.07 (Shaun Purcell, http://pngu.mgh.harvard.edu/purcell/plink/). All other statistical analyses were completed using SAS version 9.2 (SAS Institute, Cary, NC, USA).
RESULTS
Characteristics in the PEAR study population (Table 1), including gender and racial distributions, mean age, and mean baseline blood pressures were similar to those found in the original GWAS study population.13 All pyrosequencing genotype frequencies were in Hardy-Weinberg equilibrium (P-value range: 0.222–0.954) except rs317689 in African-Americans (P = 0.0006). Because of this possible discrepancy, all genotypes for this SNP were replaced with the calls from the genome-wide BeadChip when they later became available. Despite 98% concordance with the pyrosequencing genotypes, rs317689 genotypes from the BeadChip were well within Hardy-Weinberg Equilibrium (P = 0.770 in African-Americans), with similar genotype frequencies as those found in the ASW and YRI (African ancestry) and CEU (European ancestry) HapMap populations.
Table 1.
Baseline Characteristics of PEAR Participants.
| PEAR HCTZ | PEAR Atenolol | |
|---|---|---|
| N | 372 | 374 |
| Age (y) | 49.0 ± 9.3 | 48.7 ± 9.1 |
| Male (%) | 50.8 | 43.0 |
| Race (%) | ||
| Caucasian | 60.3 | 60.7 |
| African-American | 39.7 | 39.3 |
| BMI (kg/m2) | 30.8 ± 5.1 | 30.8 ± 5.9 |
| Mean Home BP | ||
| Systolic (mmHg) | 146.7 ± 10.7 | 145.0 ± 10.0 |
| Diastolic (mmHg) | 94.2 ± 6.0 | 93.2 ± 5.9 |
Values are listed as mean ± SD.
Haplotype analysis
Of the observed rs317689/rs315135/rs7297610 haplotypes in PEAR African-Americans, the ATT haplotype was significantly more frequent in poor responders than good responders to HCTZ (Table 2). This association was consistent with findings reported by Turner and colleagues.9 Directionally similar to the significant previous finding, the ATC haplotype was more frequent in good responders and the ACT haplotype was more frequent in poor responders, although these differences were not statistically significant in PEAR (Table 2). Also consistent with the previous GWAS, these associations were not observed in Caucasians.
Table 2.
Estimated frequencies of rs317689/rs315135/rs7297610 haplotypes in PEAR African-Americans by good or poor response to HCTZ.
| Response Category | ACT | ATT | ACC | GTC | ATC | GTT |
|---|---|---|---|---|---|---|
| Overall | 4.3 | 15.1 | 7.9 | 14.4 | 57.3 | 0.9 |
| Poor responders | 4.5 | 23.0 | 6.7 | 13.2 | 52.5 | 0 |
| Good responders | 4.3 | 7.8 | 8.9 | 16.2 | 61.6 | 1.1 |
| P | 0.740 | 0.010 | 0.610 | 0.492 | 0.333 | NA |
P-value adjusted for age, sex, and baseline blood pressure
Single SNP analysis
To determine which of the three SNPs were most strongly driving this haplotype association, we individually tested associations between rs317689, rs315135, and rs7297610 genotype and blood pressure response to HCTZ. Only rs7297610 was significantly associated with HCTZ response in African-Americans (Figure 2). Compared to C/C homozygotes, African-American T allele carriers treated with HCTZ experienced 3.4 mmHg less systolic (P = 0.0275) and 2.5 mmHg less diastolic blood pressure reduction (P = 0.0196). Neither rs317689, nor rs315135 possessed any significant associations with HCTZ response (P-value range: 0.331–0.889). To discern whether the association with rs7297610 was specific to HCTZ response, we tested for associations between rs7297610 genotype and blood pressure response to the beta-blocker atenolol in African-Americans, but found no relationship between genotype and atenolol response (Figure 2). Also, consistent with findings in the haplotype analysis, Caucasian HCTZ responses were not associated with rs317689, rs315135, or rs7297610 genotype.
Figure 2.
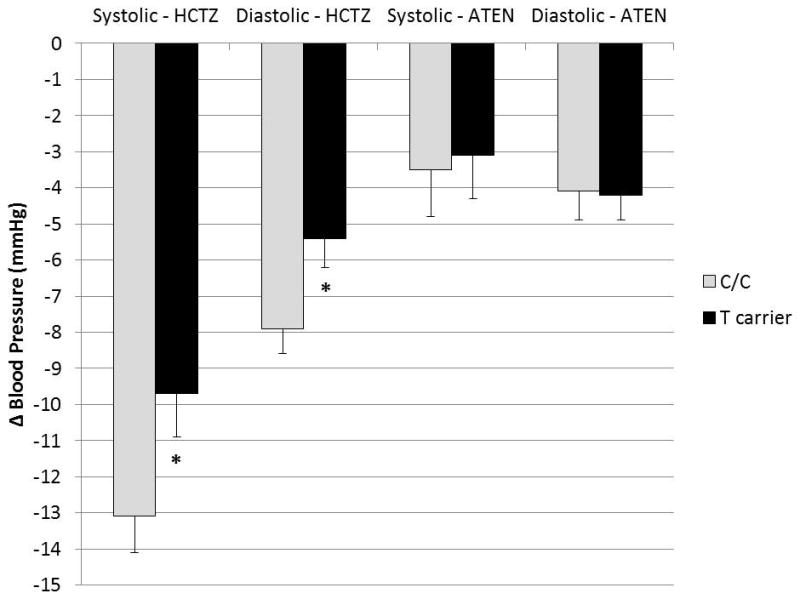
Blood pressure response to HCTZ and atenolol by rs7297610 genotype in PEAR African-Americans. Values are adjusted for age, sex, and baseline blood pressure. Error bars indicate standard error. * – P ≤ 0.05 compared to the common C/C genotype
In silico functional analysis
Rs7297610 occurs in a large intergenic region between YEATS domain containing 4 (YEATS4) and fibroblast growth factor receptor substrate 2 (FRS2), approximately 40 kb from each gene (Figure 1). Because the previous GWAS and this study both suggest rs7297610 has the strongest association with HCTZ response in African Americans, we investigated this SNP in silico to develop functional hypotheses for its association. When queried, UCSC Genome Browser, Pupasuite 2 and SNPinfo Web Server software were not able to predict any functional properties of rs7297610. UCSC Genome Browser did indicate that while the immediate region around rs7297610 is conserved in most primates, humans differ at the rs7297610 locus. The C allele is more common in humans, but the T allele is highly conserved in all other primates and in most mammals (Supplementary Figure 1).
Linkage on Chromosome 12
Because rs7297610’s association with HCTZ response was only observed in African-Americans, its intergenic location, and the fact that no function could be inferred in silico, we hypothesized rs7297610 was not a functional SNP. We therefore measured linkage with rs7297610 across Chromosome 12 in PEAR African Americans in an attempt to locate the functional SNP(s). Of the 48,541 SNPs available across Chromosome 12, only eight SNPs possessed an r2 or D′ of greater than 0.5 with rs7297610, and were all within a region of approximately 17kb (Table 3). When these eight SNPs were viewed using UCSC Genome Browser, three (rs17813347, rs931070, and rs17225223) occur in an area of high transcription factor binding and histone acetylation, suggesting they occur in a potential gene-regulating region. We then tested for associations between these eight SNPs and blood pressure response to HCTZ. None of the three SNPs in potential regulatory regions were significantly associated (P ≤ 0.00625) with HCTZ response in PEAR African-Americans (Table 3). Of the eight total SNPs, only rs10784780, and rs10878983 had statistically significant associations with similar magnitude and directional effect as rs7297610 (Table 3). In fact, the associations between rs10784780 (P = 0.002) and rs10878983 (P = 0.004) and HCTZ response were stronger in PEAR than observed with rs7297610 (P = 0.019). These two additional SNPs also have strong linkage disequilibrium (LD) between each other (r2 = 0.585, D′ = 0.878).
Table 3.
SNPs genotyped by Omni1-Quad array in moderate to high linkage with rs7297610 (italics) in PEAR African-Americans.
| SNP | Location on Chr. 12 | Co-inherited Allele | Allele Frequency | r2 | D′ | HCTZ DBP Lowering | P |
|---|---|---|---|---|---|---|---|
| rs7297610 | 69824024 | T | 0.284 | N/A | N/A | WORSE | 0.019 |
| rs7959850 | 69823594 | C | 0.792 | 0.358 | 0.735 | WORSE | 0.270 |
| rs10784780 | 69826029 | A | 0.544 | 0.298 | 0.947 | WORSE | 0.002 |
| rs10878983 | 69826093 | G | 0.611 | 0.241 | 0.978 | WORSE | 0.004 |
| rs732214 | 69815826 | C | 0.473 | 0.158 | 0.601 | WORSE | 0.604 |
| rs12367916 | 69818080 | C | 0.914 | 0.037 | 1 | WORSE | 0.229 |
| rs17813347 | 69810152 | T | 0.007 | 0.017 | 1 | BETTER | 0.221 |
| rs931070 | 69809449 | T | 0.964 | 0.015 | 0.999 | WORSE | 0.168 |
| rs17225223 | 69810208 | C | 0.964 | 0.015 | 0.999 | WORSE | 0.049 |
Chr. 12 – Chromosome 12; Co-inherited Allele – Allele co-inherited with with rs7297610 T allele; HCTZ DBP Lowering – Directional effect of diastolic blood pressure response to hydrochlorothiazide in patients with allele co-inherited allele, compared with the other allele for that SNP.
Gene expression
To provide mechanistic insight into the pharmacogenomic effect we observed in this gene region, we measured expression of the three nearest genes (LYZ, YEATS4 and FRS2) in 24 PEAR African-Americans with the common C/C genotype at rs7297610 and 23 T allele carriers (one sample failed RT-PCR). Compared to T-carriers, those with the C/C genotype (good responders to HCTZ) had an approximately 22% higher pre-treatment YEATS4 expression at baseline (P = 0.024, Figure 3A). After treatment with HCTZ, expression of YEATS4 decreased by 15% in those with the C/C genotype (P = 0.0088), but did not significantly change in T-carriers (Figure 3A). After HCTZ treatment, there were no differences in expression by rs7297610 genotype. In addition, no significant differences were observed with FRS2 and LYZ expression at baseline or following HCTZ treatment (Figure 3B and 3C). When LYZ, YEATS4 and FRS2 expression was compared in the 47 HCTZ-treated African-Americans by rs10784780 and rs10878983 genotype, no significant differences were observed (data not shown).
Figure 3.
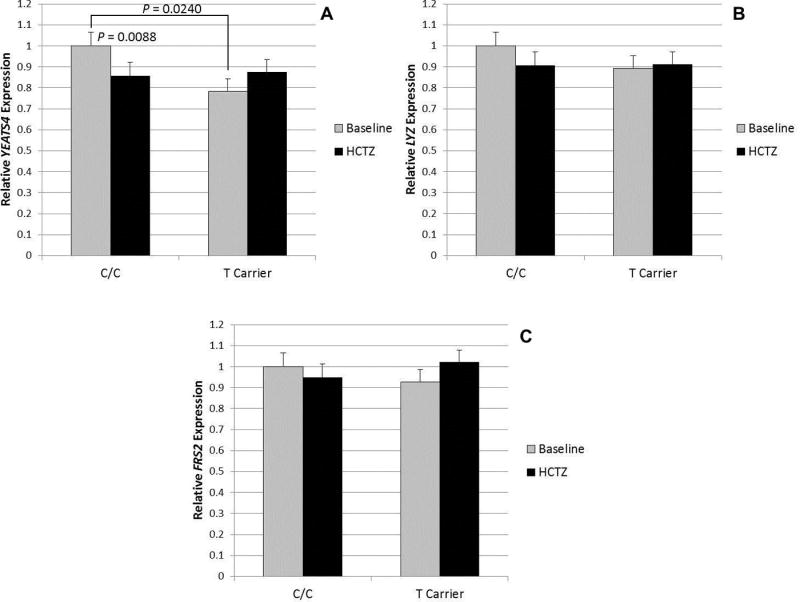
Relative gene expression of LYZ (A), YEATS4 (B), and FRS2 (C) by rs7297610 genotype in 47 African-American PEAR participants, normalized to the housekeeping gene beta-2-microglobulin. Error bars indicate standard error.
DISCUSSION
Herein, we provide the first known independent replication of a hypertension pharmacogenomic GWAS discovery, highlighting the utility of the GWAS to identify novel variants for antihypertensive response. Our findings also represent one of the few replicated GWAS examples in the pharmacogenomics literature for a gene not involved in drug metabolism or drug transport. Specifically, we replicated the associations between rs317689/rs315135/rs7297610 haplotypes and HCTZ response in African-Americans. These data demonstrate that African-Americans with the ATT haplotype are more likely to have a smaller blood pressure response to HCTZ compared with those without this haplotype. Haplotype associations seem to be driven by the third SNP in the haplotype, rs7297610. Our data show clinically significant differences in blood pressure response to HCTZ based on rs7297610 genotype, with a 3.4 mmHg difference in mean systolic and a 2.5 mmHg difference in mean diastolic blood pressure reduction between C/C and T-carrier genotype groups. We also present evidence demonstrating rs7297610 is not a universal predictor of blood pressure response to all antihypertensives, but rather a thiazide-specific response locus, as we found no association of this genotype in the response of African-Americans randomized to the beta-blocker atenolol. Further, we found YEATS4 expression significantly differs by rs7297610 genotype at baseline, and HCTZ treatment significantly decreases expression only in African-Americans with the C/C genotype.
Rs7297610 occurs in an intergenic region between YEATS domain-containing 4 (YEATS4) and fibroblast growth factor receptor substrate 2 (FRS2). In humans, the common C allele at rs7297610 varies from other mammals, which almost exclusively possess the T allele, indicating variation evolved recently in the human lineage. Also, because it is highly conserved in other species, this locus could have some yet unknown functional property. To develop a functional hypothesis for this SNP’s association with HCTZ response, we investigated possible functional mechanisms in silico, but found no explanation for this association. Because no functional prediction could be made and linkage analysis produced no functional candidates, we measured associations between rs7297610 genotype and expression of the three nearby genes (LYZ, YEATS4 and FRS2) in African-Americans treated with HCTZ. Interestingly, we found that baseline YEATS4 expression was associated rs7297610 genotype. Upon HCTZ treatment, YEATS4 expression significantly decreased in those with the C/C genotype, but T-carriers experience no significant change in expression. This association raises the possibility that differential expression of YEATS4 may be involved in the greater blood pressure response to HCTZ seen in the rs7297610 C/C genotype. However, further research is needed to verify if this is the case, as the mechanism by which rs7297610 could affect YEATS4 expression and HCTZ blood pressure response remain unclear at this time.
Our strongest hypothesis on why this SNP associates with variability in response to HCTZ is that rs7297610 tags another (or many rare), functional SNP(s). The two major reasons for this hypothesis are: (1) the blood pressure response to HCTZ was only observed in African-Americans and not Caucasians, and (2) the intergenic location of rs7297610 is not in any known coding or regulatory region of the genome. The original GWAS conducted by Turner and colleagues genotyped approximately 100,000 SNPs across the genome. Further, fine mapping analyses done by Turner and colleagues were only completed within the LYZ, YEATS4 and FRS genes. So when nearly 1.1 million genotypes became available on each PEAR participant, a comprehensive linkage analysis could be completed in hopes of finding the functional SNP(s) in LD with rs7297610. When we measured linkage across Chromosome 12, we found two SNPs (rs10784780 and rs10878983) that were in high LD with rs7297610 and more strongly associated with HCTZ response. However, we found no association between rs10784780 or rs10878983 genotype and LYZ, YEATS4 or FRS2 expression changes after HCTZ treatment. These two SNPs also exist in the same intergenic region as the nearby rs7297610, with no known mechanism for gene regulation. Thus, rs10784780 and rs10878983 simply appear to be better tagSNPs for some still undiscovered polymorphism(s). Further sequencing of the Chromosome 12q15 region in a large number of HCTZ-treated hypertensives may discover the functional SNP(s) responsible for our observed associations with HCTZ response.
YEATS4 encodes the protein GAS41, which knock-out studies have shown is essential for RNA transcription and cell viability.14 As with other YEATS domain-containing proteins, GAS41 plays a role in chromatin-modification and transcription, which may involve recognition of chromatin targets and recruiting modification complexes to affect transcription.15 While no reference was found in the literature connecting GAS41 with cardiovascular function, this protein has been implicated in mixed lineage leukemia (MLL), and is required for repressing the p53 repressor pathway during normal cellular proliferation.16 Whether GAS41’s effect on proliferation could play a role in hypertension-associated renal cell proliferation is unknown. However, this could be a potential mechanism where YEATS4 could affect response to the diuretic HCTZ, which acts in the renal tubules. Further studies are needed to clarify if and how GAS41 impacts blood pressure homeostasis and HCTZ response.
The similarity in size and patient characteristics between PEAR and the previous GWAS population was a major strength in our validation effort, and thus, we predicted we would detect similar associations to those found previously, if the associations were real. A limitation to this study is that RNA expression profiles taken from whole blood may not be relevant to assess HCTZ response at the site of action. However, cells from the two primary hypothesized sites of HCTZ action, the kidney and the vasculature, are difficult to obtain from humans, and HCTZ was previously shown to be pharmacologically active in peripheral blood mononuclear cells.17, 18
To conclude, we report the first known validation of an antihypertensive pharmacogenomic GWAS, confirming a pharmacogenomic effect of rs7297610 on HCTZ blood pressure response in African-Americans. Further, our data demonstrate this is an HCTZ-specific effect, and suggest variation at rs7297610 is associated with differential YEATS4 expression. Whether these expression differences play a role in the diminished blood pressure response we observed with HCTZ treatment remains unknown. If they do, this pathway could explain some amount of HCTZ response variability. However, YEATS4 has not previously been linked to cardiovascular function or thiazide effect, so additional research is needed to elucidate the functional role of rs7297610, as well as the potential role of YEATS4 in blood pressure response to HCTZ.
Supplementary Material
Species conservation at the rs7297610 locus. Black box indicates conserved base, gray block indicates nonconserved base, and white block indicates missing base. Created using UCSC Genome Browser (http://genome.ucsc.edu/).
Acknowledgments
This work was supported by a grant from the National Institutes of Health (Bethesda, MD), U01 GM074492, funded as part of the Pharmacogenomics Research Network. This work is also supported by the following grants from the NIH National Center for Research Resources: grant M01 RR00082 and UL1 RR029890 to the University of Florida, grants UL1 RR025008 and M01 RR00039 to Emory University, and UL1 RR024150 to Mayo Clinic. Support was also provided by and K23 HL086558 (R.M.C), K23 HL091120 (A.L.B.), and T32 DK007518 (J.D.D).
The authors are thankful for the technical assistance of Zhiying Wang and Lynda Stauffer. The authors acknowledge and thank the valuable contributions of the study participants, support staff, and study physicians.
Footnotes
CONFLICT OF INTEREST
The authors declare no conflict of interest.
Supplementary information is available at The Pharmacogenomics Journal’s website.
References
- 1.2010 Top 200 generic drugs by total prescriptions. Drug Topics [Google Scholar]
- 2.2010 Top 200 branded drugs by total prescriptions. Drug Topics [Google Scholar]
- 3.Chobanian AV, Bakris GL, Black HR, Cushman WC, Green LA, Izzo JL, Jr, et al. Seventh report of the Joint National Committee on Prevention, Detection, Evaluation, and Treatment of High Blood Pressure. Hypertension. 2003;42(6):1206–1252. doi: 10.1161/01.HYP.0000107251.49515.c2. [DOI] [PubMed] [Google Scholar]
- 4.Duarte JD, Cooper-DeHoff RM. Mechanisms for blood pressure lowering and metabolic effects of thiazide and thiazide-like diuretics. Expert Rev Cardiovasc Ther. 2010;8(6):793–802. doi: 10.1586/erc.10.27. [DOI] [PMC free article] [PubMed] [Google Scholar]
- 5.Carter BL, Einhorn PT, Brands M, He J, Cutler JA, Whelton PK, et al. Thiazide-induced dysglycemia: call for research from a working group from the national heart, lung, and blood institute. Hypertension. 2008;52(1):30–36. doi: 10.1161/HYPERTENSIONAHA.108.114389. [DOI] [PubMed] [Google Scholar]
- 6.Materson BJ. Variability in response to antihypertensive drugs. Am J Med. 2007;120(4 Suppl 1):S10–20. doi: 10.1016/j.amjmed.2007.02.003. [DOI] [PubMed] [Google Scholar]
- 7.Johnson JA, Gong Y, Bailey KR, Cooper-DeHoff RM, Chapman AB, Turner ST, et al. Hydrochlorothiazide and atenolol combination antihypertensive therapy: effects of drug initiation order. Clin Pharmacol Ther. 2009;86(5):533–539. doi: 10.1038/clpt.2009.101. [DOI] [PMC free article] [PubMed] [Google Scholar]
- 8.Comparison of propranolol and hydrochlorothiazide for the initial treatment of hypertension. II. Results of long-term therapy. Veterans Administration Cooperative Study Group on Antihypertensive Agents . JAMA. 1982;248(16):2004–2011. [PubMed] [Google Scholar]
- 9.Turner ST, Bailey KR, Fridley BL, Chapman AB, Schwartz GL, Chai HS, et al. Genomic association analysis suggests chromosome 12 locus influencing antihypertensive response to thiazide diuretic. Hypertension. 2008;52(2):359–365. doi: 10.1161/HYPERTENSIONAHA.107.104273. [DOI] [PMC free article] [PubMed] [Google Scholar]
- 10.Johnson JA, Boerwinkle E, Zineh I, Chapman AB, Bailey K, Cooper-DeHoff RM, et al. Pharmacogenomics of antihypertensive drugs: rationale and design of the Pharmacogenomic Evaluation of Antihypertensive Responses (PEAR) study. Am Heart J. 2009;157(3):442–449. doi: 10.1016/j.ahj.2008.11.018. [DOI] [PMC free article] [PubMed] [Google Scholar]
- 11.Purcell S, Neale B, Todd-Brown K, Thomas L, Ferreira MA, Bender D, et al. PLINK: a tool set for whole-genome association and population-based linkage analyses. Am J Hum Genet. 2007;81(3):559–575. doi: 10.1086/519795. [DOI] [PMC free article] [PubMed] [Google Scholar]
- 12.Livak KJ, Schmittgen TD. Analysis of relative gene expression data using real-time quantitative PCR and the 2(−Delta Delta C(T)) Method. Methods. 2001;25(4):402–408. doi: 10.1006/meth.2001.1262. [DOI] [PubMed] [Google Scholar]
- 13.Chapman AB, Schwartz GL, Boerwinkle E, Turner ST. Predictors of antihypertensive response to a standard dose of hydrochlorothiazide for essential hypertension. Kidney Int. 2002;61(3):1047–1055. doi: 10.1046/j.1523-1755.2002.00200.x. [DOI] [PubMed] [Google Scholar]
- 14.Zimmermann K, Ahrens K, Matthes S, Buerstedde JM, Stratling WH, Phivan L. Targeted disruption of the GAS41 gene encoding a putative transcription factor indicates that GAS41 is essential for cell viability. J Biol Chem. 2002;277(21):18626–18631. doi: 10.1074/jbc.M200572200. [DOI] [PubMed] [Google Scholar]
- 15.Schulze JM, Wang AY, Kobor MS. YEATS domain proteins: a diverse family with many links to chromatin modification and transcription. Biochemistry and cell biology = Biochimie et biologie cellulaire. 2009;87(1):65–75. doi: 10.1139/O08-111. [DOI] [PubMed] [Google Scholar]
- 16.Park JH, Roeder RG. GAS41 is required for repression of the p53 tumor suppressor pathway during normal cellular proliferation. Molecular and cellular biology. 2006;26(11):4006–4016. doi: 10.1128/MCB.02185-05. [DOI] [PMC free article] [PubMed] [Google Scholar]
- 17.Abuladze N, Yanagawa N, Lee I, Jo OD, Newman D, Hwang J, et al. Peripheral blood mononuclear cells express mutated NCCT mRNA in Gitelman’s syndrome: evidence for abnormal thiazide-sensitive NaCl cotransport. Journal of the American Society of Nephrology: JASN. 1998;9(5):819–826. doi: 10.1681/ASN.V95819. [DOI] [PubMed] [Google Scholar]
- 18.Abraham AS, Brooks BA, Grafstein Y, Barchilon E, Nubani N, Eylath U, et al. Effects of hydrochlorothiazide, diltiazem and enalapril on mononuclear cell sodium and magnesium levels in systemic hypertension. The American journal of cardiology. 1991;68(13):1357–1361. doi: 10.1016/0002-9149(91)90245-g. [DOI] [PubMed] [Google Scholar]
Associated Data
This section collects any data citations, data availability statements, or supplementary materials included in this article.
Supplementary Materials
Species conservation at the rs7297610 locus. Black box indicates conserved base, gray block indicates nonconserved base, and white block indicates missing base. Created using UCSC Genome Browser (http://genome.ucsc.edu/).