

Abstract
Background
Multiple sclerosis (MS) and neuromyelitis optica (NMO) both affect spinal cord with notable differences in pathology.
Objective
Determine the utility of diffusion tensor imaging (DTI) to differentiate the spinal cord lesions of NMO from MS within and outside T2 lesions.
Methods
Subjects ≥12 months from a clinical episode of transverse myelitis underwent a novel transaxial cervical spinal cord DTI sequence. Ten subjects with NMO, 10 with MS, and 10 healthy controls were included.
Results
Within T2 affected white matter regions, radial diffusivity was increased in both NMO and MS compared to healthy controls (p<0.001, respectively), and to a greater extent in NMO than MS (p<0.001). Axial diffusivity was decreased in T2 lesions in both NMO and MS compared to controls (p<0.001, p=0.001), but did not differ between the two diseases. Radial diffusivity and FA within white matter regions upstream and downstream of T2 lesions were different from controls in each disease.
Conclusions
Higher radial diffusivity, within spinal cord white matter tracts derived from diffusion tensor imaging were appreciated in NMO compared to MS, consistent with the known greater tissue destruction seen in NMO. DTI also detected tissue alterations outside T2 lesions, and may be a surrogate of anterograde and retrograde degeneration.
Keywords: diffusion tensor imaging, neuromyelitis optica (NMO), multiple sclerosis (MS), spinal cord, MRI
Introduction
Neuromyelitis optica (NMO) is an inflammatory disorder affecting spinal cord and optic nerves, often resulting in greater disability compared to multiple sclerosis (MS).1 The pathology of NMO is ascribed to an autoimmune process directed at the aquaporin 4 water channel expressed by astrocytes, and is highlighted by inflammation, demyelination, necrosis and axonal damage.2–4 Compared to MS, conventional imaging of the spinal cord in NMO exhibits greater longitudinal extension, T1 hypointensities, and central gray matter involvement.5–7 While these imaging characteristics can help with diagnosis, conventional magnetic resonance (MR) sequences convey limited information on the degree of tissue destruction for either disease.
Diffusion tensor imaging (DTI) is a high resolution, quantitative, and continuous measure of tissue integrity that holds potential for evaluating spinal cord injury in demyelinating and other white matter diseases.8 Diffusion parallel to axons is termed axial diffusivity (AD, also known as λ1, or λ||).9 Diffusion perpendicular to axons is termed radial diffusivity (RD, also known as (λ2+λ3)/2 or λ⊥).9 In studies of experimental autoimmune encephalomyelitis-affected mouse spinal cords, AD and RD correlated with axonal injury and demyelination, respectively.9–11 In humans, elevated RD was associated with greater tissue injury in MS brain lesions, and worse clinical outcomes in optic nerves affected by chronic optic neuritis.12, 13
We hypothesized that because of the more destructive nature and high degree of axonal involvement of the NMO lesion, DTI would differentiate the two disorders, even after adjusting for clinical disability.14 Building upon our prior experience imaging optic nerve, a combination of technical considerations has yielded a reproducible imaging protocol for the cervical spinal cord at the tract level.
Material and Methods
Standard Protocol Approvals, Registrations, and Patient Consents
Informed consent was obtained from all subjects under the Washington University Human Research Protection Office.
Subjects
Thirty subjects were equally divided among NMO, MS, and healthy control categories in this case control design. Each NMO and MS subject met inclusion criteria for a history of transverse myelitis (TM) greater than 12 months prior to study entry. All subjects had evidence of cervical myelitis on clinical imaging and symptoms referable to the upper extremities. Neuromyelitis optica subjects met diagnostic criteria for NMO or NMO spectrum disorder.15 All MS subjects met McDonald diagnostic criteria.16
Image Acquisition
Magnetic resonance images were acquired on a 3 Tesla scanner (TIM Trio, Siemens, Erlangen, Germany) using a 4-element (custom-fabricated) or a 2-element (neck posterior, vendor supplied) phased array receiver coil, depending on patient’s body shape around the neck for optimal receive field penetration and signal-to-noise (SNR) ratio. A previously described reduced field-of-view (FOV) single shot-SE-EPI sequence for optic nerve diffusion imaging17 was optimized with gradient moment nulling in the slice-selective direction to reduce cerebral spinal fluid (CSF) flow artifacts. Slice-selective gradients for the excitation pulse were velocity compensated and the spoiler gradients straddling the two refocusing pulses were removed in the slice-selective direction. Transaxial images were acquired (FOV 72 × 28.8 mm, matrix 80 × 32, resolution 0.9 × 0.9 mm, slice thickness 5 mm, and TR/TE ~ 5000/99 ms) on 3 separate slice groups spanning two vertebral segments (C1–2, C3–4, and C5–6), each consisting of 6 slices (Figure 1). Shimming volume was restricted to the spinal cord in both sagittal and coronal views. After automatic field-map based shimming, the line width was further optimized (FWHM < 45 Hz) by interactive adjustment. Each slice acquisition started with ~250–300 ms delay18 after the rise of the sphygmic wave measured with a peripheral pulse oximeter. Twenty-five diffusion weighted (DW) images with b values between 416–800 s/mm2 (bmean = 600 s/mm2) had randomly distributed gradient directions that uniformly covered the two polar angles in spherical coordinates.19, 20 Four repetitions including balanced acquisitions with opposite gradient polarity were averaged to increase SNR. Acquisition time per slice group was 8–10 min. For lesion identification, additional sequences included sagittal T2W (2D fast spin-echo with driven equilibrium magnetization restoration, FOV 240 × 240 mm, matrix 320 × 240, resolution 0.8 × 1.0 mm, slice thickness 2 mm, TR/TE 3300/107 ms, turbo factor 31, and flow compensation in readout direction), sagittal STIR (2D fast spin-echo, FOV 240 × 240 mm, matrix 320 × 240, resolution 0.8 × 1.0 mm, slice thickness 2 mm, TR/TE/TI 5130/57/200 ms, and turbo factor 9), and axial MEDIC (multi-echo gradient echo with flow compensation and magnetization transfer contrast enhancement, FOV 150 × 150 mm, matrix 192 × 192, resolution 0.8 × 0.8 mm, slice thickness 3 mm, TR/TE 670/9.9 ms, flip angle 30°, bandwidth 449 Hz/pixel, and combined echoes 4) aligned with each DTI slice group.
Figure 1. Spinal cord DTI acquisition.
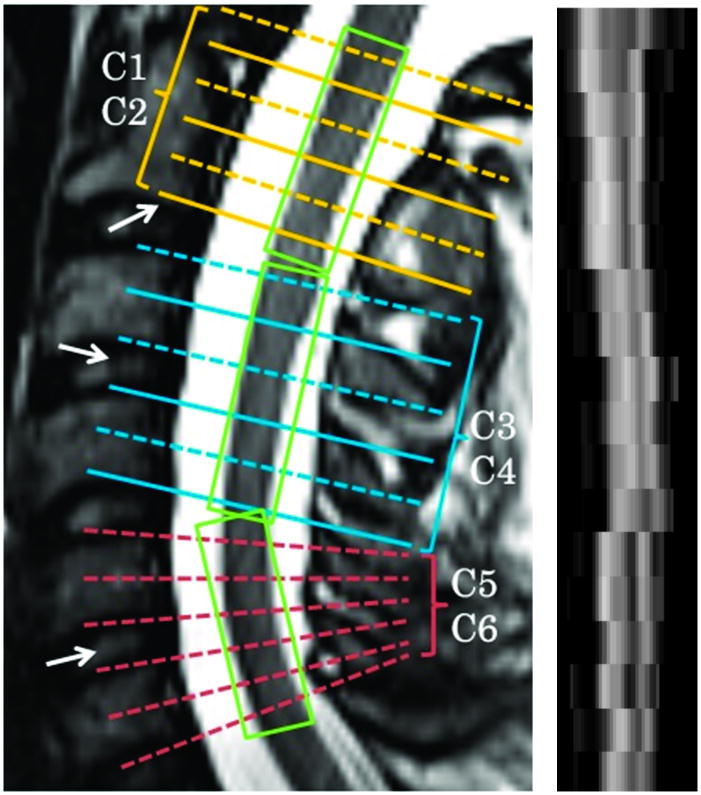
Left Panel. Spinal cord DTI was acquired in three segments, each spanning two vertebral levels and representing six slices. Alignment was oriented according to vertebral bodies and disc spaces (arrows) to ensure standization. The center of the last slice of C2 was aligned with the end of the 2nd vertebra, while the center of the 2nd and 3rd slice groups were aligned with the intervertebral discs between the adjacent vertebra. Furthermore, slices could be individually tilted within the slice group to be parallel to the cross-section of the cord. Right panel. A sagittal reformatted FA image demonstrates clear GM-WM contrast and anatomical representation of corticospinal tract and dorsal column from C1 to C6. An increasing degree of blurring and misalignment appeared when moving caudally from C1 to C6 because of increasing physiological movement (breathing, etc).
Data Analysis
A 3D affine registration restricted to in-plane translation was used for motion correction.21 An iterative approach was used to first align DW images to the preceding b0 image. The interspersed b0 images were aligned to the first b0 image and between averages. Slices with excessive motion beyond correction were removed from analysis. The first slice at the level of C1 was excluded to avoid crossing fibers. Diffusion tensor imaging was fitted with a non-negative nonlinear Levenberg-Marquardt algorithm. Following tensor diagonalization, DTI parameter maps were obtained by standard procedures.22 Final outputs were re-sampled resulting in voxels of 0.45 × 0.45 × 5 mm3.
Cord Segmentation
An objective procedure based upon the cord outline on b0 and fractional anisotropy (FA) maps was utilized to identify standard regions of interest (ROIs) for the posterior columns, lateral corticospinal tracts and central gray matter using fslview (www.fmrib.ox.ac.uk/fsl/fslview) (Figure 2).23 Axial MEDIC (multiple-echo data image combination) in conjunction with sagittal T2W and STIR (short T1 inversion recovery) images were inspected (EK and JX) for T2 hyperintensity within individual ROIs for each slice within the cervical cord. Based on these analyses, regions within white matter tracts were coded as “upstream”, “T2 involved”, or “downstream” depending on their relationship to T2 lesion (Figure 3). Posterior columns were oriented from rostral to caudal; corticospinal tracts were caudal to rostral. Areas between lesions were designated as downsteam. If no T2 hyperintensity was appreciated at any level of a particular tract in the cervical spinal cord region, the ROIs in that tract were coded as “unaffected”. Gray matter ROIs were coded as “T2 involved” or “T2 uninvolved”.
Figure 2. Standard ROIs.
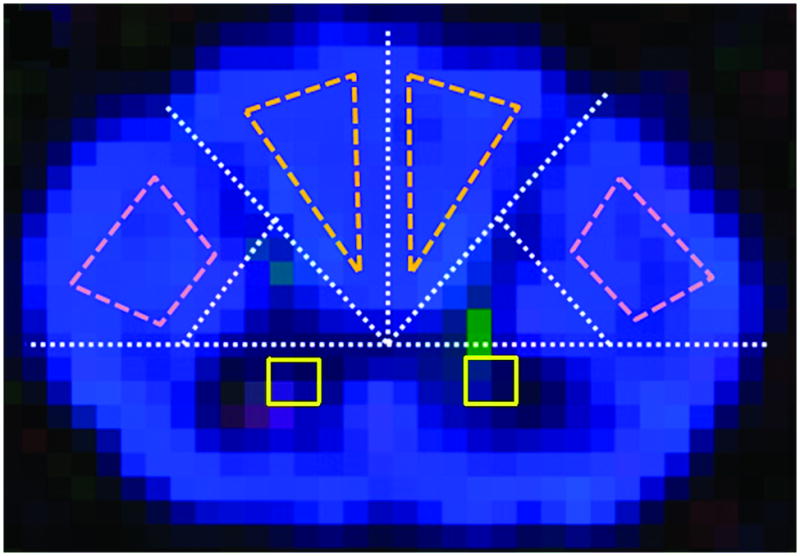
Within the axial plane, spinal cord dimensions were used to plot two white matter ROIs in the posterior columns, two white matter ROIs in the corticospinal tracts, and two central gray matter ROIs. The axial cord was separated into four quadrants by transverse and anterior-posterior lines intersecting at the central canal. The posterior spinal cord was further divided into four quadrants. A line joining the midpoints of the boundaries of the two lateral quadrants excluded central gray matter regions. ROIs of spinal cord tracts were defined in the remaining areas. For tracts, edge voxels were excluded to ensure the ROI was within white matter and to eliminate contamination by CSF. Two by two voxel gray matter ROIs were placed immediately anterior to the long axis of the cord, each located three voxels lateral to the short central axis of the cord.
Figure 3. Lesion location encoding.
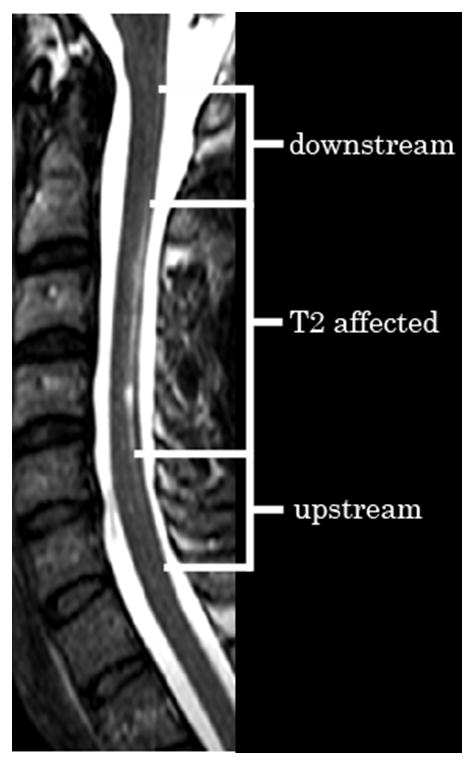
This axial T2 weighted image in a subject with NMO illustrates a longitudinally extensive lesion confined to the spinal cord dorsal white matter. Within the sensory posterior column, areas are labeled upstream of the lesion, T2 affected and downstream of the lesion.
Signal-to-noise ratio (SNR) analysis
Diffusion tensor imaging parameters were plotted against SNR to determine threshold levels for their dependence upon SNR.24, 25 When SNR was ≥20, no correlation was found between SNR and DTI parameters. Below, an SNR of 20, AD correlated with SNR. Thus, ROIs with SNR < 20 (<5% of all ROIs) were excluded from analysis. Excluded ROIs were found in similar low proportions in NMO (3.7%) and MS subjects (5.8%).
Clinical testing
Clinical data regarding the prior episode of TM was obtained from chart review. All subjects prospectively underwent the Expanded Disability Status Scale (EDSS) examination by one of two certified examiners (ECK and AHC) blinded to the DTI results.
Statistical Analysis
Distributions of DTI parameters were transformed to approximate a Gaussian distribution suitable for linear mixed modeling. Diffusion tensor imaging parameters were compared between subject groups (NMO, MS, and controls) and by location relative to T2 lesion using linear mixed modeling with appropriate covariance structures. Least squared difference contrasts were used between groups, with significance determined at the p<0.05 level. A Bonferroni correction was applied for multiple comparisons for lesion location analysis. Disability (EDSS) was compared between MS and NMO using the Mann-Whitney U test. Statistical analyses utilized Statistical Package for the Social Sciences version 16 (SPSS, Chicago, IL).
Results
Demographics
Subject demographics and clinical characteristics are presented in Table 1. The NMO group displayed a trend towards greater disability than MS (median EDSS 3.5 vs. 2.0, p=0.19). Disease duration was longer in MS compared to NMO (p=0.01), but there were no differences in time from last relapse (p=0.17) between the two diseases.
Table 1.
Subject Demographics and Clinical Characteristics.
| Control (n=10) | MS (n=10) | NMO (n=10) | |
|---|---|---|---|
|
| |||
| Age (yrs) | 30.5 (19–70) | 36.5 (32–55) | 40 (25–62) |
|
| |||
| Gender | F=5 | F=8 | F=9 |
| M=5 | M=2 | M=1 | |
|
| |||
| Ethnicity | C=5 | C=9 | C=5 |
| AA=1 | AA=1 | AA=5 | |
| A=4 | |||
|
| |||
| Disease Duration (yrs) | N/A | 6.5 (1.0–16.0) | 1.8 (1.0–6.7) |
|
| |||
| Time from last relapse (yrs) | N/A | 2.8 (1.0–4.3) | 1.3 (1.0–6.7) |
|
| |||
| Median EDSS | 0.0 | 2.0 (1.0–8.0) | 3.5 (1.5–8.0) |
|
| |||
| Brainstem T2 involvement* | N/A | 1 of 9 | 4 of 9 |
|
| |||
| Thoracic T2 involvement** | N/A | 2 of 5 | 5 of 6 |
F=female; M=male; C=Caucasian; AA=African American; A=Asian;
Age, disease duration, time from last relapse and EDSS are all expressed in median which best express central tendencies. Of the MS subjects, 9 had relapsing remitting (RRMS) and 1 had secondary progressive MS (SPMS). Seven of 10 NMO subjects were NMO IgG antibody positive.
Clinical brain MRI was not available in one MS subject and one NMO subject.
Clinical thoracic spine MRI was not available in 5 MS subjects and 4 NMO subjects.
Radial diffusivity within T2 lesions differentiated NMO and MS
Radial diffusivity was increased in both NMO (p<0.001) and MS (p<0.001) lesions compared to controls, and in NMO compared to MS (p<0.001) (Table 2, Figure 4). Axial diffusivity was decreased in both NMO (p<0.001) and MS (p=0.001) lesions compared to controls, with a trend toward lower values in NMO lesions (p=0.086). As expected, both FA and mean diffusivity (MD) indicated greater tissue injury within lesions compared to control cords. Fractional anisotropy and MD were also more significantly altered in NMO compared to MS lesions. When EDSS, disease duration, and time from last relapse were added to the model, differences remained between NMO and MS for RD (p=0.002), and FA (p<0.001) while MD (0.159) and AD (0.154) were not significant.
Table 2.
DTI Values of White Matter ROIs. MS and NMO values represent ROIs that were affected by T2 lesion.
| DTI parameter | Controls | MS | NMO |
|---|---|---|---|
| Radial Diffusivity (μm2/ms) | 0.28 (0.26, 0.29) | 0.40 (0.38, 0.43) | 0.49 (0.46, 0.52) |
| Axial Diffusivity (μm2/ms) | 1.84 (1.81, 1.86) | 1.76 (1.73, 1.80) | 1.72 (1.68, 1.75) |
| Mean Diffusivity (μm2/ms) | 0.80 (0.78, 0.82) | 0.85 (0.83, 0.88) | 0.90 (0.88, 0.92) |
| Fractional Anisotropy | 0.83 (0.81, 0.85) | 0.75 (0.72, 0.78) | 0.66 (0.62, 0.70) |
Mean values with 95% confidence intervals in parenthesis.
Figure 4. DTI parameters by disease group.

Mean DTI parameters [radial diffusivity (A), axial diffusivity (B), fractional anisotropy (C), and mean diffusivity (D)] are displayed for controls, MS (within T2 lesions) and NMO (within T2 lesions). Mean values are surrounded by 95% confidence intervals (CIs). Groups are compared with representative p values.
DTI Changes were Detected in Areas Upstream and Downstream of T2 lesions in Both NMO and MS
Tracts at each level in the cord were categorized as “T2 affected”, “upstream,” “downstream”, or “unaffected”. In both diseases, increased RD (p<0.001 in each) and decreased FA (p<0.001 in each) were appreciated in areas upstream and downstream from T2 lesions compared to control values, but as expected, to a lesser degree than within T2 lesions (Figure 5). Differences between the two diseases, controlling for EDSS, disease duration, and time from last relapse, included larger decreases in AD in downstream regions (1.674 μm2/ms versus 1.766 μm2/ms in MS, p=0.028) and larger decreases in FA in upstream regions (0.740 versus 0.776, p=0.016) and downstream regions (0.748 versus 0.780, p<0.001) in NMO compared to MS. Axial diffusivity was decreased in upstream and downstream areas in NMO and in upstream areas in MS compared to controls (p<0.001 for NMO; upstream p=0.004, downstream p=0.071 for MS), but AD did not distinguish between up- and downstream tracts and T2 hyperintense regions for either MS or NMO. Mean diffusivity did not differentiate upstream and downstream areas in either disease from controls, because increases in RD and decreases in AD offset one another. To determine whether degeneration distal to the lesion was greater than proximal degeneration, downstream versus upstream areas were compared but no DTI parameter distinguished these two designations for either disease.
Figure 5. DTI parameters by ROI location.

Each DTI parameter [radial diffusivity (A), axial diffusivity (B), fractional anisotropy (C), and mean diffusivity (D)] is plotted with respect to location with respect to T2 lesion (unaffected, upstream, T2 affected, or downstream). Control mean (solid line) surrounded by its 95% CI (dashed lines) are displayed. MS (blue boxes) and NMO (red triangles) means with 95% CIs are displayed at each location.
“Unaffected” tracts in MS subjects were frequently abnormal, with increased RD and decreased FA compared to controls (p<0.001 for each). In contrast, unaffected tracts in NMO were not different from controls (Figure 5).
Diffusion Imaging in Gray Matter Did Not Differentiate NMO and MS
Mean diffusivity within T2-affected gray matter was increased for MS (0.854 μm2/ms [95% CI: 0.809, 0.899], p<0.001) and NMO (0.894 μm2/ms [0.861, 0.927], p<0.001) compared with gray matter ROIs for controls (0.758 μm2/ms [0.733, 0.782]); Gray matter FA was decreased within T2 lesions in MS (0.362 [0.330, 0.394], p=0.006) and trended toward a decrease in NMO (0.387 [0.365, 0.409], p=0.07) compared to controls (0.412 [0.396, 0.428]). Both gray matter MD and FA failed to differentiate MS from NMO (p=0.16; p=0.21). For unaffected gray matter regions based on no increased T2 signal, abnormalities in FA or MD were not observed.
Discussion
An imaging method that can indicate the underlying pathology is greatly needed for the central nervous system, where tissue biopsies carry special risks. Using a standardized image analysis with unbiased segmentation of individual white matter tracts and gray matter, on a slice-by-slice basis, this study demonstrated that several DTI parameters can differentiate the more destructive nature of the NMO lesion from MS, even upon controlling for disability. Thus, this study further established that DTI is capable of discriminating the severity of pathology. Furthermore, not only could DTI differentiate T2-affected lesions in both diseases from controls, but RD, AD and FA were abnormal within normal appearing (T2 isointense) tracts upstream and downstream from T2 lesions. This latter finding suggested that DTI parameters can also detect anterograde and retrograde tissue alterations within white matter tracts.
Specificity of DTI parameters to pathology
Previous studies using DTI in animal models, verified by histopathology, indicated that myelin damage results in increased RD, and that axonal damage is associated with a decrease in AD within white matter tracts.10, 11 This association between RD and degree of myelin integrity is further supported by a histopathology correlation study in human MS spinal cord.26 Thus, abnormally increased RD in spinal cord tracts in MS and NMO is consistent with myelin damage; and the greater increase in RD observed in NMO may be consistent with marked loss of myelin, a variable finding in NMO in published post-mortem studies.27 The pathology of NMO is also notable for necrosis within lesions, sometimes leading to cavitation.4 Necrosis is typically absent from MS pathology in the spinal cord. Thus, the larger deviation from normal values in all DTI parameters in NMO lesions compared with MS is consistent with the more injurious pathology, such as necrosis, in NMO. In fully necrotic lesions, AD would be expected to increase as demonstrated in an animal model of spinal cord injury.28 In this study, AD was decreased in both MS and NMO, consistent with the known axonal injury in each, but was different between the two diseases only in downstream regions.11 It is possible that overall decreases in AD, which may be attributable to axonal injury, were underestimated in NMO due to increases in AD in some tracts with necrosis.
Assessment of normal appearing white matter tracts
The high in-plane resolution in the present study allowed the dissection of T2 lesioned tracts from normal appearing tracts. With analyses of individual tracts, downstream vs. upstream regions relative to lesions could be individually analyzed. One novel finding was the change in DTI parameters in spinal cord tracts both upstream and downstream of lesions observed on T2 MRI. This was seen in both MS and NMO. These changes may reflect disease pathology unrelated to the observed T2 lesions (often termed “normal appearing white matter”), or the effects of Wallerian degeneration and retrograde axonal degeneration, or a combination.29
Interestingly, spinal cord tracts devoid of lesions based on the absence of T2 hyperintensity at any level in the cervical spinal cord were often abnormal in MS, but not in NMO. These tracts, labeled “unaffected” in this study, demonstrated abnormally increased RD and decreased FA in MS but not NMO. This finding suggests that in MS, lesions that cannot be detected by standard imaging are widely present. These abnormalities may derive from lesions outside the cervical cord, or below the imaging resolution. The latter would be in accord with a MRI/pathology correlation study which showed that only about 60–70% of MS white matter lesions were detectable by T2w or FLAIR imaging, even under ideal circumstances and when it was known where the lesions should be.30 Lack of detection of abnormalities by DTI in “unaffected” tracts of NMO is consistent with a prior study of brain DTI in NMO which only detected pathology directly connected to the known NMO lesions, but not in unrelated CNS structures.31 In that study, increases in RD and MD occurred in the corticospinal tract (upstream of the spinal cord) and the optic radiations (downstream from the optic nerve), but not in the corpus callosum or cingulum. Thus, the present spinal cord DTI study is in accord with previous reports and reflects the known pathology of each disease. One interpretation of our findings is that MS DTI changes in unaffected areas may be related to a mechanism of diffuse pathology that is more typical of MS and not reported in NMO, in addition to the effect of Wallerian degeneration seen in both.
Challenges of comparing MS to NMO
When comparing spinal cord DTI in NMO versus MS, the longitudinally extensive lesions typical of NMO result in more widespread abnormalities on T2-weighted MRI than in MS, which was appreciated in this study. Thus, distinguishing between differences due to burden of disease from differences due to the underlying disease pathology in the two diseases presented a possible confounding factor in our study. However, by comparing standard sized ROIs within lesioned areas as opposed to averaging DTI parameters over the length of the cord, we were able to negate the effect of longitudinal extension. Employing linear mixed modeling in a nested fashion allowed us to account for variability between and within subjects.
Another challenge when comparing NMO and MS is that spinal cord relapses in NMO produce more sustained disability than in MS. Thus, level of disability might confound DTI comparisons of spinal cord pathology within the two diseases. In this study, EDSS was not statistically different between disease groups and a similar range of disability was studied for each. Moreover, when controlling for disability in the statistical model, all differences in DTI parameters between MS and NMO retained statistical significance. It is possible that other anatomical sites other than the cervical spinal cord contributed to disability in these subjects.
In vivo spinal cord DTI
A prior study examined and compared spinal cord DTI in NMO and MS. Using a similar case control design with healthy controls, NMO subjects and MS subjects as comparator groups, Benedetti et al. reported increased whole cord MD in NMO compared to MS.32 Whereas that study examined whole cord summary parameters, we used both a white matter tract-based, and a separate analysis of central gray matter. Because our study was able to measure individual eigenvalues within tracts, we could attribute the increased MD in NMO to increased RD. In fact, AD was decreased in both diseases, which would result in underestimation by MD of the degree of injury. Another recent study examined tract-based white matter spinal cord DTI in NMO compared to controls.33 Decreased FA, increased MD, increased RD, but no change in AD was reported without respect to individual lesion location. Of note, only FA correlated with disability level in NMO in this study. Differences in absolute DTI values between our study and this one may relate to cardiac gating and slice-level perpendicular angulation performed in our study.
Other studies have explored spinal cord DTI in MS patients. One study demonstrated decreased FA and a decreased ratio of AD to RD in patients with or without spinal cord T2 lesions, compared to controls.34 Another study compared subtypes of MS, demonstrating decreased FA to a greater extent in primary progressive MS than relapsing remitting MS or secondary progressive MS.35 Later, the same group revealed SPMS to have lower FA and increased MD compared to benign MS.36 While our study did not explore subtypes of MS, the relative changes in DTI indices in those studies and ours are highly compatible. A recent longitudinal study of spinal cord DTI following acute spinal cord MS relapses indicated that less increase in RD in corticospinal tracts immediately after injury predicted better functional recovery.37 In aggregate, these studies and ours indicate that evaluation of DTI of white matter tracts can differentiate more severe from less severe pathology.
Standard ROI approach
The novel standard ROI approach utilized herein allowed for unbiased segmentation of white and gray matter.23 Compared with tractography approaches, the advantage of the present approach is that it does not require DTI itself to map ROIs that are then used to analyze DTI parameters. Instead our method identifies standard ROIs that are only constrained by the anatomy of the individual cords. This objective technique has also been applied to evaluation of spinal cord injury.38 The present findings support spinal cord pathology in both MS and NMO. Unexpectedly, gray matter DTI did not differentiate NMO from MS. This result may reflect the fact that DTI is most suitable for analyzing anisotropic white matter tracts, but does not readily discriminate differences in pathology within gray matter. The lack of gray matter differences may also reflect the limited sample size of the gray matter regions of interest.
Study Limitations
Limitations of spinal cord DTI include errors related to effects of motion and partial volume, especially given the small cross sectional area of the cord. Moreover, the cord is physically near anatomical structures that may cause artifacts from swallowing, respiration or pulsation. To offset these effects, we gated on the peripheral pulse to mitigate the cardiac pulsation effect, discarded slices with visually apparent motion, and excluded edge voxels for both CSF-WM and GM-WM during ROI analyses. Despite these measures, residual motion-induced bias and partial volume errors in DTI measurement may still be present, but are unlikely to account for a systematic difference between NMO and MS. The relative small number of subjects in each group is another limitation, and larger studies are required to confirm the proposed conclusions.
Conclusion
In summary, the present study demonstrates the ability to dissect individual white matter tracts within the human spinal cord using DTI, and suggests that the separate assessment of axial and radial diffusivities within specific tracts may provide additional information related to pathology. Additionally, in vivo spinal cord DTI has the capacity to detect anterograde and retrograde degeneration within spinal cord tracts. In the future, spinal cord DTI might provide an additional outcome measure in clinical trials and in the clinic.
Acknowledgments
Funding Acknowledgements
This work was supported by the National Institutes of Health [P01 NS059560 to AHC, R01 NS047592 to S-KS]; and the National Multiple Sclerosis Society [RG 4009 to AHC]. ECK was supported by an American Academy of Neurology Foundation Clinical Research Training Fellowship and the National Institutes of Health (UL1RR024992). JX was supported by a National MS Society Postdoctoral Fellowship (FG 1782). RTN was supported by the National Institutes of Health (K23NS052430-01A1). TB was supported by a Bracco/American Roentgen Ray Society Scholar Award. AHC was supported in part by the Manny and Rosalyn Rosenthal-Dr. John L. Trotter Chair in Neuroimmunology of Barnes-Jewish Hospital Foundation. An institutional Clinical and Translational Science Award (UL1RR024992) from the National Center for Research Resources (NCRR), a component of the National Institutes of Health (NIH) and NIH Roadmap for Medical Research NIH, provided funding for the NeuroClinical Research Unit where research subjects were examined. This research was also supported in part by NIH grants CO6 RR020092 and RR024992 (Washington University Institute of Clinical and Translational Sciences - Brain, Behavioral and Performance Unit). Its contents are solely the responsibility of the authors and do not necessarily represent the official view of NCRR or NIH.
We are grateful for the technical and scanning assistances provided by Glenn J. Foster, Mark A. Nolte, and Scott M. Love at the Center for Clinical Imaging Research (CCIR).
Abbreviations
- NMO
neuromyelitis optica
- MS
multiple sclerosis
- MR
magnetic resonance
- DTI
diffusion tensor imaging
- AD
axial diffusivity
- RD
radial diffusivity
- FOV
field-of-view
- CSF
cerebral spinal fluid
- SNR
signal-to-noise ratio
- DW
diffusion weighted
- FA
fractional anisotropy
- ROI
region of interest
- MEDIC
multiple-echo data image combination
- STIR
short T1 inversion recovery
- EDSS
Expanded Disability Status Scale
- MD
mean diffusivity
References
- 1.Wingerchuk DM, Hogancamp WF, O’Brien PC, Weinshenker BG. The clinical course of neuromyelitis optica (Devic’s syndrome) Neurology. 1999;53:1107–14. doi: 10.1212/wnl.53.5.1107. [DOI] [PubMed] [Google Scholar]
- 2.Lucchinetti CF, Mandler RN, McGavern D, et al. A role for humoral mechanisms in the pathogenesis of Devic’s neuromyelitis optica. Brain. 2002;125:1450–61. doi: 10.1093/brain/awf151. [DOI] [PMC free article] [PubMed] [Google Scholar]
- 3.Miyazawa I, Nakashima I, Petzold A, Fujihara K, Sato S, Itoyama Y. High CSF neurofilament heavy chain levels in neuromyelitis optica. Neurology. 2007;68:865–7. doi: 10.1212/01.wnl.0000256820.26489.17. [DOI] [PubMed] [Google Scholar]
- 4.Mandler RN, Davis LE, Jeffery DR, Kornfeld M. Devic’s neuromyelitis optica: a clinicopathological study of 8 patients. Ann Neurol. 1993;34:162–8. doi: 10.1002/ana.410340211. [DOI] [PubMed] [Google Scholar]
- 5.Filippi M, Rocca MA. MR imaging of Devic’s neuromyelitis optica. Neurol Sci. 2004;25 (Suppl 4):S371–3. doi: 10.1007/s10072-004-0344-y. [DOI] [PubMed] [Google Scholar]
- 6.Cassinotto C, Deramond H, Olindo S, Aveillan M, Smadja D, Cabre P. MRI of the spinal cord in neuromyelitis optica and recurrent longitudinal extensive myelitis. J Neuroradiol. 2009;36:199–205. doi: 10.1016/j.neurad.2008.12.008. [DOI] [PubMed] [Google Scholar]
- 7.Krampla W, Aboul-Enein F, Jecel J, et al. Spinal cord lesions in patients with neuromyelitis optica: a retrospective long-term MRI follow-up study. Eur Radiol. 2009;19:2535–43. doi: 10.1007/s00330-009-1425-3. [DOI] [PubMed] [Google Scholar]
- 8.Basser PJ, Mattiello J, LeBihan D. MR diffusion tensor spectroscopy and imaging. Biophys J. 1994;66:259–67. doi: 10.1016/S0006-3495(94)80775-1. [DOI] [PMC free article] [PubMed] [Google Scholar]
- 9.Song SK, Sun SW, Ramsbottom MJ, Chang C, Russell J, Cross AH. Dysmyelination revealed through MRI as increased radial (but unchanged axial) diffusion of water. Neuroimage. 2002;17:1429–36. doi: 10.1006/nimg.2002.1267. [DOI] [PubMed] [Google Scholar]
- 10.Song SK, Yoshino J, Le TQ, et al. Demyelination increases radial diffusivity in corpus callosum of mouse brain. Neuroimage. 2005;26:132–40. doi: 10.1016/j.neuroimage.2005.01.028. [DOI] [PubMed] [Google Scholar]
- 11.Budde MD, Xie M, Cross AH, Song SK. Axial diffusivity is the primary correlate of axonal injury in the experimental autoimmune encephalomyelitis spinal cord: a quantitative pixelwise analysis. J Neurosci. 2009;29:2805–13. doi: 10.1523/JNEUROSCI.4605-08.2009. [DOI] [PMC free article] [PubMed] [Google Scholar]
- 12.Naismith RT, Xu J, Tutlam NT, et al. Increased diffusivity in acute multiple sclerosis lesions predicts risk of black hole. Neurology. 2010;74:1694–701. doi: 10.1212/WNL.0b013e3181e042c4. [DOI] [PMC free article] [PubMed] [Google Scholar]
- 13.Naismith RT, Xu J, Tutlam NT, Trinkaus K, Cross AH, Song SK. Radial diffusivity in remote optic neuritis discriminates visual outcomes. Neurology. 2010;74:1702–10. doi: 10.1212/WNL.0b013e3181e0434d. [DOI] [PMC free article] [PubMed] [Google Scholar]
- 14.Naismith RT, Tutlam NT, Xu J, et al. Optical coherence tomography differs in neuromyelitis optica compared with multiple sclerosis. Neurology. 2009;72:1077–82. doi: 10.1212/01.wnl.0000345042.53843.d5. [DOI] [PMC free article] [PubMed] [Google Scholar]
- 15.Wingerchuk DM, Lennon VA, Pittock SJ, Lucchinetti CF, Weinshenker BG. Revised diagnostic criteria for neuromyelitis optica. Neurology. 2006;66:1485–9. doi: 10.1212/01.wnl.0000216139.44259.74. [DOI] [PubMed] [Google Scholar]
- 16.McDonald WI, Compston A, Edan G, et al. Recommended diagnostic criteria for multiple sclerosis: guidelines from the International Panel on the diagnosis of multiple sclerosis. Ann Neurol. 2001;50:121–7. doi: 10.1002/ana.1032. [DOI] [PubMed] [Google Scholar]
- 17.Xu J, Sun SW, Naismith RT, Snyder AZ, Cross AH, Song SK. Assessing optic nerve pathology with diffusion MRI: from mouse to human. NMR Biomed. 2008;21:928–40. doi: 10.1002/nbm.1307. [DOI] [PMC free article] [PubMed] [Google Scholar]
- 18.Summers P, Staempfli P, Jaermann T, Kwiecinski S, Kollias S. A preliminary study of the effects of trigger timing on diffusion tensor imaging of the human spinal cord. AJNR Am J Neuroradiol. 2006;27:1952–61. [PMC free article] [PubMed] [Google Scholar]
- 19.Kroenke CD, Bretthorst GL, Inder TE, Neil JJ. Modeling water diffusion anisotropy within fixed newborn primate brain using Bayesian probability theory. Magn Reson Med. 2006;55:187–97. doi: 10.1002/mrm.20728. [DOI] [PubMed] [Google Scholar]
- 20.Kroenke CD, Bretthorst GL, Inder TE, Neil JJ. Diffusion MR imaging characteristics of the developing primate brain. Neuroimage. 2005;25:1205–13. doi: 10.1016/j.neuroimage.2004.12.045. [DOI] [PubMed] [Google Scholar]
- 21.Rowland DJ, Garbow JR, Laforest R, Snyder AZ. Registration of [18F]FDG microPET and small-animal MRI. Nucl Med Biol. 2005;32:567–72. doi: 10.1016/j.nucmedbio.2005.05.002. [DOI] [PubMed] [Google Scholar]
- 22.Basser PJ, Pierpaoli C. Microstructural and physiological features of tissues elucidated by quantitative-diffusion-tensor MRI. J Magn Reson B. 1996;111:209–19. doi: 10.1006/jmrb.1996.0086. [DOI] [PubMed] [Google Scholar]
- 23.Xu J, Klawiter EC, Shimony JS, et al. Toward repoducibile tract-specific in vivo diffusion quantification in human cervical spinal cord. Proceedings of the 18th Annual Meeting of ISMRM; Stockholm, Sweden. 2010. p. 2458. [Google Scholar]
- 24.Naismith RT, Xu J, Tutlam NT, et al. Disability in optic neuritis correlates with diffusion tensor-derived directional diffusivities. Neurology. 2009;72:589–94. doi: 10.1212/01.wnl.0000335766.22758.cd. [DOI] [PMC free article] [PubMed] [Google Scholar]
- 25.Bastin ME, Armitage PA, Marshall I. A theoretical study of the effect of experimental noise on the measurement of anisotropy in diffusion imaging. Magn Reson Imaging. 1998;16:773–85. doi: 10.1016/s0730-725x(98)00098-8. [DOI] [PubMed] [Google Scholar]
- 26.Klawiter EC, Schmidt RE, Trinkaus K, et al. Radial Diffusivity Predicts Demyelination in ex-vivo Multiple Sclerosis Spinal Cords. Neuroimage. 2011;55:1454–60. doi: 10.1016/j.neuroimage.2011.01.007. [DOI] [PMC free article] [PubMed] [Google Scholar]
- 27.Roemer SF, Parisi JE, Lennon VA, et al. Pattern-specific loss of aquaporin-4 immunoreactivity distinguishes neuromyelitis optica from multiple sclerosis. Brain. 2007;130:1194–205. doi: 10.1093/brain/awl371. [DOI] [PubMed] [Google Scholar]
- 28.Kim JH, Loy DN, Liang HF, Trinkaus K, Schmidt RE, Song SK. Noninvasive diffusion tensor imaging of evolving white matter pathology in a mouse model of acute spinal cord injury. Magn Reson Med. 2007;58:253–60. doi: 10.1002/mrm.21316. [DOI] [PubMed] [Google Scholar]
- 29.Allen IV, McQuaid S, Mirakhur M, Nevin G. Pathological abnormalities in the normal-appearing white matter in multiple sclerosis. Neurol Sci. 2001;22:141–4. doi: 10.1007/s100720170012. [DOI] [PubMed] [Google Scholar]
- 30.Geurts JJ, Bo L, Pouwels PJ, Castelijns JA, Polman CH, Barkhof F. Cortical lesions in multiple sclerosis: combined postmortem MR imaging and histopathology. AJNR American journal of neuroradiology. 2005;26:572–7. [PMC free article] [PubMed] [Google Scholar]
- 31.Yu C, Lin F, Li K, et al. Pathogenesis of normal-appearing white matter damage in neuromyelitis optica: diffusion-tensor MR imaging. Radiology. 2008;246:222–8. doi: 10.1148/radiol.2461062075. [DOI] [PubMed] [Google Scholar]
- 32.Benedetti B, Valsasina P, Judica E, et al. Grading cervical cord damage in neuromyelitis optica and MS by diffusion tensor MRI. Neurology. 2006;67:161–3. doi: 10.1212/01.wnl.0000223637.65208.7c. [DOI] [PubMed] [Google Scholar]
- 33.Qian W, Chan Q, Mak H, et al. Quantitative assessment of the cervical spinal cord damage in neuromyelitis optica using diffusion tensor imaging at 3 Tesla. J Magn Reson Imaging. 2011;33:1312–20. doi: 10.1002/jmri.22575. [DOI] [PubMed] [Google Scholar]
- 34.van Hecke W, Nagels G, Emonds G, et al. A diffusion tensor imaging group study of the spinal cord in multiple sclerosis patients with and without T2 spinal cord lesions. J Magn Reson Imaging. 2009;30:25–34. doi: 10.1002/jmri.21817. [DOI] [PubMed] [Google Scholar]
- 35.Agosta F, Absinta M, Sormani MP, et al. In vivo assessment of cervical cord damage in MS patients: a longitudinal diffusion tensor MRI study. Brain. 2007;130:2211–9. doi: 10.1093/brain/awm110. [DOI] [PubMed] [Google Scholar]
- 36.Benedetti B, Rocca MA, Rovaris M, et al. A diffusion tensor MRI study of cervical cord damage in benign and secondary progressive multiple sclerosis patients. J Neurol Neurosurg Psychiatry. 2010;81:26–30. doi: 10.1136/jnnp.2009.173120. [DOI] [PubMed] [Google Scholar]
- 37.Freund P, Wheeler-Kingshott C, Jackson J, Miller D, Thompson A, Ciccarelli O. Recovery after spinal cord relapse in multiple sclerosis is predicted by radial diffusivity. Mult Scler. 2010 doi: 10.1177/1352458510376180. [DOI] [PMC free article] [PubMed] [Google Scholar]
- 38.Cohen-Adad J, El Mendill MM, Lehericy S, et al. Demyelination and degeneration in the injured human spinal cord detected with diffusion and magnetization transfer MRI. Neuroimage. 2011;55:1024–33. doi: 10.1016/j.neuroimage.2010.11.089. [DOI] [PubMed] [Google Scholar]