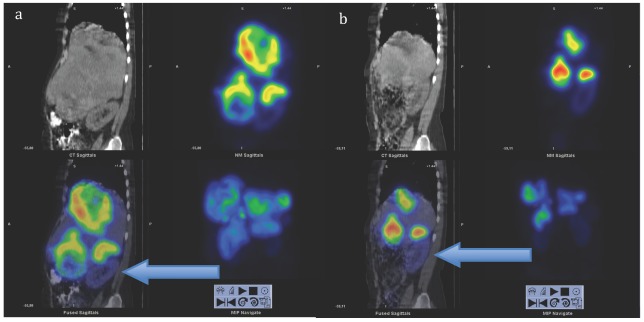
Figure 6.
Sagittal views of SPECT-CT over the abdomen at the level of the right kidney, 24 hrs after infusion of 7.4 GBq of 177Lu-DOTA-octreotate. a) Cycle 1, May 2010 b) cycle 7, August 2011. Left upper corner in each image: attenuation correction CT, right upper corner attenuation corrected SPECT, left lower corner fused SPECT-CT, right lower corner maximum intensity projection (MIP). Note the position of the right kidney (arrow) and tracer distribution within the tumours.

